一、图表样式
图表组件:echarts
https://echarts.apache.org/examples/zh/index.html
element-plus框架:
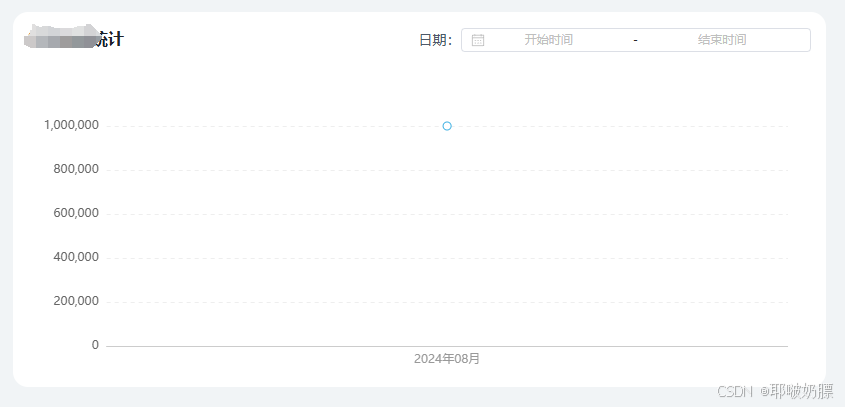
1、折线图
栅格 一共24。 12代表占一半50%, 当页面缩小到一定程度 占整个屏幕的100%。
id="money_echarts"重要,关系到图表生成放置的位置。
该折线图带有日期筛选。
value-format="YYYY-MM-DD"返回时间的格式
:disabled-date="state.disabledDate"时间限制,比如不能选择今天之后的日期。
日期说明:https://www.cwgj.xyz/zh-CN/component/date-picker.html
css
.bigChart {
        width: 100%;
        padding: 15px;
        background-color: #ffffff;
        margin-bottom: 20px;
        border-radius: 15px;

        .titleBox {
            display: flex;
            justify-content: space-between;
            align-items: center;

            .title {
                font-weight: bold;
                font-size: 16px;
                color: #1D2129;
            }

            .timeBox {
                display: flex;
                align-items: center;
                font-size: 14px;
                color: #4E5969;
            }
        }

        .broken_order {
            height: 300px;
            margin-top: 20px;
        }
    }
html
<el-col :xs="24" :lg="12">
 	 <!-- 折线图-->
    <el-row :gutter="24" style="margin: 0;">
        <div class="bigChart">
            <div class="titleBox">
                <div class="title">签单金额统计</div>
                <div class="timeBox">
                    日期:
                    <el-date-picker v-model="state.moneyTime" type="daterange" range-separator="-"
                                    start-placeholder="开始时间" end-placeholder="结束时间" size="small"
                                    @change="chooseMoneyTime" value-format="YYYY-MM-DD"
                                    :unlink-panels="true" :disabled-date="state.disabledDate">
                    </el-date-picker>
                </div>
            </div>
            <div id="money_echarts" class="broken_order"></div>
        </div>
    </el-row>
</el-col>
javascript
define(['jquery', 'bootstrap', 'backend', 'addtabs', 'table', 'echarts', 'echarts-theme', 'template'], function ($, undefined, Backend, Datatable, Table, Echarts, undefined, Template) {
var Controller = {
index: function () {
const {ref, reactive, onMounted} = Vue
const {ElMessage} = ElementPlus
const index = {
setup() {
const state = reactive({
money_start_time: '0',//开始时间
money_end_time: '0',//结束时间
disabledDate(time) {
return time.getTime() > Date.now()
}
})
onMounted(() => {
getContractMoneyStatistics()//折线图接口
})
//时间筛选
function chooseMoneyTime(val) {
if(val){
state.money_start_time = val[0]
state.money_end_time = val[1]
}else{
state.money_start_time = ''
state.money_end_time = ''
}
getContractMoneyStatistics()//刷新折线图
}
// 折线图接口
function getContractMoneyStatistics() {
$.ajax(`Consoledata/contractMoneyStatistics`, {
type: 'POST',
data: {
'start_time': state.money_start_time,
'end_time': state.money_end_time,
},
success: function (res) {
ContractMoneyStatistics(res.data) //签单金额统计折线图
}
})
}
// 折线图表
function ContractMoneyStatistics(res) {
var myChart = Echarts.init(document.getElementById('money_echarts'), 'walden');
//自适应兼容
window.addEventListener('resize', function () {
myChart.resize();
})
// 指定图表的配置项和数据
var option = {
tooltip: {
trigger: 'axis',
backgroundColor: '#6a7985', //背景颜色
borderWidth: '0', //边框为0
textStyle: {
color: '#fff', //字体颜色
},
axisPointer: {
type: 'cross',
label: {
backgroundColor: '#6a7985',
},
},
},
legend: {
data: ['订单金额', '订单数'],
zlevel: 1,
},
grid: {
left: '2%',
right: '3%',
bottom: '2%',
top: '18%',
containLabel: true, // 包含刻度文字在内
},
xAxis: [
{
type: 'category',
boundaryGap: true, //坐标轴两端空白策略
splitLine: {
show: false,
lineStyle: {
type: 'dashed'
}
},
axisTick: {
show: false, //隐藏X轴刻度
},
data: res.days,
},
],
yAxis: [
{
name: '',
type: 'value',
axisLabel: {
color: '#666',
},
//name的样式设计
nameTextStyle: {
color: '#333',
// align: 'left',
// left:'2%'
},
splitLine: {
show: true,
lineStyle: {
type: 'dashed'
}
},
axisLine: {
show: false, //隐藏Y轴线
},
axisTick: {
show: false, //隐藏Y轴刻度
},
},
{
name: '',
type: 'value',
axisLabel: {
color: '#666',
},
//name的样式设计
nameTextStyle: {
color: '#333',
align: 'left',
},
splitLine: {
show: true,
lineStyle: {
type: 'dashed'
}
},
axisLine: {
show: false, //隐藏Y轴线
},
axisTick: {
show: false, //隐藏Y轴刻度
},
},
],
series: [
{
name: '合同总金额',
type: 'line',
areaStyle: {
color: '#3DB2FF',
},
emphasis: {
focus: 'series',
},
data: res.money,
yAxisIndex: 0,
areaStyle: {
color: new Echarts.graphic.LinearGradient(0, 0, 0, 1, [{
offset: 0,
color: 'rgba(33,204,255,0.2)' // 渐变起始颜色
}, {
offset: 1,
color: 'rgba(2,193,214,0)' // 渐变结束颜色
}])
}
},
],
};
// 使用刚指定的配置项和数据显示图表。
myChart.setOption(option);
}
//方法暴露出去
return {
state,
chooseMoneyTime,
}
}
}
createApp('index', index);
}
};
return Controller;
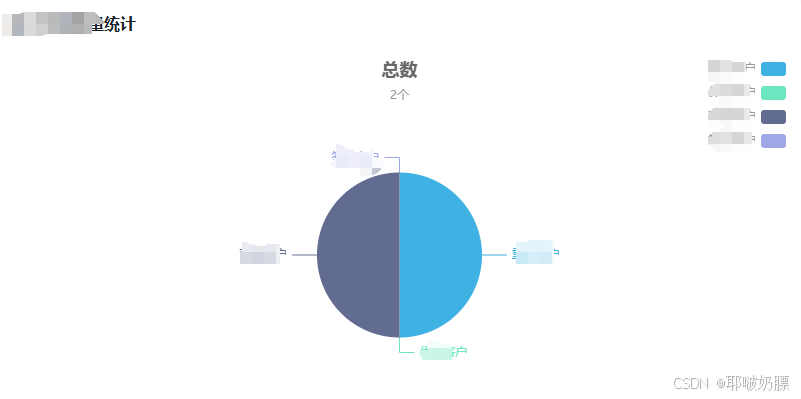
})2、饼状图
css
 .chartBox {
   margin-bottom: 15px;
   background: #FFFFFF;
   border-radius: 15px;
   padding: 15px;

   .title {
       font-weight: bold;
       font-size: 16px;
       color: #1D2129;
   }

   .card_right {
       height: 350px;
       padding: 20px 0 0;
   }
}
html
<el-col :xs="24" :lg="12">
	<div class="chartBox">
	   <div class="title">客户等级数量统计</div>
	   <div id="businessNumber_echarts" class="card_right"></div>
	</div>
</el-col>
javascript
 //饼状图
function CustomerLevel(res) {
    var myChart = Echarts.init(document.getElementById('businessNumber_echarts'), 'walden');
    window.addEventListener('resize', function () {
        myChart.resize();
    })
    var option = {
        title: {
            text: '总数',
            subtext: res.num + '个',
            left: 'center',
            top: '0',// 调整标题与图表顶部的距离
        },
        tooltip: {
            trigger: 'item'
        },
        legend: {
            orient: 'vertical',//图例竖直排列
            left: 'right',//图例位置在右上角
        },
        grid: {
            top: 150,//图表距离容器上侧的距离
            containLabel: true//是否包含坐标轴的刻度标签
        },
        series: [
            {
                name: '数量',
                type: 'pie',
                radius: '50%',//调整图表的大小
                center: ['50%', '60%'],//调整图表的位置
                data: [],
                emphasis: {
                    itemStyle: {
                        shadowBlur: 10,
                        shadowOffsetX: 0,
                        shadowColor: 'rgba(0, 0, 0, 0.5)'
                    }
                }
            }
        ]
    };
    // 替换数据
    let numDate = res.level_list.map(item => ({
        value: item.num, // 将num属性重命名为value
        name: item.name // 保留name属性
    }))
    option.series[0].data = numDate
    option && myChart.setOption(option);
}
二、其他
1、修改input框禁用状态的样式
css
input:disabled {
-webkit-text-fill-color: #000000; /* 设置文本填充颜色为黑色 */
-webkit-opacity: 1; /* 设置透明度为1,确保元素完全可见 */
padding: 0 !important;
}
.el-input.is-disabled .el-input__wrapper {
background-color: #ffffff !important; /* 设置背景颜色为白色 */
}
.el-input.is-disabled .el-input__inner {
-webkit-text-fill-color: #606266 !important;
}2、联系电话:只能输入数字
html
  <el-col :span="6">
     <el-form-item label="联系电话" class="mConentClass">
         <el-input v-model="item.mobile" style="width: 100%" :disabled="item.is_edit" type="tel"
                   oninput="value=value.replace(/[^\d]/g,'')"></el-input>
     </el-form-item>
 </el-col>
3、性别选择
多个参数,自定义参数和回调参数
html
<el-col :span="6">
	<el-form-item label="性别" class="mConentClass">
	    <el-select v-model="item.sex_text" placeholder="请选择性别"
	               :disabled="item.is_edit" @change="chooseSex(item,$event)">
	        <el-option :label="itemSex.name" :value="itemSex.id"
	                   v-for="(itemSex,indexSex) in  state.sexList"
	                   :key="indexSex"></el-option>
	    </el-select>
	</el-form-item>
</el-col>
不要忘记把方法暴露出去
javascript
function chooseSex(item, e) {
    console.log("性别", item, e);
    item.sex = e
}
4、金额的字段限制
只能输入数字,支持小数点输入。
html
<el-col :span="3">
  <el-form-item label="金额(元)" class="mConentClass">
        <el-input v-model="item.money" :disabled="item.is_edit"
         oninput="value=value.replace(/^\D*(\d*(?:\.\d{0,2})?).*$/g, '$1')">
         </el-input>
    </el-form-item>
</el-col>
oninput="value=value.replace(/^\D*(\d*(?:\.\d{0,2})?).*$/g, '$1')"只能输入数字,且只能输入到小数点后两位
5、查看下载附件
activity.files是地址
html
<el-link type="primary" :href="activity.files" target="_blank"> 查看附件</el-link>6、暂无记录样式
html
<el-col v-if="state.list.length==0" style="width: 100%;">
  <div style="width: 100%;display: flex;justify-content: center;">
       <el-empty description="暂无记录" :image-size="100"></el-empty>
   </div>
</el-col>
7、弹框
html
<el-dialog v-model="state.followPopup" title="添加" width="650" :before-close="closeFollowPopup" :close-on-click-modal="false" :center="true">
<el-form :inline="true" label-position="top" label-width="auto" class="mBaseInfoPar">
     <el-row>
         <el-col>
             <el-form-item label="附件" class="mConentClass">

             </el-form-item>
         </el-col>
     </el-row>
 </el-form>
 <template #footer>
     <div class="dialog-footer">
         <el-button @click="submitFollow">提交</el-button>
     </div>
 </template>
</el-dialog>
8、上传文件
html
 <el-upload ref="uploadRef" class="upload-demo" :action="state.uploadUrl" :auto-upload="true"
           accept=".xlsx,.xls,.pdf,.doc,.docx,.ppt" @success="uploadSuccess">
    <el-button type="primary">点击上传</el-button>
</el-upload>
javascript
setup() {
    const uploadRef = ref()
    const state = reactive({
     	uploadUrl: "/GIY5GPUbtIv0qrQgoLT.php/ajax/upload",
    	url: '',//文件上传地址
	})
	function submitFollow() {
      $.ajax(`facrm/customer/Contacts/addRrecordLog`, {
          type: 'POST',
          data: {
              'customer_id': state.id,
              'content': state.content,
              'record_type': state.record_type,
              'next_time': state.next_time,
              'url': state.url,
          },
          success: function (res) {
              if (res.code == 1) {
                  ElMessage.success(res.msg)
                  state.followPopup = false
                  state.content = ''
                  state.record_type = ''
                  state.next_time = ''
                  state.url = ''
                  uploadRef.value.clearFiles()//清除上传文件列表
                  getGenJinData()//刷新记录
              } else {

              }
          }
      })
  }

  // 追踪记录上传文件
  function uploadSuccess(e) {
      console.log(e)
      state.url = e.data.url
  }
}