1
python
import pandas as pd
import matplotlib.pyplot as plt

students = pd.read_excel('./Students.xlsx')

print('----原始数据----')
print(students)

students.sort_values(by='2017',inplace=True,ascending=False)
students.plot.bar(x='Field',y=['2016','2017'],color=['orange','red'])

plt.title('International Students by Field',fontsize=16,fontweight='bold')
plt.xlabel('Field',fontweight='bold')
plt.ylabel('Numbers',fontweight='bold')
ax = plt.gca() # 获取图表的轴
ax.set_xticklabels(students['Field'],rotation=45,ha='right')
f = plt.gcf() # 获取图表的图形
f.subplots_adjust(left=0.2,bottom=0.42)
# plt.tight_layout()
plt.show()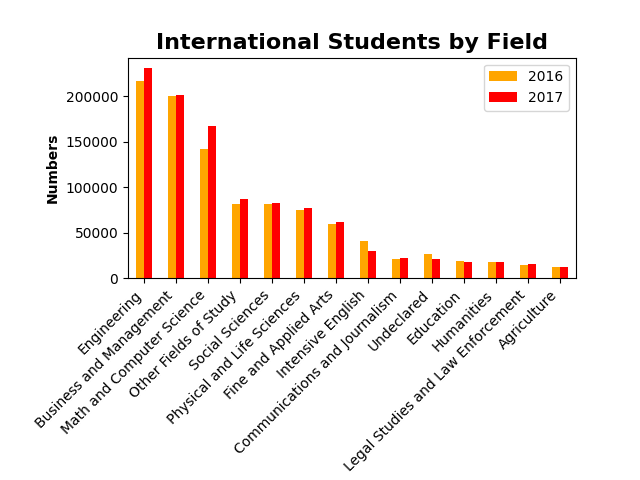
2
python
import pandas as pd
import matplotlib.pyplot as plt

users = pd.read_excel('./Users.xlsx',index_col='ID')
users['Total'] = users['Oct'] + users['Nov'] + users['Dec']
users.sort_values(by='Total',inplace=True,ascending=True)
print(users)

# stacked: 叠加(默认为False)
users.plot.barh(x='Name',y=['Oct','Nov','Dec'],stacked=True,title='User Behavior')

plt.tight_layout()
plt.show()

# 补充说明
# users.plot.bar(...) 表示制作竖直柱状图
# users.plot.barh(...) 表示制作水平柱状图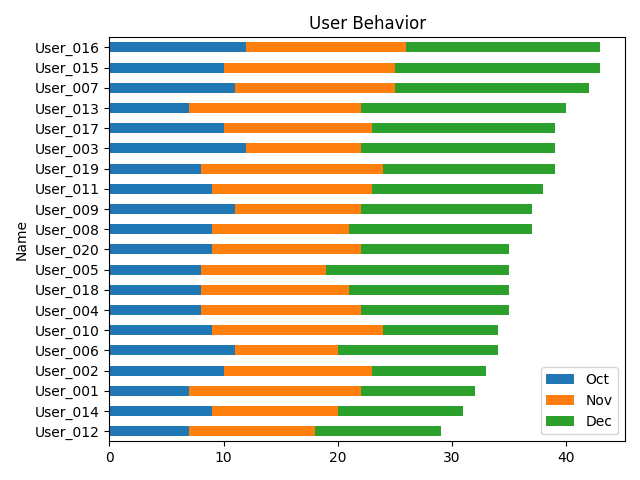
3
资源部分原创部分整理自网络,仅供分享