CentOS 7.9安装ElasticSearch7.14.0、ElasticSearch-Head、Kibana、Node14.18.2
1.安装文件
1. elasticsearch-7.14.0-linux-x86 64.tar.gz
2. elasticsearch-head-master.zip
3. jdk-11 linux-x64 bin.tar.gz
4. kibana-7.14.0-linux-x86 64.tar.gz
5. node-v14.18.2-linux-x64.tar.gz
elasticsearch 7.14.0
下载地址:https://www.elastic.co/cn/downloads/past-releases/elasticsearch-7-14-0
elasticsearch-head 插件
下载地址:https://github.com/mobz/elasticsearch-head/
Kibana 7.14.0 插件
下载地址:https://www.elastic.co/cn/downloads/past-releases/kibana-7-14-0
node 14.18.2
下载地址:https://registry.npmmirror.com/binary.html?path=node/v14.18.2/
根据系统环境下载对应安装包,本文系统环境为 CentOS Linux release 7.9.2009 (Core)
2.安装JDK11
2.1解压安装包到指定目录
tar -xzvf jdk-11_linux-x64_bin.tar.gz -C /usr/local/java2.2配置环境变量
vi /etc/profile
增加以下内容:
export JAVA_HOME=/usr/local/java/jdk-11

export ES_JAVA_HOME=$JAVA_HOME

export PATH=$JAVA_HOME/bin:$PATH
2.3变量生效命令
source /etc/profile2.4验证jdk
[root@localhost es]# java -version
java version "11" 2018-09-25
Java(TM) SE Runtime Environment 18.9 (build 11+28)
Java HotSpot(TM) 64-Bit Server VM 18.9 (build 11+28, mixed mode)
3.安装ES 7.14.0
3.1解压缩ES安装包到指定目录
tar -xzvf elasticsearch-7.14.0-linux-x86_64.tar.gz -C /usr/local/elastic/3.2创建ES用户并授权文件夹权限
ES不允许以root身份运行,因此需要先创建专用用户,创建一个elastic用户,专门用于启动ES相关的内容
创建用户
 useradd elastic
设置密码
 passwd elastic

授权elastic用户指定文件夹
chown -R elastic:elastic /usr/local/elastic/elasticsearch-7.14.0/

查看授权是否成功
getfacl /usr/local/elastic/elasticsearch-7.14.0/
3.3修改ES默认配置文件elasticsearch.yml
本配置文件为单机ES并非集群ES,集群ES配置参考其他配置
编辑elasticsearch.yml
vim /usr/local/elastic/elasticsearch-7.14.0/config/elasticsearch.yml

#名称
cluster.name: my-application
#节点名称
node.name: node-1
#IP
network.host: 0.0.0.0
#端口号
http.port: 9200
#主节点名称
cluster.initial_master_nodes: ["node-1"]
#允许跨域访问
http.cors.enabled: true
http.cors.allow-origin: "*"
依据机器配置自行判断是否需要修改jvm 如果配置内存足够大4G以上,则可以不修改这个配置
编辑jvm堆大小
vim /usr/local/elastic/elasticsearch-7.14.0/config/jvm.options

找到如下描述
## The heap size is automatically configured by Elasticsearch
## based on the available memory in your system and the roles
## each node is configured to fulfill. If specifying heap is
## required, it should be done through a file in jvm.options.d,
## and the min and max should be set to the same value. For
## example, to set the heap to 4 GB, create a new file in the
## jvm.options.d directory containing these lines:
##
下方设置成1G大小 默认4G
-Xms1g
-Xmx1g
修改ES分页查询数量配置
vim /etc/security/limits.conf
#添加下边两行
elastic soft nofile 65536

elastic hard nofile 131072
3.4启动ES
#切换elastic用户
su elastic
#进入指定目录
cd /usr/local/elastic/elasticsearch-7.14.0/bin
#启动
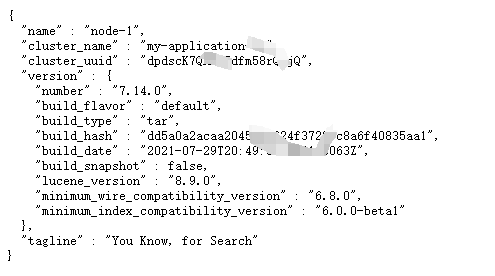
./elasticsearch -d3.5查看是否启动成功
查看ES日志 路径 /usr/local/elastic/elasticsearch-7.14.0/log
出现如下结果说明成功
4.安装node-v14.18.2
4.1解压node-v14.18.2-linux-x64.tar.gz到指定目录
#解压
tar -xzvf node-v14.18.2-linux-x64.tar.gz -C /usr/local/node/
4.2配置环境变量、验证、安装cnpm
#设置环境变量
vim /etc/profile
#增加下方两行
export NODE_HOME=/usr/local/node/node-v14.18.2-linux-x64/
export PATH=$NODE_HOME/bin:$PATH
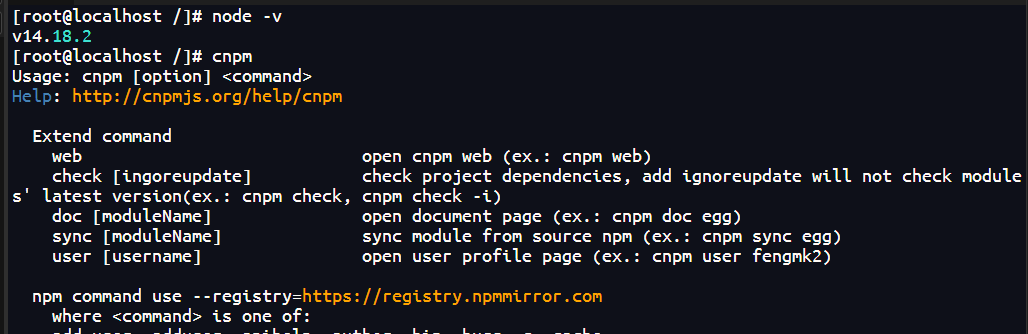
#验证
[root@localhost /]# node -v
v14.18.2
#安装cnpm
npm install -g cnpm --registry=https://registry.npm.taobao.org
#验证cnpm
cnpm或cnpm -v成功如下图
5.安装elasticsearch-head
5.1解压缩
#解压到指定目录
unzip elasticsearch-head-master.zip -d /usr/local/elastic/head/
这里不要把head插件放到elasticsearch-7.14.0/plugins中,我就吃了这个亏导致ES启动不了,原因没有深入去查,最好单独放在一个目录
5.2编译、启动
#编译
cd /usr/local/elastic/head/elasticsearch-head-master
cnpm install
#启动
nohup cnpm run start &
#查看日志
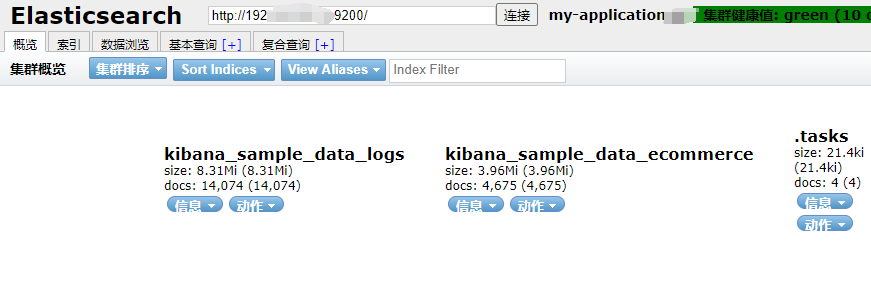
tail -f nohup.out5.3访问验证
访问链接 http://x.x.x.x:9100/
6.安装kibana-7.14.0
6.1kibana的介绍及作用我折叠了 可展开查看


Kibana 是一个开源的数据可视化和分析平台,它主要用于和 Elasticsearch 一起工作,Elasticsearch 是一个强大的搜索引擎,用于存储、搜索和分析大量数据。
以下是 Kibana 可以做到的一些主要功能:
1.数据可视化:
创建各种图表,如折线图、柱状图、饼图、地图、热图等。
使用 Vega 语言进行更高级的自定义可视化。
2.仪表盘:
将多个可视化图表组合成仪表盘,用于监控和分析关键指标。
仪表盘可以保存、分享和定时刷新。
3.探索和数据分析:
使用 Discover 功能搜索和浏览 Elasticsearch 索引中的数据。
对数据进行过滤、聚合和排序。
4.日志分析:
分析日志数据,帮助开发者了解应用和系统的行为。
使用 Canvas 制作详细的日志分析报告。
5.监控:
监控 Elasticsearch 集群的运行状况和性能。
设置警报来通知关键性能指标的变化。
6.机器学习:
利用 Elastic Stack 的机器学习功能来识别数据中的异常模式、趋势和预测。
7.地图:
利用地理空间数据创建地图可视化,用于位置分析和可视化。
8.管理:
管理 Elasticsearch 索引模式,定义如何在 Kibana 中显示 Elasticsearch 索引的数据结构。
9.自定义应用:
开发自定义的 Kibana 应用程序,扩展 Kibana 的功能。
10.协作:
共享仪表盘和可视化,与团队成员协作。
11.安全性:
配置基于角色的访问控制,确保只有授权的用户可以访问特定的数据和功能。

Kibana 通常被用于以下场景:
应用程序性能监控(APM)
日志聚合和分析
服务器和基础设施监控
安全分析,如检测异常行为和入侵模式
业务智能分析
Kibana 的强大之处在于其与 Elasticsearch 的紧密集成,使得处理大量数据变得简单高效。随着 Elastic Stack 的发展,Kibana 还在不断添加新的特性和功能。
View Code
6.2解压缩kibana到指定目录
tar -xzvf kibana-7.14.0-linux-x86_64.tar.gz -C /usr/local/elastic/kibana/6.3修改配置文件
#进入指定目录
cd /usr/local/elastic/kibana/kibana-7.14.0-linux-x86_64/config/kibana.yml

#编辑配置文件
#端口
server.port: 5601
#IP
server.host: "0.0.0.0"
#ES地址
elasticsearch.hosts: ["http://localhost:9200"]
#其他配置可根据实际情况修改
6.4启动kibana
kibana不允许使用root用户启动运行,需要切换elastic用户并分配文件夹授权,同ES授权同理
#切换用户
su elastic
#进入指定目录
cd /usr/local/elastic/kibana/kibana-7.14.0-linux-x86_64
#后台启动命令
nohup ./bin/kibana &
#或者直接启动命令 退出服务也会退出
./bin/kibana
#查看日志
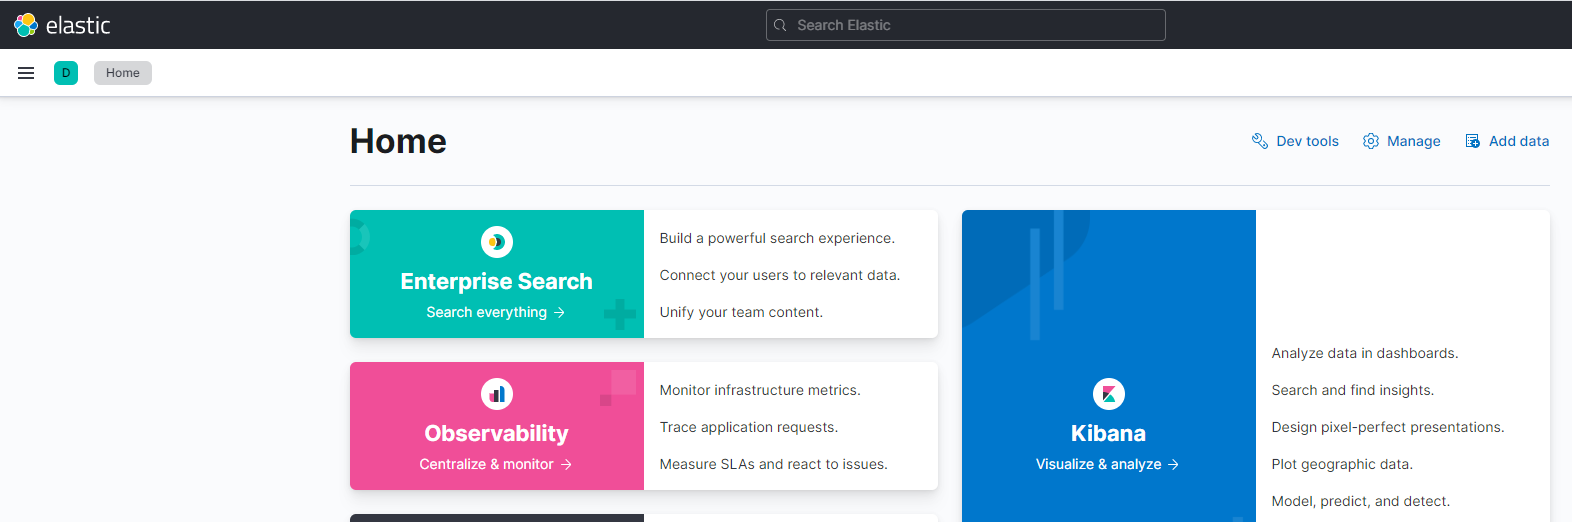
tail -f tail -f nohup.out6.5验证kibana
出现如下界面说明成功啦
7.总结
全部安装完成,总结启动各组件命令
启动ES
su elastic
cd /usr/local/elastic/elasticsearch-7.14.0/bin
./elasticsearch -d
启动Kibana
su elastic
cd /usr/local/elastic/kibana/kibana-7.14.0-linux-x86_64
nohup ./bin/kibana &
启动elasticsearch-head
cd /usr/local/elastic/head/elasticsearch-head-master
nohup cnpm run start &