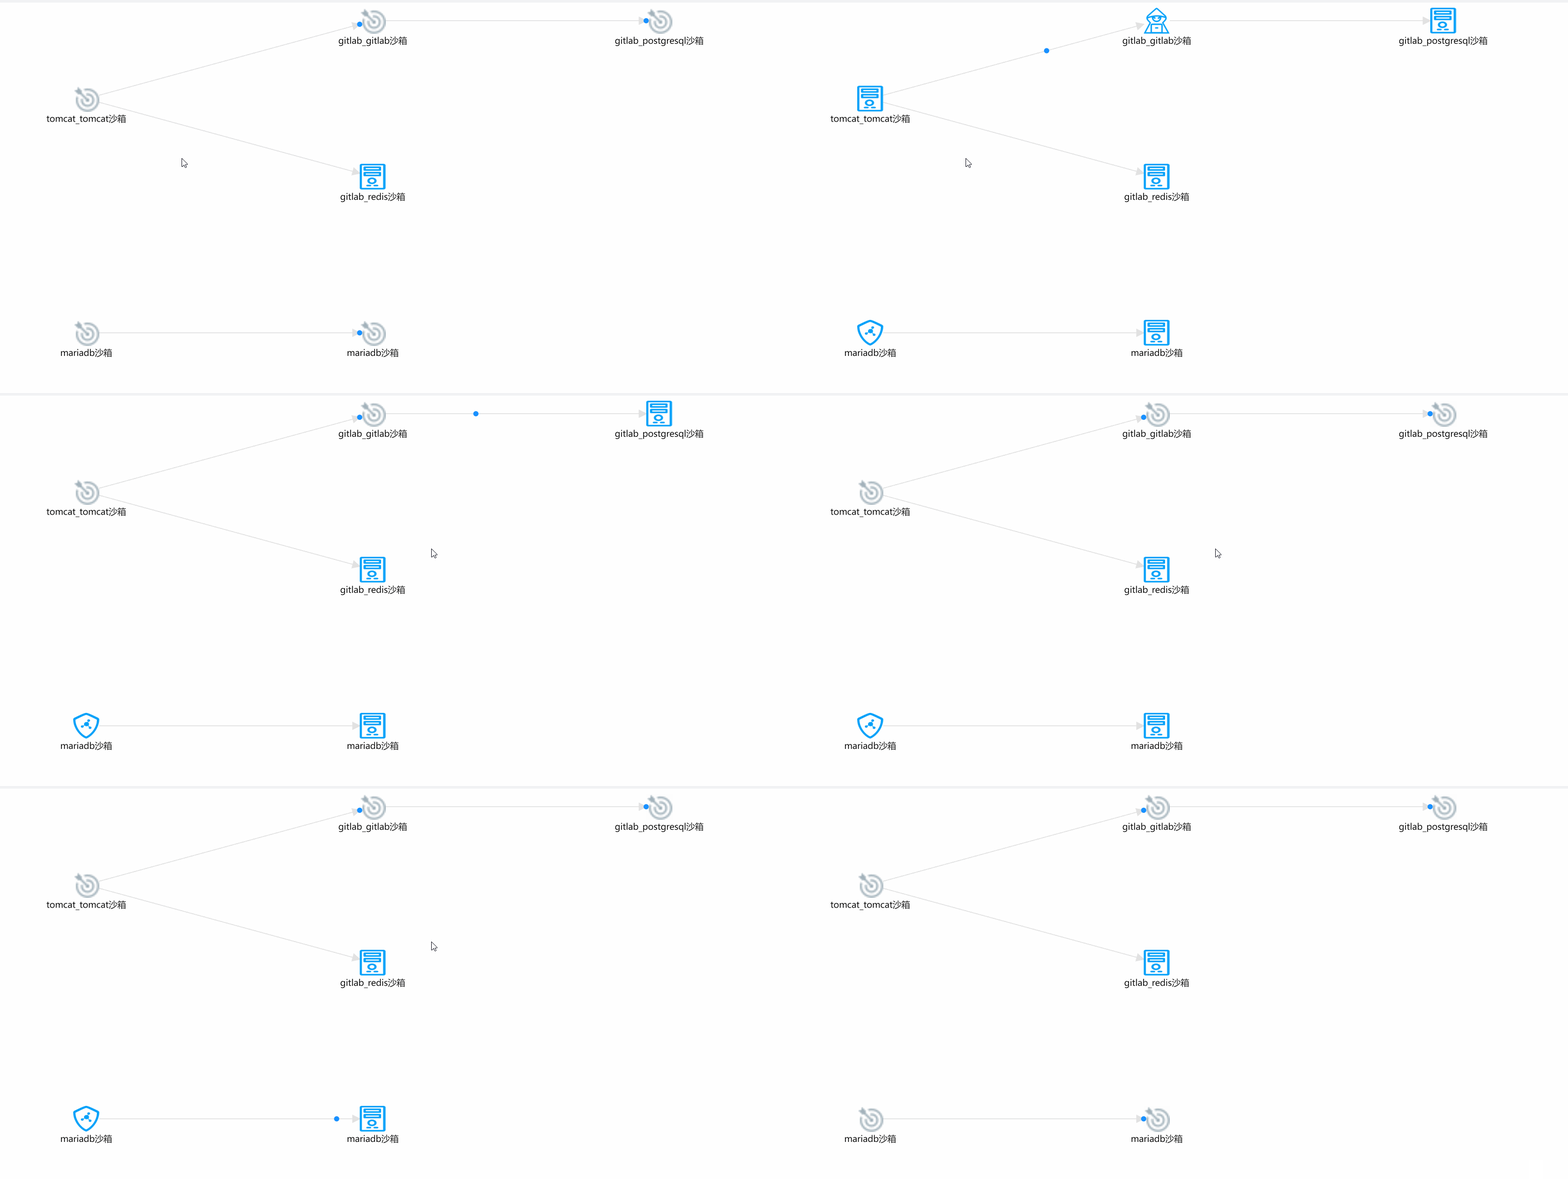
前言:antvG6是一个简单、易用、完备的图可视化引擎,官网上有很多图表示例,大家可以选用不同的布局来进行开发。官网链接:G6 Demos - AntV。
本篇主要讲解的是antvG6的节点和连线的动画、以及不同节点展示不同图标如何实现
一、效果展示

二、实现步骤
1、先安装依赖
npm i --save @antv/g6@^4.8.17
2、html代码:
html
  <div class="app-container">
    <div id="container"> </div>
  </div>
3、引入G6
javascript
import G6 from '@antv/g6';4、定义数据信息(节点和连线)
javascript
let topuData = ref({
    nodes: [
      {
        id: 'node1', //节点id,唯一值
        shape: 'hexagon', //图标类型
        label: 'tomcat_tomcat沙箱', //节点要显示的名称
      },
      {
        id: 'node2',
        shape: 'cloud',
        label: 'gitlab_gitlab沙箱',
      },
      {
        id: 'node3',
        shape: 'hexagon',
        label: 'gitlab_redis沙箱',
      },
      {
        id: 'node4',
        shape: 'hexagon',
        label: 'gitlab_postgresql沙箱',
      },
      {
        id: 'node5',
        shape: 'topu_other',
        label: 'mariadb沙箱',
      },
      {
        id: 'node6',
        shape: 'hexagon',
        label: 'mariadb沙箱',
      },
    ],
    edges: [
      {
        type: 'line', //连线类型,默认传就行
        source: 'node1', //连线起点
        target: 'node2', //连线终点
      },
      {
        type: 'line',
        source: 'node2',
        target: 'node4',
      },
      {
        type: 'line',
        source: 'node1',
        target: 'node3',
      },
      {
        type: 'line',
        source: 'node5',
        target: 'node6',
      },
    ],
  });
5、图表初始化函数:
javascript
let graph;
let container;
const createGraph = () => {
    container = document.getElementById('container');
    graph = new G6.Graph({
      container: 'container',
      width: container.offsetWidth, // 画布宽
      height: 700, // 画布高
      pixelRatio: 2,
      fitView: true,
      modes: {
        default: ['drag-canvas', 'drag-node'],
      },
      layout: {
        type: 'dagre',
        rankdir: 'LR',
        nodesep: 50,
        ranksep: 100,
        width: container.offsetWidth - 20, // 画布宽
        height: 500, // 画布高
      },
      defaultNode: {
        size: [50], // 设置每个节点的大小
        labelCfg: {
          style: {
            fontSize: 12,
          },
        },
      },
      defaultEdge: {
        size: 1,
        type: 'line',
        color: '#e2e2e2',
        style: {
          endArrow: {
            path: 'M 0,0 L 8,4 L 8,-4 Z',
            fill: '#e2e2e2',
          },
        },
      },
    });
    // 设置初始缩放和位移
    graph.zoom(1); // 设置缩放比例
    graph.moveTo(0, 0); // 移动视口,使 (0,0) 在左上角
    graph.data(topuData.value);

    graph.render();

    if (typeof window !== 'undefined')
      window.onresize = () => {
        if (!graph || graph.get('destroyed')) return;
        if (!container || !container.scrollWidth || !container.scrollHeight) return;
        graph.changeSize(container.scrollWidth, container.scrollHeight);
      };
  };
6、实现需求:不同节点展示不同图标
将以下代码写在初始化函数中,在graph.render()之前
javascript
graph.node(function (node) {
      if (node.shape == 'hexagon') {
        return {
          type: 'image',
          img: new URL('./testWeb/dashboard/topu_serve.png', import.meta.url).href,
          size: [30, 30],
          labelCfg: {
            style: {
              fontSize: 10,
            },
          },
        };
      }
      if (node.shape == 'cloud') {
        return {
          type: 'image',
          img: new URL('./testWeb/dashboard/topu_attacker.png', import.meta.url).href,
          size: [30, 30],
          labelCfg: {
            style: {
              fontSize: 10,
            },
          },
        };
      }
      return {
        type: 'image',
        img: new URL('./testWeb/dashboard/topu_other.png', import.meta.url).href,
        size: [30, 30],
        labelCfg: {
          style: {
            fontSize: 10,
          },
        },
      };
    });
用节点数据里面的shape来决定用哪个图标
7、注册连线动画
也是写在初始化函数里面
javascript
    G6.registerEdge(
      'attack',
      {
        afterDraw(cfg, group) {
          const shape = group.get('children')[0]; // get the first shape in the group, it is the edge's path here=
          const startPoint = shape.getPoint(0); // the start position of the edge's path
          const circle = group.addShape('circle', {
            attrs: {
              x: startPoint.x,
              y: startPoint.y,
              fill: '#1890ff',
              r: 3,
            },
            name: 'circle-shape',
          });
          circle.animate(
            (ratio) => {
              // the operations in each frame. Ratio ranges from 0 to 1 indicating the prograss of the animation. Returns the modified configurations
              // get the position on the edge according to the ratio
              const tmpPoint = shape.getPoint(ratio);
              // returns the modified configurations here, x and y here
              return {
                x: tmpPoint.x,
                y: tmpPoint.y,
              };
            },
            {
              repeat: false, // Whether executes the animation repeatly
              duration: 4000, // the duration for executing once
            }
          );
        },
      },

      'line' // extend the built-in edge 'cubic'
    );
这里可以当做我们 注册了一个叫attack的连线动画
8、将节点和连线动画连起来
selectNodes是我们想要产生动画的节点,如果节点之前没有连线就意味着是另一条新的连线
javascript
let selectNodes = ref(['node1', 'node2', 'node4', 'node5', 'node6']);
javascript
  const allNodesEvt = ref([]);
  const allEdgesEvt = ref([]);
  let selectEvt;
  let timeoutId;
//图片闪烁函数
  const flashFn = (item) => {
    const model = item.getModel();
    // 切换图片
    const originalImg = model.img;
    const flashingImg = new URL('./testWeb/dashboard/gj.png', import.meta.url).href; // 闪烁图片

    // 开始闪烁效果
    let isFlashing = true;
    let flashCount = 0; // 计数闪烁次数
    const maxFlashes = 6; // 最大闪烁次数(3次切换)

    const flashInterval = setInterval(() => {
      if (flashCount >= maxFlashes) {
        clearInterval(flashInterval);
        item.update({ img: flashingImg }); // 恢复原始图片
        return;
      }
      item.update({ img: isFlashing ? flashingImg : originalImg });
      isFlashing = !isFlashing;
      flashCount++;
    }, 500); // 每500毫秒切换一次
  };
  const edgeFlashFn = (a, b) => {
    // 遍历 allEdgesEvt,筛选符合条件的边
    for (let i = 0; i < allEdgesEvt.value.length; i++) {
      if (
        allEdgesEvt.value[i].getModel().source == a &&
        allEdgesEvt.value[i].getModel().target == b
      ) {
        allEdgesEvt.value[i].update({
          type: 'attack',
        });
      }
    }
  };
  onMounted(() => {
    container = document.getElementById('container');
    createGraph();
    nextTick(() => {
      allNodesEvt.value = graph.getNodes();
      allEdgesEvt.value = graph.getEdges();
      selectEvt = selectNodes.value
        .map((id) => {
          return allNodesEvt.value.find((node) => node._cfg.id == id);
        })
        .filter(Boolean);
      selectEvt.forEach((item, index) => {
        timeoutId = setTimeout(() => {
          flashFn(item);
          edgeFlashFn(selectNodes.value[index], selectNodes.value[index + 1]);
        }, 4000 * index); // 延迟 4秒
      });
    });
  });