1 前言
本章主要对常用的echars图表展示进行基本的组件封装。使用该组件前需要在项目中引入echarts。官网:Apache ECharts
npm install echarts --save2 图表组件
2.1 折线图组件
组件属性:chartId,指定图表挂载div的id,注意不要出现重复。当获取到数据后,在父组件中调用该组件的initChart() 方法,初始化图表。方法参数格式范例:
javascript
{
    "xAxis":['项1', '项2', '项3'],
    "yAxis":[12, 11, 122]
}- xAxis:横坐标名称
- yAxis:每项对应的数据量
组件代码:
javascript
<script setup lang="ts">
import * as echarts from 'echarts'

const props = defineProps<{
  chartId: string
}>()

const initChart = (data: any) => {
  const chartDom = document.getElementById(props.chartId);
  var myChart = echarts.init(chartDom);
  var option;

  option = {
    tooltip: {
      trigger: 'axis',
      axisPointer: {
        type: 'shadow'
      }
    },
    xAxis: {
      type: 'category',
      data: data.xAxis,
    },
    yAxis: {
      type: 'value'
    },
    series: [
      {
        data: data.yAxis,
        type: 'line'
      }
    ]
  };

  option && myChart.setOption(option);
}

defineExpose({ initChart })
</script>

<template>
  <div :id="chartId" style="width: 100%; height: 100%"></div>
</template>

<style scoped>

</style>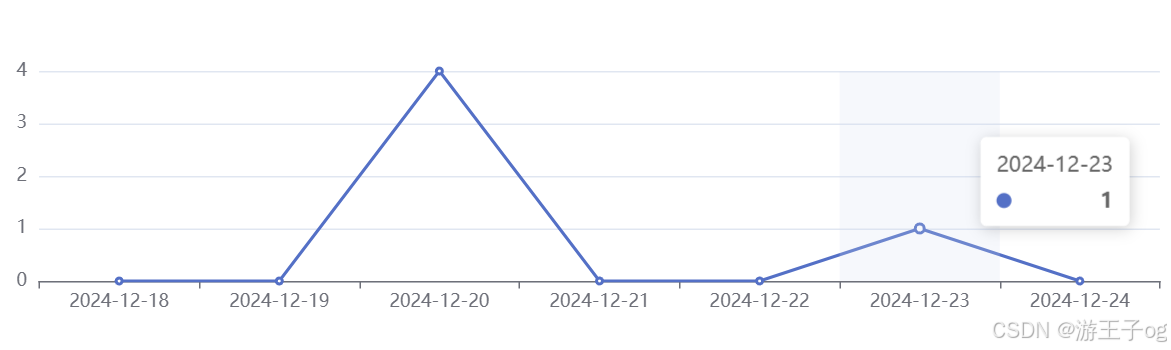
2.2 柱状图组件
组件属性:chartId,指定图表挂载div的id,注意不要出现重复。当获取到数据后,在父组件中调用该组件的initChart() 方法,初始化图表。方法参数格式范例:
javascript
{
    "xAxis":['项1', '项2', '项3'],
    "yAxis":[12, 11, 122]
}- xAxis:横坐标名称
- yAxis:每项对应的数据量
组件代码:
javascript
<script setup lang="ts">
import * as echarts from 'echarts'

const props = defineProps<{
  chartId: string
}>()

const initChart = (data: any) => {
  const chartDom = document.getElementById(props.chartId);
  var myChart = echarts.init(chartDom);
  var option;

  option = {
    tooltip: {
      trigger: 'axis',
      axisPointer: {
        type: 'shadow'
      }
    },
    xAxis: {
      type: 'category',
      data: data.xAxis,
    },
    yAxis: {
      type: 'value'
    },
    series: [
      {
        data: data.yAxis,
        type: 'bar'
      }
    ]
  };

  option && myChart.setOption(option);
}

defineExpose({ initChart })
</script>

<template>
  <div :id="chartId" style="width: 100%; height: 100%"></div>
</template>

<style scoped>

</style>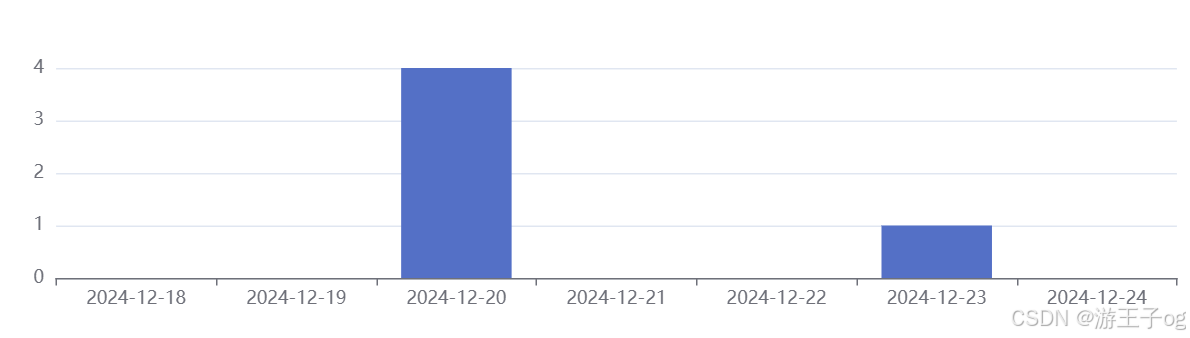
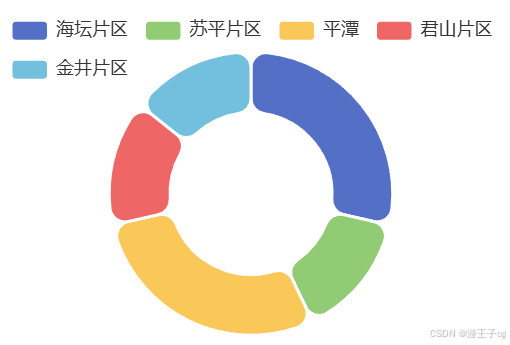
2.3 饼图组件
组件属性:chartId,指定图表挂载div的id,注意不要出现重复。当获取到数据后,在父组件中调用该组件的initChart() 方法,初始化图表。方法参数格式范例:
html
[
        { value: 1048, name: '数据项1' },
        { value: 735, name: '数据项2' },
        { value: 580, name: '数据项3' },
        { value: 484, name: '数据项4' },
        { value: 300, name: '数据项5' }
      ]
组件代码:
html
<script setup lang="ts">
import * as echarts from 'echarts'

const props = defineProps<{
  chartId: string
}>()

const initChart = (data: any) => {
  type EChartsOption = echarts.EChartsOption;

  const chartDom = document.getElementById(props.chartId)!
  const myChart = echarts.init(chartDom)
  let option: EChartsOption

  option = {
    tooltip: {
      trigger: 'item'
    },
    legend: {
      top: '5%',
      left: 'center'
    },
    series: [
      {
        name: '数据量',
        type: 'pie',
        radius: ['40%', '70%'],
        avoidLabelOverlap: false,
        itemStyle: {
          borderRadius: 10,
          borderColor: '#fff',
          borderWidth: 2
        },
        label: {
          show: false,
          position: 'center'
        },
        emphasis: {
          label: {
            show: true,
            fontSize: 20,
            fontWeight: 'bold'
          }
        },
        labelLine: {
          show: false
        },
        data: data
      }
    ]
  }
  option && myChart.setOption(option)
}

defineExpose({ initChart })
</script>

<template>
  <div :id="chartId" style="width: 100%; height: 100%"></div>
</template>

<style scoped>

</style>