The idea is that you don't always need Selenium or BeautifulSoup to scrape data from websites. You can find references to data sources in plain HTML.
The problem with scraping is that HTML selectors are hard to pinpoint. They are also prone to changing if the interface changes and if identifiers such as IDs and classes are dynamically generated.
Today I will show you an alternative approach. Of course, this approach doesn't work all the time, it depends on the site in question. Many sites protect their data sources and offer paid access through official APIs. Some however do not, either by negligence or because they thought nobody would ever look.
Let's explore one of the examples - Flightaware.com. Normally, the flight information data that the site provides is hidden behind a paywall, but is accessible in the processed form on the main page.

If you scroll down the main page, you will see an interactive map of flights in your area.

If you click on one of the planes, you will be taken to the flight information page. The data it offers although informative but is very limited. Some of it very much scrapable with the aforementioned tools, some of it is abstracted away in charts and cannot be accessed programatically.
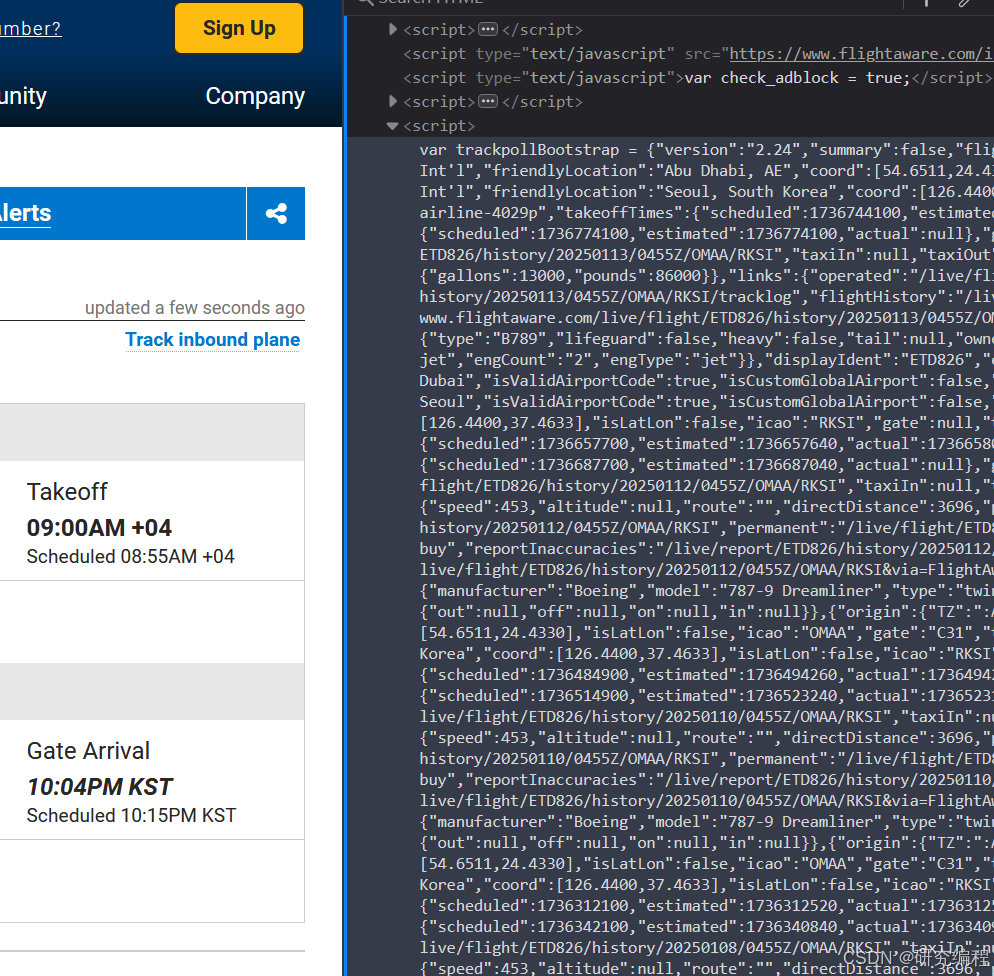
What if we explore the HTML source code of the page?

Scrolling through the DOM, we can see some TOKEN references, references to the template engine...


And unexpectedly, a long string of what looks like JSON data stored in a variable trackpollBootstrap. Interesting!
Let's look at it in Python.
python
import requests
import re
import json

# FLIGHT_NUMBER = "CBJ606"
# FLIGHT_NUMBER = "TYA3422"
FLIGHT_NUMBER = "ETD826"


def get_flight_data(flight_id: str) -> dict:
    try:
        url = f"https://flightaware.com/live/flight/{flight_id}"

        headers = {
            "User-Agent": "Mozilla/5.0 (Windows NT 10.0; Win64; x64) AppleWebKit/537.36 (KHTML, like Gecko) Chrome/99.0.4844.51 Safari/537.36"
        }
        page_source = requests.get(url, headers=headers).text

        scripts = re.findall(r"<script>(.*)</script>", page_source)

        script = scripts[-1].strip(";").removeprefix("var trackpollBootstrap = ")

        data = json.loads(script)

        return data

    except Exception as e:
        print(e)


data = get_flight_data(FLIGHT_NUMBER)
We will use ETD826 flight ID in this tutorial. You can try other IDs as well.
First, we prepare the target URL with the following structure: url = f"https://flightaware.com/live/flight/{flight_id}".
Second, we prepare some headers so as to pretend we are a real browser and get the source HTML of the page.
Because, the data lives in one of the <script> tags, we search for all the script tags with RegEx. This gives us the contents of those tags:
scripts = re.findall(r"<script>(.*)</script>", page_source)
The target script is actually the last one in the list. We process it as text, stripping all of the JavaScript bits:
script = scripts[-1].strip(";").removeprefix("var trackpollBootstrap = ")
And finally load it as JSON: data = json.loads(script).
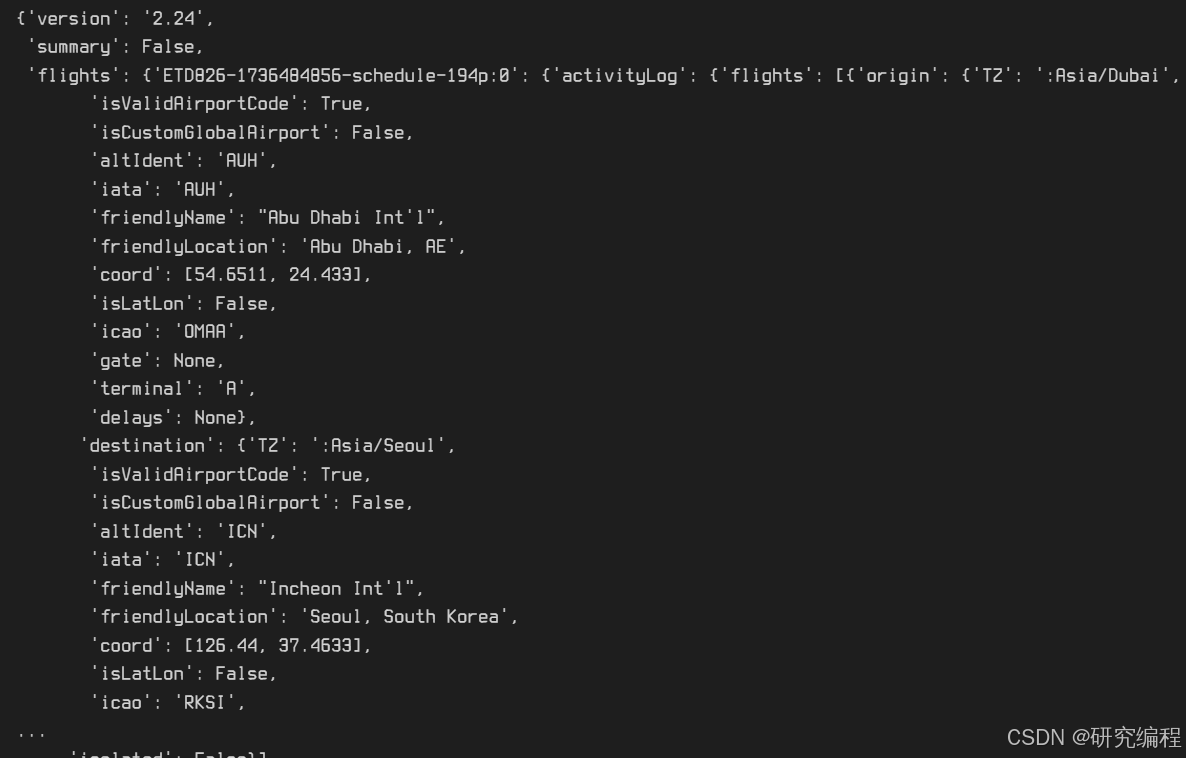
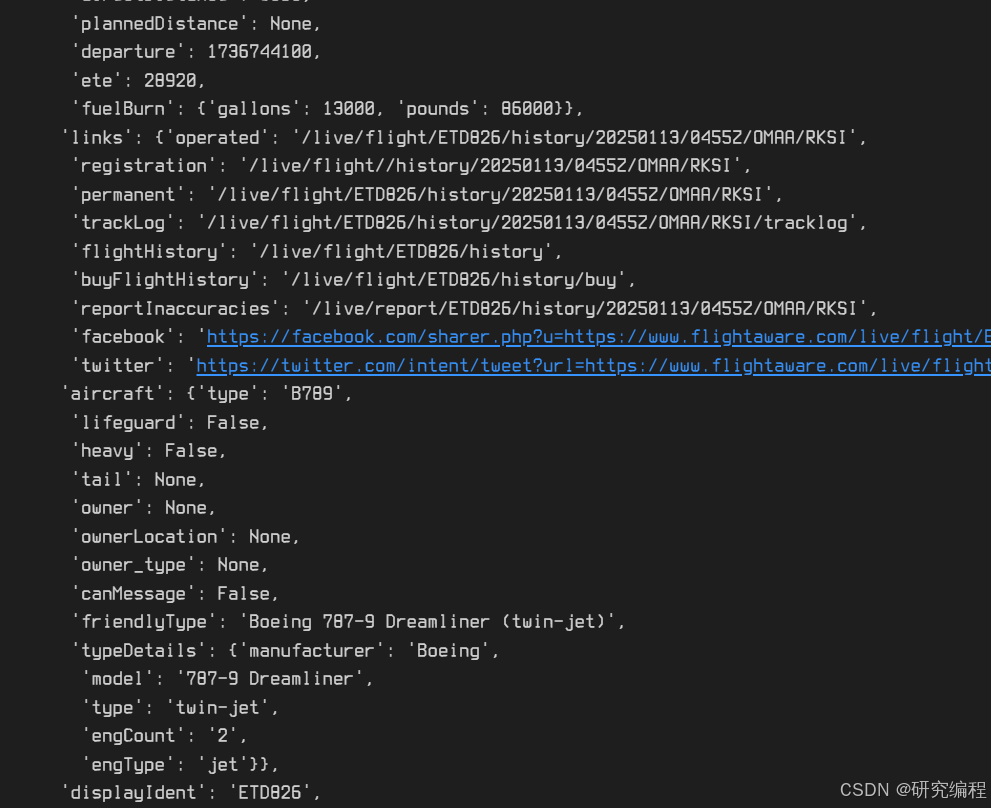
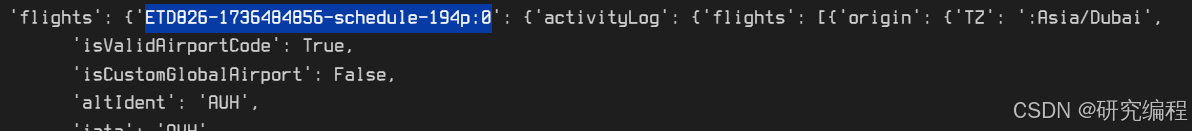
What we are looking for is the flights key. It contains all flight information, aircraft and airline information, origin and destination information, even the amount of fuel burned in flight.
It also contains the track information - the coordinates of all the checkpoints on the map.
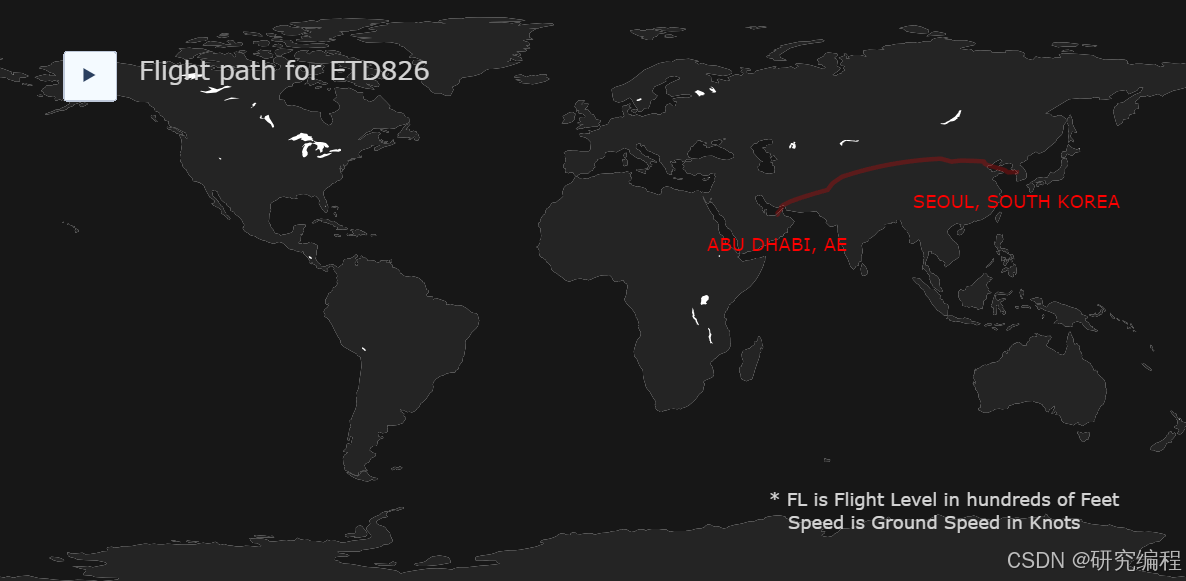
Let's use this data to recreate the flight path.
In order to get to the track data, we need to traverse the data dictionary, which requires 3 steps.
python
track_data = data["flights"]["ETD826-1736484856-schedule-194p:0"]["track"]I discovered that this the key ETD826-1736484856-schedule-194p:0 is dynamic and changes after each new flight, but we need to know the value of this key in order to get to the track data.
We can use the following expression in place of the key, which will get us to the track data, even if the value changes. It simply returns the next child value in the dictionary tree.
python
track_data = data["flights"][next(iter(data["flights"]))]["track"]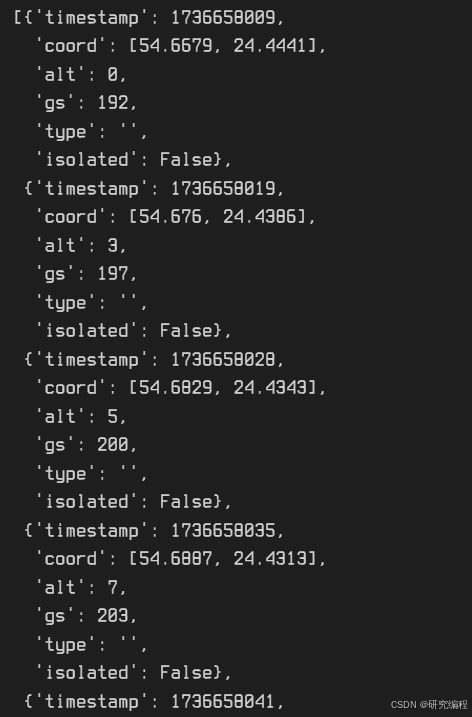
Here we have the coordinates of the flight path on the route, the speed and altitude (I assume in the last flight) and the time of passing of each waypoint.
Let's load this data into Pandas.
python
import pandas as pd

df = pd.DataFrame(track_data)

df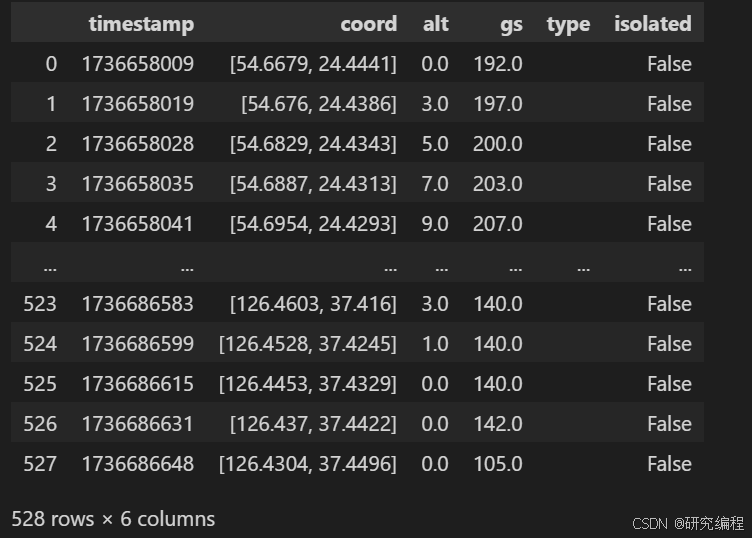
Let's separate the coordinates into latitude and longitude. First, we represent the coords column as string, because for some reason it was loaded as float datatype. Second, we strip the brackets and, finally, split the column into two. We also drop the coords column, as it is no longer needed.
python
df["coord"] = df["coord"].map(repr)

df["coord"] = df["coord"].str.replace("[", "").str.replace("]", "")

df[["lon", "lat"]] = df["coord"].str.split(", ", expand=True)
df = df.drop("coord", axis=1)

df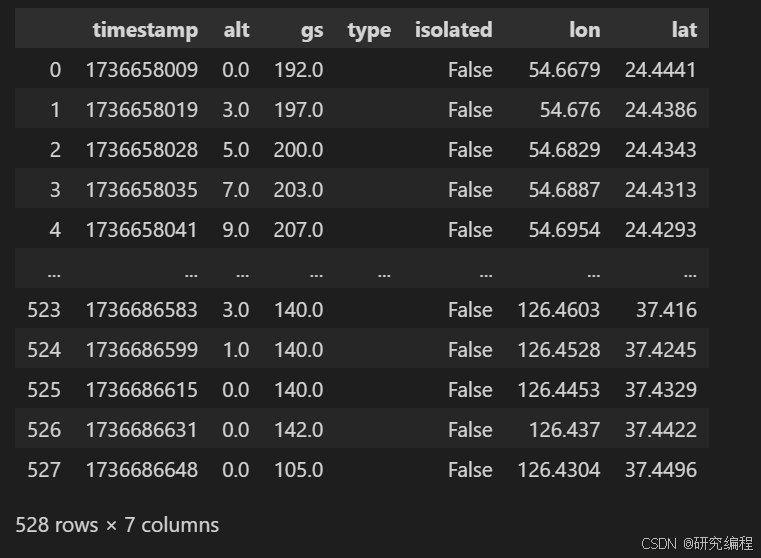
Let's plot the data.
python
import plotly.graph_objects as go
import pandas as pd

fig = go.Figure()

fig.add_trace(
    go.Scattergeo(
        locationmode="country names",
        lon=df["lon"],
        lat=df["lat"],
        hoverinfo="text",
        text=df["alt"],
        mode="lines",
        line=dict(width=3, color="red"),
    )
)

fig.update_layout(
    title_text=f"Flight path for {FLIGHT_NUMBER}",
    showlegend=False,
)

fig.show()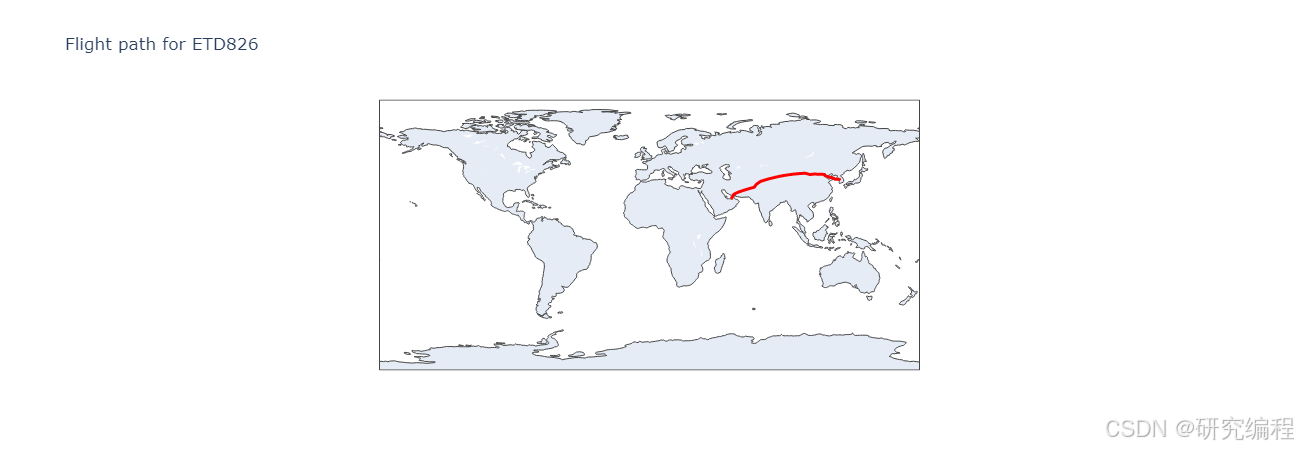
Let's make it better, add animation and some information!
python
origin = data["flights"][next(iter(data["flights"]))]["activityLog"]["flights"][0][
    "origin"
]["friendlyLocation"].upper()
destination = data["flights"][next(iter(data["flights"]))]["activityLog"]["flights"][0][
    "destination"
]["friendlyLocation"].upper()

print(origin, destination)
Here, we get origin and destination cities.
python
>>> ABU DHABI, AE SEOUL, SOUTH KOREA
python
import plotly.graph_objects as go


def modify_t(i):
    t2 = t.copy()
    if 0 < i < df.shape[0]:
        t2[i - 1] = f"<br>FL: {df.at[i, 'alt']}<br>Speed: {df.at[i, 'gs']}"
    return t2


t = ["<br>" + origin] + ["" for j in range(df.shape[0] - 2)] + ["<br>" + destination]
c = ["red"] + ["white" for j in range(df.shape[0] - 2)] + ["red"]

fig = go.Figure(
    data=[
        go.Scattergeo(
            locationmode="country names",
            line=dict(width=3, color="rgba(255, 0, 0, 0.25)"),
            textfont=dict(size=12, color=c),
            textposition="bottom center",
            mode="lines+text",
        ),
    ],
    layout=go.Layout(
        updatemenus=[
            dict(
                type="buttons",
                buttons=[
                    dict(
                        label="▶",
                        method="animate",
                        args=[
                            None,
                            {
                                "frame": {"duration": 1},
                                "transition": {
                                    "duration": 1,
                                },
                            },
                        ],
                    )
                ],
                direction="left",
                pad={"r": 0, "t": 0},
                x=0.1,
                xanchor="right",
                y=1.05,
                yanchor="top",
            )
        ],
    ),
    frames=[
        go.Frame(
            data=[
                go.Scattergeo(
                    lon=df["lon"][:i],
                    lat=df["lat"][:i],
                    text=modify_t(i),
                ),
            ]
        )
        for i in range(df.shape[0] - 1)
    ]
    + [
        go.Frame(
            data=[
                go.Scattergeo(
                    lon=df["lon"],
                    lat=df["lat"],
                    text=t,
                ),
            ]
        )
    ],
)

fig.add_annotation(
    text="* FL is Flight Level in hundreds of Feet<br>   Speed is Ground Speed in Knots",
    xref="paper",
    yref="paper",
    x=0.94,
    y=0.00,  # 0.89, 0.1
    font=dict(color="LightGrey"),
    showarrow=False,
    align="left",
)

fig.update_layout(
    width=800,
    height=400,
    margin={"r": 0, "t": 50, "l": 0, "b": 50},
)
fig.update_layout(
    paper_bgcolor="#171717",
    title_text=f"Flight path for {FLIGHT_NUMBER}",
    title_font=dict(color="LightGrey"),
    title_x=0.12,
    title_y=0.89,
    showlegend=False,
)
center = int(df.shape[0] / 2)
fig.update_geos(
    projection_type="orthographic",
    bgcolor="#171717",
    projection_rotation={
        "lat": float(df.at[center, "lat"]),
        "lon": float(df.at[center, "lon"]),
        "roll": 0,
    },
    resolution=110,  # 50或110
    showcoastlines=False,
    showland=True,
    landcolor="#242424",
    showocean=True,
    oceancolor="#171717",
)
config = {"displayModeBar": False, "responsive": False, "staticPlot": True}
fig.show(config=config)
Plotly动画图表
Plotly动画图表TYA3422-1
python
import plotly.graph_objects as go


def modify_t(i):
    t2 = t.copy()
    if 0 < i < df.shape[0]:
        t2[i - 1] = f"<br>FL: {df.at[i, 'alt']}<br>Speed: {df.at[i, 'gs']}"
    return t2


t = ["<br>" + origin] + ["" for j in range(df.shape[0] - 2)] + ["<br>" + destination]
c = ["red"] + ["white" for j in range(df.shape[0] - 2)] + ["red"]

fig = go.Figure(
    data=[
        go.Scattergeo(
            locationmode="country names",
            line=dict(width=3, color="rgba(255, 0, 0, 0.25)"),
            textfont=dict(size=12, color=c),
            textposition="bottom center",
            mode="lines+text",
        ),
    ],
    layout=go.Layout(
        updatemenus=[
            dict(
                type="buttons",
                buttons=[
                    dict(
                        label="▶",
                        method="animate",
                        args=[
                            None,
                            {
                                "frame": {"duration": 1},
                                "transition": {
                                    "duration": 1,
                                },
                            },
                        ],
                    )
                ],
                direction="left",
                pad={"r": 0, "t": 0},
                x=0.1,
                xanchor="right",
                y=0.91,
                yanchor="top",
            )
        ],
    ),
    frames=[
        go.Frame(
            data=[
                go.Scattergeo(
                    lon=df["lon"][:i],
                    lat=df["lat"][:i],
                    text=modify_t(i),
                ),
            ]
        )
        for i in range(df.shape[0] - 1)
    ]
    + [
        go.Frame(
            data=[
                go.Scattergeo(
                    lon=df["lon"],
                    lat=df["lat"],
                    text=t,
                ),
            ]
        )
    ],
)

fig.add_annotation(
    text="* FL is Flight Level in hundreds of Feet<br>   Speed is Ground Speed in Knots",
    xref="paper",
    yref="paper",
    x=0.94,
    y=0.1,
    font=dict(color="LightGrey"),
    showarrow=False,
    align="left",
)

fig.update_layout(width=800, height=400, margin={"r": 0, "t": 0, "l": 0, "b": 0})
fig.update_layout(
    title_text=f"Flight path for {FLIGHT_NUMBER}",
    title_font=dict(color="LightGrey"),
    title_x=0.12,
    title_y=0.89,
    showlegend=False,
)
fig.update_geos(
    resolution=110,  # 50或110
    showcoastlines=False,
    showland=True,
    landcolor="#242424",
    showocean=True,
    oceancolor="#171717",
)
config = {"displayModeBar": False, "responsive": False, "staticPlot": True}
fig.show(config=config)
Plotly动画图表
Plotly动画图表TYA3422-2
You can go a step further and store this data in a database easily. Please refer to my other tutorial on the matter: 在Python中从API数据自动创建数据库模式
谢谢阅读!