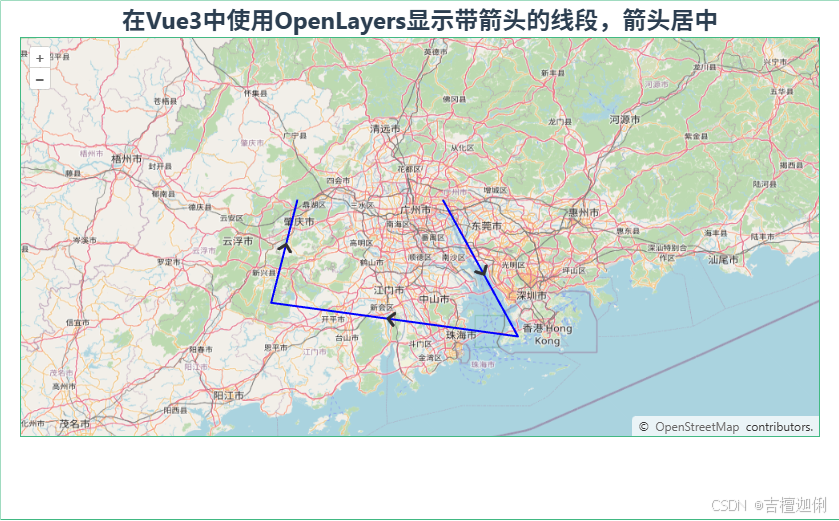
在 WebGIS 开发中,使用 OpenLayers 渲染地图和矢量图形是常见的需求。今天我们来实现一个效果:在 Vue 3 项目中,使用 OpenLayers 显示带箭头的线段,并让箭头居中。
项目环境和技术栈
- Vue 3 + Composition API
- OpenLayers
- Vite 构建工具
实现效果
我们将绘制一条由多个坐标点构成的线段,在每个线段的中点处显示一个箭头,指向线段的方向。
效果示例如下:

代码实现
1. 项目初始化
首先,使用 Vite 创建一个 Vue 3 项目:
javascript
npm create vite@latest vue-openlayers-demo --template
vue cd vue-openlayers-demo npm install
安装 OpenLayers:
javascript
npm install ol2. 编写代码
创建一个 MapWithArrow.vue 文件,编写以下内容:
javascript
<!--
 * @Author: 彭麒
 * @Date: 2025/1/14
 * @Email: 1062470959@qq.com
 * @Description: 此源码版权归吉檀迦俐所有,可供学习和借鉴或商用。
 -->
<template>
  <div class="container">
    <div class="w-full flex justify-center">
      <div class="font-bold text-[24px]">在Vue3中使用OpenLayers显示带箭头的线段,箭头居中</div></div>
    <div id="vue-openlayers" ref="mapRef" class="map-x"></div>
  </div>
</template>

<script setup>
import 'ol/ol.css';
import {ref, onMounted} from 'vue';
import {Map, View} from 'ol';
import Tile from 'ol/layer/Tile';
import OSM from 'ol/source/OSM';
import VectorLayer from 'ol/layer/Vector';
import VectorSource from 'ol/source/Vector';
import {Style, Stroke, Icon} from 'ol/style';
import Feature from 'ol/Feature';
import {Point, LineString} from 'ol/geom';
import arrow from '@/assets/OpenLayers/arrow.png';

const map = ref(null);
const mapRef = ref(null);
const source = new VectorSource({wrapX: false});
const markersData = [
  [112.44837595417002, 23.186590101623924, 1604627953],
  [112.26981796722073, 22.48475773547695, 1604714353],
  [113.96115972956521, 22.25412016222777, 1604800753],
  [113.44837595417002, 23.186590101623924, 1604887153],
];
let fea = null;

const addLine = () => {
  const lineStringFeature = new Feature(new LineString(markersData));
  lineStringFeature.setStyle(
    new Style({
      stroke: new Stroke({
        color: '#00f',
        width: 2,
      }),
    })
  );

  fea = lineStringFeature;
  source.addFeature(lineStringFeature);
};

const arrowStyle = () => {
  const geometry = fea.getGeometry();
  const styles = [];
  geometry.forEachSegment((start, end) => {
    const dx = end[0] - start[0];
    const dy = end[1] - start[1];
    const rotation = Math.atan2(dy, dx);
    const kx = (end[0] + start[0]) / 2;
    const ky = (end[1] + start[1]) / 2;

    styles.push(
      new Style({
        geometry: new Point([kx, ky]),
        image: new Icon({
          src: arrow,
          anchor: [0.75, 0.5],
          rotateWithView: true,
          rotation: -rotation,
        }),
      })
    );
  });
  return styles;
};

const addPoint = () => {
  const features = markersData.map((data) => {
    const feature = new Feature({
      geometry: new Point([data[0], data[1]]),
    });
    feature.setStyle(arrowStyle());
    return feature;
  });
  source.addFeatures(features);
};

const initMap = () => {
  const raster = new Tile({
    source: new OSM(),
  });

  const vector = new VectorLayer({
    source: source,
  });

  map.value = new Map({
    target: mapRef.value,
    layers: [raster, vector],
    view: new View({
      projection: 'EPSG:4326',
      center: [113.243045, 22.16871],
      zoom: 7,
    }),
  });

  addLine();
  addPoint();
};

onMounted(() => {
  initMap();
});
</script>

<style scoped>
.container {
  width: 840px;
  height: 520px;
  margin: 0 auto;
  border: 1px solid #42B983;
}

#vue-openlayers {
  width: 800px;
  height: 400px;
  margin: 0 auto;
  border: 1px solid #42B983;
}
</style>
代码说明
-
地图初始化
使用
OSM作为地图底图,通过VectorLayer添加线段和箭头。 -
线段绘制
通过
LineString创建矢量线段,并设置样式。 -
箭头计算
遍历每段线段的起点和终点,计算中点和角度,动态生成箭头样式。
-
动态样式
箭头样式通过
Icon图标实现,并通过rotation参数设置旋转角度。
总结
本文展示了如何在 Vue 3 中使用 OpenLayers 显示带箭头的线段,并详细介绍了实现细节。这种实现方法可以应用于各种地图展示需求,如路径规划、物流轨迹等场景。
如有问题,欢迎在评论区留言讨论!🎉
希望这篇文章对你有所帮助!如果喜欢,记得点赞和收藏!