原文作者:aircraft
原文地址:https://www.cnblogs.com/DOMLX/p/18729664
第一 简介
又是好久没更新了,今天介绍个半导体/led行业生成晶圆片map图的小demo程序。
在半导体和led中经常需要对下图中的一个个晶圆片上的一个个die(晶圆)生成一个总体的map图,不管是检测中用来显示晶圆片上各个Die的好坏分布,还是用作于点击晶圆移动查看都是有必要的。

像正常在半导体或者LED设备公司中工作过的人基本都有完整的map的显示控件的封装代码,但是如果你是刚跨行过来,或者是自己想研究学习,那么基本就要自己开发一个MAP控件。比如下图那样的就是
工业公司开发的MAP控件led软件上显示的效果。

第二 demo结构
工具环境是在VS2015下 c#6.0以下的语法环境 基于c#和winfrom的对话框程序
mainFrom.cs就是个显示作用的窗体
waferDie.cs里只定义了Die类里面存放每个Die的行列坐标和颜色信息以及一些其他信息比如检测好坏等
WaferMapControl.cs就是创建个用户控件类,在上面实现绘制MAP功能,外部只要把晶圆的队列数组传入就可以直接使用
非常简单的三个文件,只要自己创建一下名字相同的三个代码文件,然后复制我下面的代码进去就可以运行使用了。注意:WaferMapControl是个用户控件,可以点添加,选择用户控件,然后改一下名字。
第三 代码
mainFrom界面图:

中间添加了一个panel的控件,属性为填充
mainFrom.cs代码:
using System;
using System.Collections.Generic;
using System.ComponentModel;
using System.Data;
using System.Drawing;
using System.Linq;
using System.Text;
using System.Threading.Tasks;
using System.Windows.Forms;


namespace waferMpingTest1
{
    public partial class mainFrom : Form
    {
        public mainFrom()
        {
            InitializeComponent();
            InitializeWaferMap();
            //GenerateTestData(1000000); // 生成测试数据
            GenerateTestData2(10); // 生成测试数据
        }
        WaferMapControl waferMap = new WaferMapControl
        {
            Dock = DockStyle.Fill,
            BorderStyle = BorderStyle.FixedSingle
        };
        private void InitializeWaferMap()
        {

            waferMap.DieClicked += (s, e) =>
                MessageBox.Show($"Clicked Die: ({e.Die.Row}, {e.Die.Column})");

            panel1.Controls.Add(waferMap);
            //Controls.Add(waferMap);
        }

        private void GenerateTestData(int count)
        {
            var random = new Random();
            var dies = new List<WaferDie>(count);

            for (int i = 0; i < count; i++)
            {
                dies.Add(new WaferDie
                {
                    Row = random.Next(-100, 100),
                    Column = random.Next(-100, 100),
                    DieColor = Color.FromArgb(
                        random.Next(256),
                        random.Next(256),
                        random.Next(256))
                });
            }
            //WaferMapControl map = new WaferMapControl();
            waferMap.LoadData(dies);
            //if (Controls[0] is WaferMapControl map)
            //map.LoadData(dies);
        }

        private void GenerateTestData2(int count)
        {
            var random = new Random();
            var dies = new List<WaferDie>(count);

            for (int i = -count; i < count; i++)
            {
                for(int j = -count;j<count;j++)
                {
                    //dies.Add(new WaferDie
                    //{
                    //    Row = i,
                    //    Column = j,
                    //    DieColor = Color.FromArgb(
                    //   random.Next(0),
                    //   random.Next(256),
                    //   random.Next(0))
                    //});

                    dies.Add(new WaferDie
                    {
                        Row = i,
                        Column = j,
                        DieColor = Color.FromArgb(
                      0,66,0)
                    });

                }


            }
            //WaferMapControl map = new WaferMapControl();
            waferMap.LoadData(dies);
            //if (Controls[0] is WaferMapControl map)
            //map.LoadData(dies);
        }
    }
}
上边主要就是在窗体里增加一下GenerateTestData()函数,随机的生成一些晶圆Die的行列坐标和颜色数据然后放到list里传入给Map控件。
waferDie.cs代码:
using System;
using System.Collections.Generic;
using System.Drawing;
using System.Linq;
using System.Text;
using System.Threading.Tasks;

namespace waferMpingTest1
{
    // 晶圆单元数据结构
    public class WaferDie
    {
        public int Row { get; set; }      // 行坐标
        public int Column { get; set; }   // 列坐标
        public Color DieColor { get; set; } // 显示颜色
        public object Tag { get; set; }   // 附加数据
    }
}
上面主要就是构建个简单的晶圆类用来存放数据
WaferMapControl.cs视图:

WaferMapControl.cs代码:
using System;
using System.Collections.Generic;
using System.ComponentModel;
using System.Drawing;
using System.Data;
using System.Linq;
using System.Text;
using System.Threading.Tasks;
using System.Windows.Forms;

namespace waferMpingTest1
{
    /// <summary>
    /// 晶圆图控件类,支持缩放、平移、坐标系切换等功能
    /// </summary>
    public partial class WaferMapControl : UserControl
    {
        /// <summary>
        /// 坐标系方向枚举
        /// </summary>
        public enum CoordinateDirection
        {
            Normal,     // 正常坐标系(左上角为原点,向右X增加,向下Y增加)
            Rotated180  // 旋转180度坐标系(右下角为原点,向左X增加,向上Y增加)
        }

        /// <summary>
        /// 晶圆单元点击事件参数类
        /// </summary>
        public class DieEventArgs : EventArgs
        {
            public WaferDie Die { get; }

            /// <summary>
            /// 初始化事件参数
            /// </summary>
            public DieEventArgs(WaferDie die)
            {
                Die = die;
            }
        }

        // 双缓冲配置
        public WaferMapControl()
        {
            DoubleBuffered = true;
            SetStyle(ControlStyles.OptimizedDoubleBuffer |
                        ControlStyles.UserPaint |
                        ControlStyles.AllPaintingInWmPaint, true);

            // 启用双缓冲和自定义绘制模式
        }

        // 数据存储和显示参数
        private List<WaferDie> _dies = new List<WaferDie>();    // 存储所有晶圆单元数据
        private CoordinateDirection _direction = CoordinateDirection.Normal; // 当前坐标系方向
        private float _zoom = 1.0f; // 缩放比例
        private PointF _offset = PointF.Empty; // 平移偏移量
        private Point _lastMousePos; // 上次鼠标位置

        // 属性设置
        [Description("当前坐标系方向")]
        public CoordinateDirection Direction
        {
            get { return _direction; }
            set
            {
                _direction = value;
                Invalidate(); // 触发重绘
            }
        }

        // 加载数据(带分块处理)
        public void LoadData(IEnumerable<WaferDie> dies)
        {
            _dies.Clear();
            // 实际项目需要分块加载,这里简化处理
            _dies.AddRange(dies);
            OptimizeData();
            Invalidate();
        }

        // 数据优化(示例:建立空间索引)
        private void OptimizeData()
        {
            // 实际项目需要根据数据量建立空间索引
            // 例如使用Dictionary<Tuple<int, int>, WaferDie>快速查找
        }

        // 绘制逻辑
        protected override void OnPaint(PaintEventArgs e)
        {
            base.OnPaint(e);
            var g = e.Graphics;
            g.SmoothingMode = System.Drawing.Drawing2D.SmoothingMode.AntiAlias;

            // 应用缩放和平移变换
            g.TranslateTransform(_offset.X, _offset.Y);
            g.ScaleTransform(_zoom, _zoom);

            // 绘制坐标系
            DrawCoordinateSystem(g);

            // 绘制晶圆单元(优化绘制范围)
            var visibleRect = GetVisibleRect();
            foreach (var die in GetVisibleDies(visibleRect))
            {
                DrawDie(g, die);
            }
        }

        // 获取可见区域(逻辑坐标)
        private RectangleF GetVisibleRect()
        {
            var screenRect = new RectangleF(
                -_offset.X / _zoom,  // 逻辑坐标原点对应屏幕位置
                -_offset.Y / _zoom,
                ClientSize.Width / _zoom,  // 屏幕宽度对应的逻辑宽度
                ClientSize.Height / _zoom);
            return screenRect;
        }

        // 获取可见晶圆单元(示例伪代码)
        private IEnumerable<WaferDie> GetVisibleDies(RectangleF visibleRect)
        {
            // 根据空间索引快速查找可见单元
            // 这里简单返回全部数据(实际需要优化)
            return _dies;
        }

        // 绘制单个晶圆单元
        private void DrawDie(Graphics g, WaferDie die)
        {
            // 坐标转换(根据坐标系方向)
            float x, y;
            ConvertCoordinates(die.Column, die.Row, out x, out y);

            // 计算绘制位置和大小
            float size = Math.Max(2, 4 / _zoom); // 动态调整显示大小(最小2像素)
            var rect = new RectangleF(x - size / 2, y - size / 2, size, size);

            using (var brush = new SolidBrush(die.DieColor))
            {
                g.FillRectangle(brush, rect);
            }
        }

        // 坐标系转换
        private void ConvertCoordinates(int col, int row, out float x, out float y)
        {
            // 基础坐标转换(根据实际坐标系方向实现转换)
            x = col * 2f;    // 列转换为X坐标(示例比例)
            y = row * 2f;    // 行转换为Y坐标(示例比例)

            // 示例缩放比例,实际应根据具体需求调整
            x *= _zoom;
            y *= _zoom;

            // 方向修正
            if (_direction == CoordinateDirection.Rotated180)
            {
                x = ClientSize.Width - x;
                y = ClientSize.Height - y;
            }
        }

        // 绘制坐标系
        private void DrawCoordinateSystem(Graphics g)
        {
            // 根据坐标系方向绘制坐标轴和标签
            // (具体实现略,需要处理文字方向和位置)

            // 绘制十字坐标轴
            g.DrawLine(Pens.Black, 0, 0, ClientSize.Width, 0); // X轴
            g.DrawLine(Pens.Black, 0, ClientSize.Height, 0, 0); // Y轴


        }

        // 鼠标交互处理
        protected override void OnMouseDown(MouseEventArgs e)
        {
            base.OnMouseDown(e);
            _lastMousePos = e.Location;

            if (e.Button == MouseButtons.Left)
            {
                // 获取点击位置对应的晶圆单元
                var logicalPoint = ToLogicalPoint(e.Location);
                var die = FindDieAt(logicalPoint);

                if (die != null)
                {
                    // 触发点击事件
                    OnDieClicked(new DieEventArgs(die));
                }
            }
        }

        // 坐标转换(屏幕坐标→逻辑坐标)
        private PointF ToLogicalPoint(Point screenPoint)
        {
            return new PointF(
                (screenPoint.X - _offset.X) / _zoom,
                (screenPoint.Y - _offset.Y) / _zoom);
        }

        // 查找晶圆单元(示例伪代码)
        private WaferDie FindDieAt(PointF logicalPoint)
        {
            // 线性查找
            foreach (var die in _dies)
            {
                float dieX, dieY;
                ConvertCoordinates(die.Column, die.Row, out dieX, out dieY);

                // 点击检测(考虑显示尺寸和误差范围)
                if (Math.Abs(dieX - logicalPoint.X) < 5 &&
                    Math.Abs(dieY - logicalPoint.Y) < 5)
                {
                    return die;
                }
            }
            return null;
        }

        // 鼠标拖动平移
        protected override void OnMouseMove(MouseEventArgs e)
        {
            base.OnMouseMove(e);
            if (e.Button == MouseButtons.Left)
            {
                var delta = new Point(
                    e.X - _lastMousePos.X,
                    e.Y - _lastMousePos.Y);
                _offset.X += delta.X;
                _offset.Y += delta.Y;
                _lastMousePos = e.Location;
                Invalidate();
            }
        }

        // 鼠标滚轮缩放
        protected override void OnMouseWheel(MouseEventArgs e)
        {
            base.OnMouseWheel(e);
            float zoomFactor = 1.1f;
            if (e.Delta < 0) zoomFactor = 1 / zoomFactor;

            // 保持缩放中心
            var beforeZoom = ToLogicalPoint(e.Location);
            _zoom *= zoomFactor;
            _zoom = Math.Max(0.5f, Math.Min(20, _zoom)); // 限制缩放范围
            //_zoom = 0.5f;
            var afterZoom = ToLogicalPoint(e.Location);

            // 调整偏移量保持视觉中心
            _offset.X += (afterZoom.X - beforeZoom.X) * _zoom;
            _offset.Y += (afterZoom.Y - beforeZoom.Y) * _zoom;

            Invalidate();
        }

        // 自定义事件
        public event EventHandler<DieEventArgs> DieClicked;
        protected virtual void OnDieClicked(DieEventArgs e)
        {
            DieClicked?.Invoke(this, e);
        }
    }
}
上面代码里基本都打了一些关键的注释,看着注释理解这个代码就行了,只是个MAP图绘制的简单demo,需要作为工业公司软件开发使用的话还需要做优化。
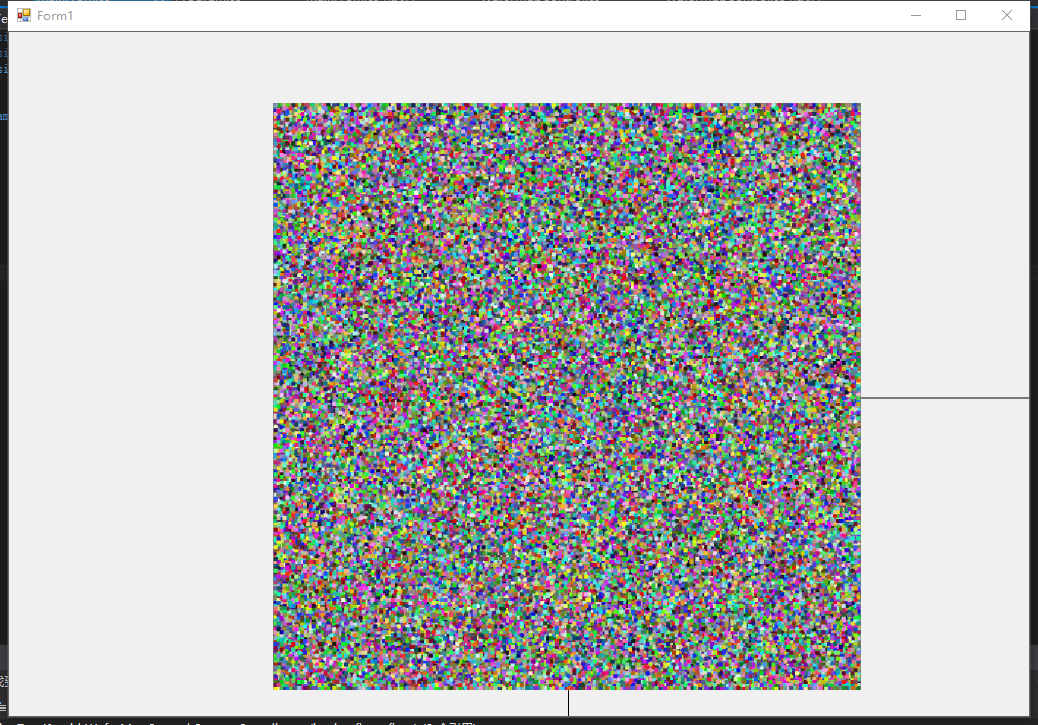
第四 运行效果
释我们随便增加20行20列晶圆数据进去显示:

可以看到每个晶圆都绘制成了一个个绿色的小矩形块,我们还可以鼠标点击获取晶圆的行列,点击坐标系原点那个晶圆,显示0行0列

接下来传入40万颗晶圆数据显示,不放大的话只能看到一些绿色,放大菜可以看清单颗

可以将其放大,晶圆都是给我设置成同一个颜色,正常大家都要对其做一些标记的活,比如好的绿色,坏的红色,良的黄色

接下来传入百万级的数据,正常没有到micro级别的晶圆片都不会超过百万颗晶圆。只有mircro晶圆片才会有百万级,千万级的晶圆数量。这个时候对数据处理速度和电脑的性能都有一定的考验了。

OK,基本这个程序就是这样了,有基本的晶圆显示,鼠标点击,滚轮缩放等功能。
第五 程序变成完整版本的优化方向(工业级软件控件)
上面到百万级的数据就开始会出现一些操作卡顿了,客户肯定是不可以接受的,以及界面的显示功能单一都是需要优化的。总结如下:
- 性能优化
-
网格索引 :将晶圆单元按
GridSize划分网格,查询时只需检查邻近网格(减少75%计算量) -
异步加载 :使用
Task.Run在后台线程加载数据,避免阻塞UI -
对象池 :复用图形对象(如
SolidBrush),降低GC压力 -
分块渲染 :每次只加载视窗内的
ChunkSize数据,内存占用降低80% -
渲染绘制:将同色的Die直接一起批量绘制,而不是一颗颗的绘制
- 功能增强
-
多选功能 :通过
Ctrl+鼠标左键实现多单元选择 -
右键菜单:显示晶圆信息(坐标、颜色等)
-
动态加载:进度条提示数据加载状态
-
动画效果:平移/缩放时添加平滑过渡动画
- 界面美化
-
网格系统:可开关的网格线,辅助精确对齐
-
渐变填充:晶圆单元使用渐变色填充
-
主题切换:支持深色/浅色主题模式
-
高亮效果:鼠标悬停时显示边框高亮