一:背景
1. 讲故事
前面跟大家分享过一篇 C# 调用 C代码引发非托管内存泄露 的文章,这是一个故意引发的正向泄露,这一篇我们从逆向的角度去洞察引发泄露的祸根代码,这东西如果在 windows 上还是很好处理的,很多人知道开启一个 ust 即可,让操作系统帮忙介入,在linux上就相对复杂一点了,毕竟Linux系统是一个万物生的场地,没有一个人统管全局,在调试领域这块还是蛮大的一个弊端。
二:案例分析
1. 一个小案例
这里我还是用之前的例子,对应的 C 代码 和 C#代码 如下:
- C 代码
C
#include <stdlib.h>
#include <stdio.h>
#include <stdint.h>
#include <string.h>

#define BLOCK_SIZE (10 * 1024)              // 每个块 10K
#define TOTAL_SIZE (1 * 1024 * 1024 * 1024) // 总计 1GB
#define BLOCKS (TOTAL_SIZE / BLOCK_SIZE)    // 计算需要的块数

void heapmalloc()
{
    uint8_t *blocks[BLOCKS]; // 存储每个块的指针

    // 分配 1GB 内存,分成多个小块
    for (size_t i = 0; i < BLOCKS; i++)
    {
        blocks[i] = (uint8_t *)malloc(BLOCK_SIZE);
        if (blocks[i] == NULL)
        {
            printf("内存分配失败!\n");
            return;
        }

        // 确保每个块都被实际占用
        memset(blocks[i], 20, BLOCK_SIZE);
    }

    printf("已经分配 1GB 内存在堆上!\n");
}- C#代码
C#
using System.Runtime.InteropServices;

namespace CSharpApplication;

class Program
{
    [DllImport("libmyleak.so", CallingConvention = CallingConvention.Cdecl)]
    public static extern void heapmalloc();

    static void Main(string[] args)
    {
        heapmalloc();
        Console.ReadLine();
    }
}
2. heaptrack 跟踪
heaptrack 是一款跟踪 C/C++ heap分配的工具,它会拦截所有的 malloc、calloc、realloc 和 free 函数调用,并记录分配的调用栈信息,总的来说这工具和 C# 半毛钱关系都没有,主要是图它的如下三点:
- 能够记录到分配的调用栈信息,虽然只有非托管部分。
- 对程序的影响相对小。
- 有可视化的工具观察跟踪文件。
依次安装 heaptrack 和 heaptrack-gui ,参考如下:
bash
root@ubuntu2404:/data# sudo apt install heaptrack
Reading package lists... Done
Building dependency tree... Done
Reading state information... Done
heaptrack is already the newest version (1.5.0+dfsg1-2ubuntu3).
0 upgraded, 0 newly installed, 0 to remove and 217 not upgraded.
root@ubuntu2404:/data/CSharpApplication/bin/Debug/net8.0# sudo apt install heaptrack-gui
Reading package lists... Done
Building dependency tree... Done
Reading state information... Done
heaptrack-gui is already the newest version (1.5.0+dfsg1-2ubuntu3).
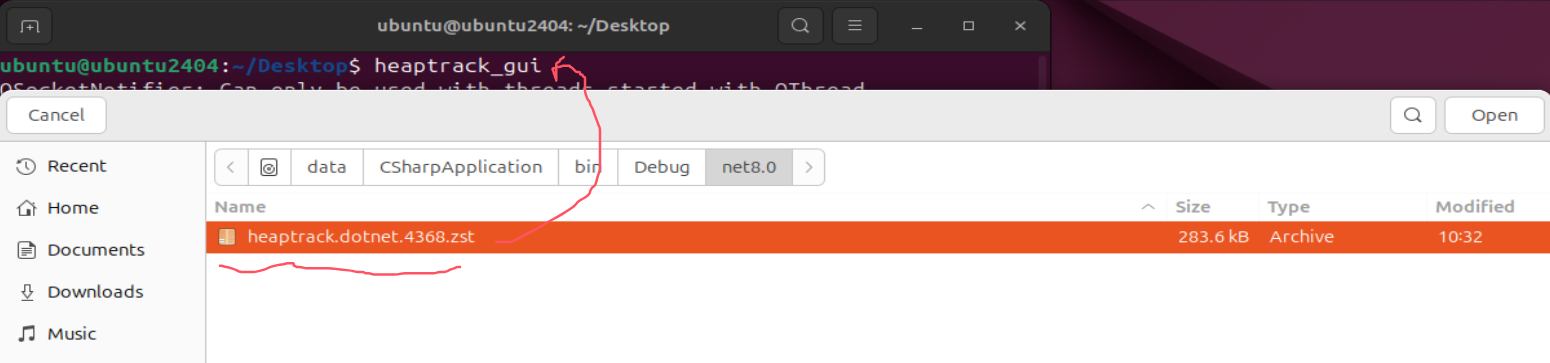
0 upgraded, 0 newly installed, 0 to remove and 217 not upgraded.安装好以后可以用 heaptrack dotnet CSharpApplication.dll 对 dotnet 程序进行跟踪,当泄露到一定程序之后,可以用 dotnet-dump 生成一个转储文件,然后 Ctrl+C 进行中断,
bash
root@ubuntu2404:/data/CSharpApplication/bin/Debug/net8.0# heaptrack dotnet CSharpApplication.dll
heaptrack output will be written to "/data/CSharpApplication/bin/Debug/net8.0/heaptrack.dotnet.4368.zst"
starting application, this might take some time...
NOTE: heaptrack detected DEBUGINFOD_URLS but will disable it to prevent
unintended network delays during recording
If you really want to use DEBUGINFOD, export HEAPTRACK_ENABLE_DEBUGINFOD=1
已经分配 1GB 内存在堆上!
[createdump] Gathering state for process 4383 dotnet
[createdump] Writing full dump to file /data/CSharpApplication/bin/Debug/net8.0/core_20250307_102814
[createdump] Written 1252216832 bytes (305717 pages) to core file
[createdump] Target process is alive
[createdump] Dump successfully written in 23681ms

root@ubuntu2404:/data/CSharpApplication/bin/Debug/net8.0# heaptrack stats:
	allocations:          	122151
	leaked allocations:   	108551
	temporary allocations:	4118

root@ubuntu2404:/data/CSharpApplication/bin/Debug/net8.0# ls -lh
total 1.2G
-rwxr-xr-x 1 root root  74K Mar  5 22:38 CSharpApplication
-rw-r--r-- 1 root root  421 Mar  5 21:52 CSharpApplication.deps.json
-rw-r--r-- 1 root root 4.5K Mar  5 22:38 CSharpApplication.dll
-rw-r--r-- 1 root root  11K Mar  5 22:38 CSharpApplication.pdb
-rw-r--r-- 1 root root  257 Mar  5 21:52 CSharpApplication.runtimeconfig.json
-rw------- 1 root root 1.2G Mar  7 10:28 core_20250307_102814
-rw-r--r-- 1 root root 277K Mar  7 10:32 heaptrack.dotnet.4368.zst
-rwxr-xr-x 1 root root  16K Mar  5 21:52 libmyleak.so
从卦中看已产生了一个 heaptrack.dotnet.4368.zst 文件,这是一种专有的压缩格式,可以借助 heaptrack_print 转成 txt 文件,方便从生产上拿下来分析。
bash
root@ubuntu2404:/data/CSharpApplication/bin/Debug/net8.0# heaptrack_print heaptrack.dotnet.4368.zst > heaptrack.txt真实的场景下肉眼观察 heaptrack.txt 是不大现实的,所以还得借助可视化工具,观察 Bottom-Up 选择项,信息如下:
- 左边面板
可以观察到 Leaked 最多的是 libmyleak.so 中的 heapmalloc 函数。
- 右边面板
可以观察到执行 heapmalloc 方法的上层函数,给大家截图二张。
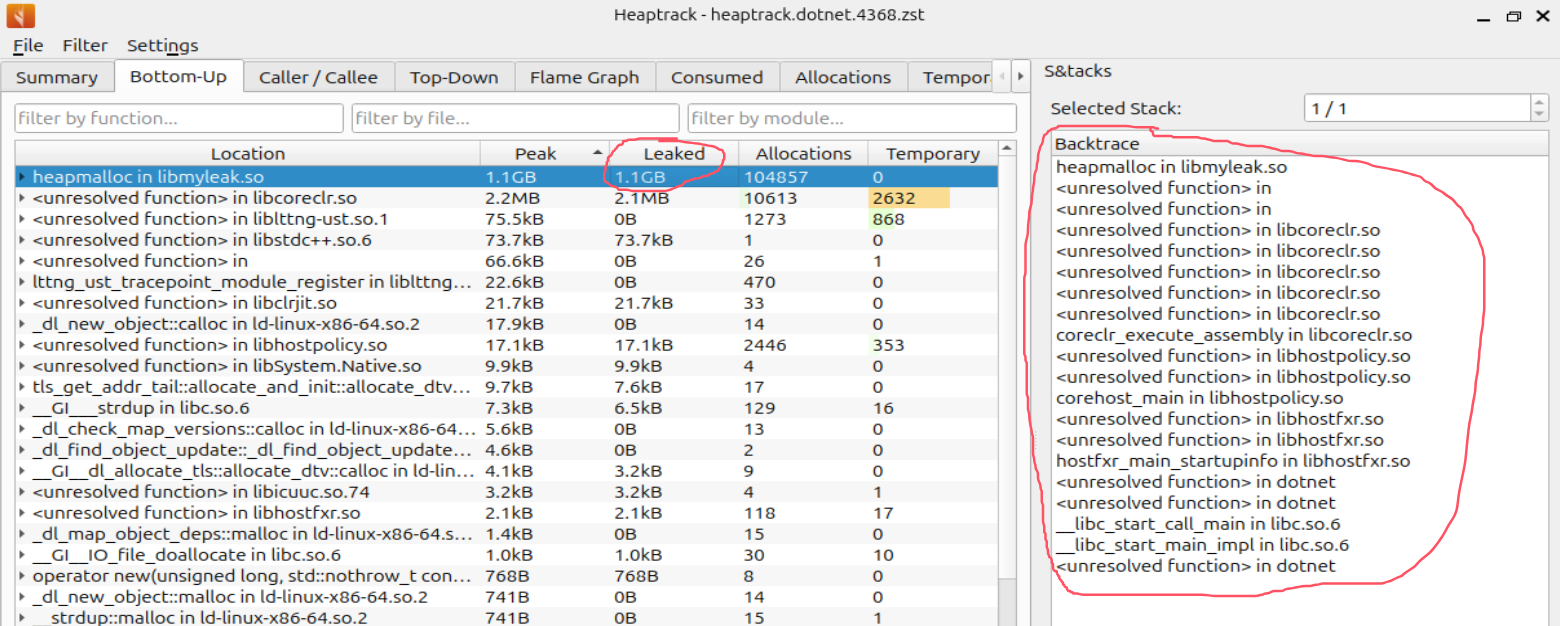
稍微仔细看的话,会发现Backtrace上有很多的 unresolved 符号,这个没办法,毕竟人家是 C/C++ 的跟踪器,和你C#没关系,那这些未解析的符号到底是什么函数呢?
3. 未解析符号的地址在哪里
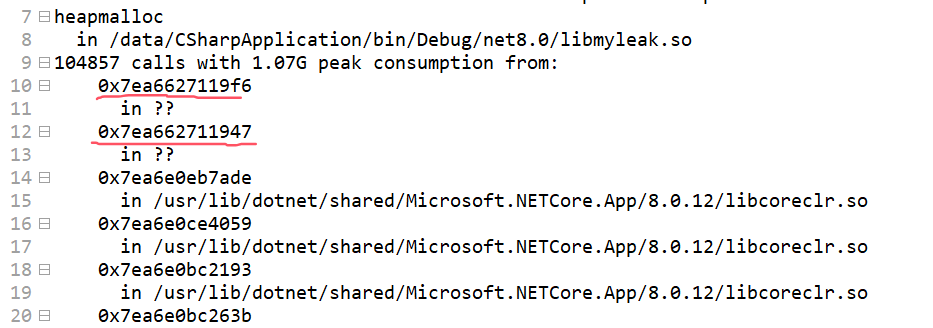
既然是 C# 程序,大概率就是 C#方法了,那如何把方法名给找出来呢?熟悉.NET高级调试的朋友此时应该轻车熟路了,思路如下:
- 寻找 指令地址。
一般来说解析不出来都会生成对应的 指令地址 的,这个可以到 heaptrack.txt 中寻找蛛丝马迹,截图如下:
- 抓 core 文件
要想抓 .NET 的 core 文件,dotnet-dump 即可,这个就不介绍了哈,参考如下:
bash
root@ubuntu2404:/data/CSharpApplication/bin/Debug/net8.0# ps -ef | grep CSharp
root        4368    2914  0 10:25 pts/0    00:00:00 /bin/sh /usr/bin/heaptrack dotnet CSharpApplication.dll
root        4383    4368  2 10:25 pts/0    00:00:03 dotnet CSharpApplication.dll
root        4421    4336  0 10:28 pts/3    00:00:00 grep --color=auto CSharp
root@ubuntu2404:/data/CSharpApplication/bin/Debug/net8.0# dotnet-dump collect -p 4383
Writing full to /data/CSharpApplication/bin/Debug/net8.0/core_20250307_102814
Complete
root@ubuntu2404:/data/CSharpApplication/bin/Debug/net8.0# ls -lh
total 1.2G
-rwxr-xr-x 1 root root  74K Mar  5 22:38 CSharpApplication
-rw-r--r-- 1 root root  421 Mar  5 21:52 CSharpApplication.deps.json
-rw-r--r-- 1 root root 4.5K Mar  5 22:38 CSharpApplication.dll
-rw-r--r-- 1 root root  11K Mar  5 22:38 CSharpApplication.pdb
-rw-r--r-- 1 root root  257 Mar  5 21:52 CSharpApplication.runtimeconfig.json
-rw------- 1 root root 1.2G Mar  7 10:28 core_20250307_102814
-rw-r--r-- 1 root root    0 Mar  7 10:25 heaptrack.dotnet.4368.zst
-rwxr-xr-x 1 root root  16K Mar  5 21:52 libmyleak.so
core_20250307_102814 生成好之后,就可以借助 sos 的 ip2md 寻找这个指令地址对应的C#方法名了。
C#
root@ubuntu2404:/data/CSharpApplication/bin/Debug/net8.0# dotnet-dump analyze core_20250307_102814
Loading core dump: core_20250307_102814 ...
Ready to process analysis commands. Type 'help' to list available commands or 'help [command]' to get detailed help on a command.
Type 'quit' or 'exit' to exit the session.
> ip2md 0x7ea6627119f6
MethodDesc:   00007ea6627cd3d8
Method Name:          ILStubClass.IL_STUB_PInvoke()
Class:                00007ea6627cd300
MethodTable:          00007ea6627cd368
mdToken:              0000000006000000
Module:               00007ea66279cec8
IsJitted:             yes
Current CodeAddr:     00007ea662711970
Version History:
  ILCodeVersion:      0000000000000000
  ReJIT ID:           0
  IL Addr:            0000000000000000
     CodeAddr:           00007ea662711970  (MinOptJitted)
     NativeCodeVersion:  0000000000000000
> ip2md 0x7ea662711947
MethodDesc:   00007ea66279f328
Method Name:          CSharpApplication.Program.Main(System.String[])
Class:                00007ea6627bb640
MethodTable:          00007ea66279f358
mdToken:              0000000006000002
Module:               00007ea66279cec8
IsJitted:             yes
Current CodeAddr:     00007ea662711920
Version History:
  ILCodeVersion:      0000000000000000
  ReJIT ID:           0
  IL Addr:            00007ea6de8f1250
     CodeAddr:           00007ea662711920  (MinOptJitted)
     NativeCodeVersion:  0000000000000000
Source file: /data/CSharpApplication/Program.cs @ 12到这里恍然大悟,然来调用路径为:CSharpApplication.Program.Main -> PInvoke -> heapmalloc ,至此真相大白。
三:总结
Linux 上的调试总觉得少了一位总管太监,能分析 非托管内存的工具 不鸟dotnet, 同样的,能分析 dotnet托管内存的工具 也不鸟非托管内存,大家各自为政。。。 让习惯使用通杀一切的windbg使用者太不可思议了。