grafana+node_exporter应用

prometheus:主服务器,负责定时拉取和存储指标数据,提供查询、告警功能

node exporter:代理程序agent,部署在被监控机器上,暴露系统级指标

|---------------|------|
| 应用 | 端口号 |
| prometheus | 9090 |
| grafana | 3000 |
| node_exporter | 9100 |
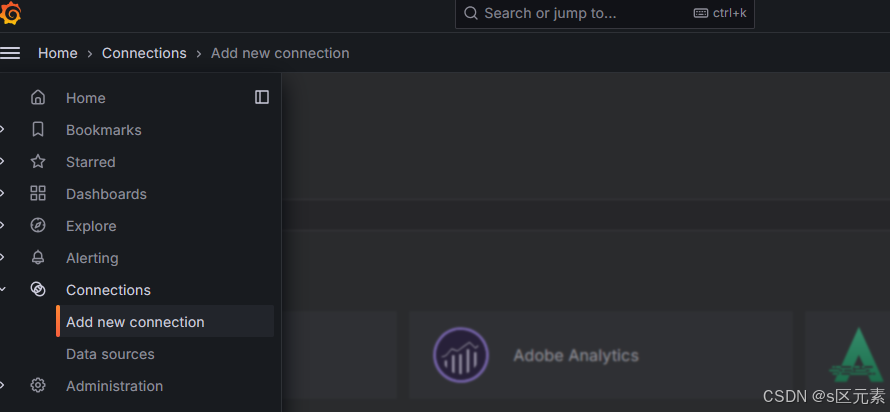
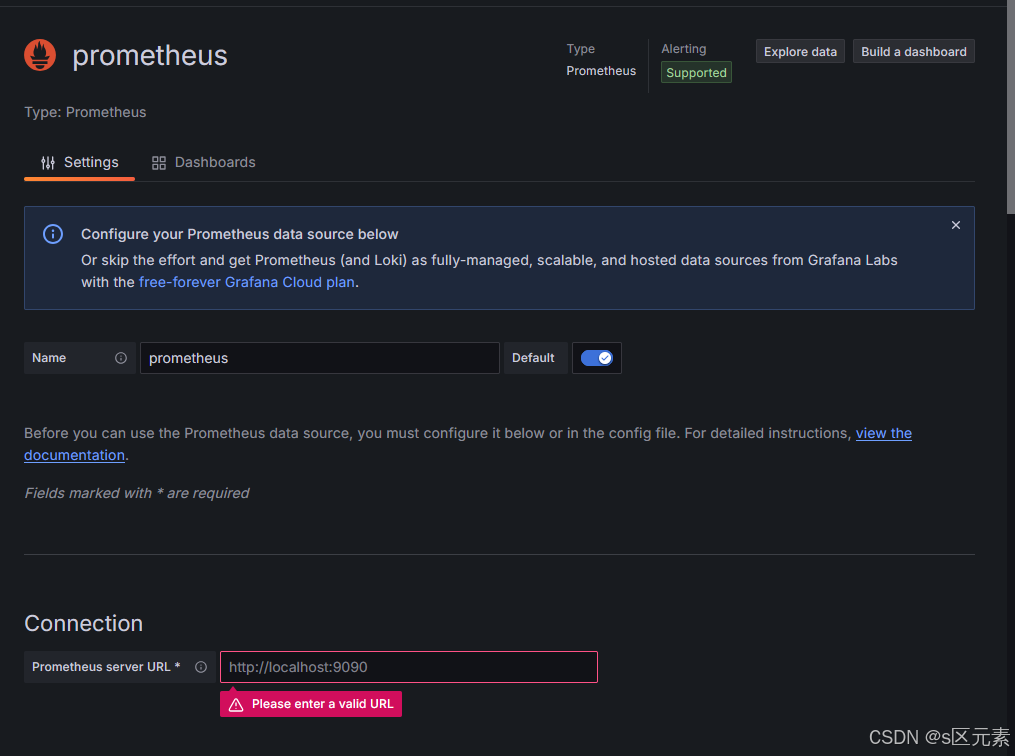
1.grafana中添加数据源

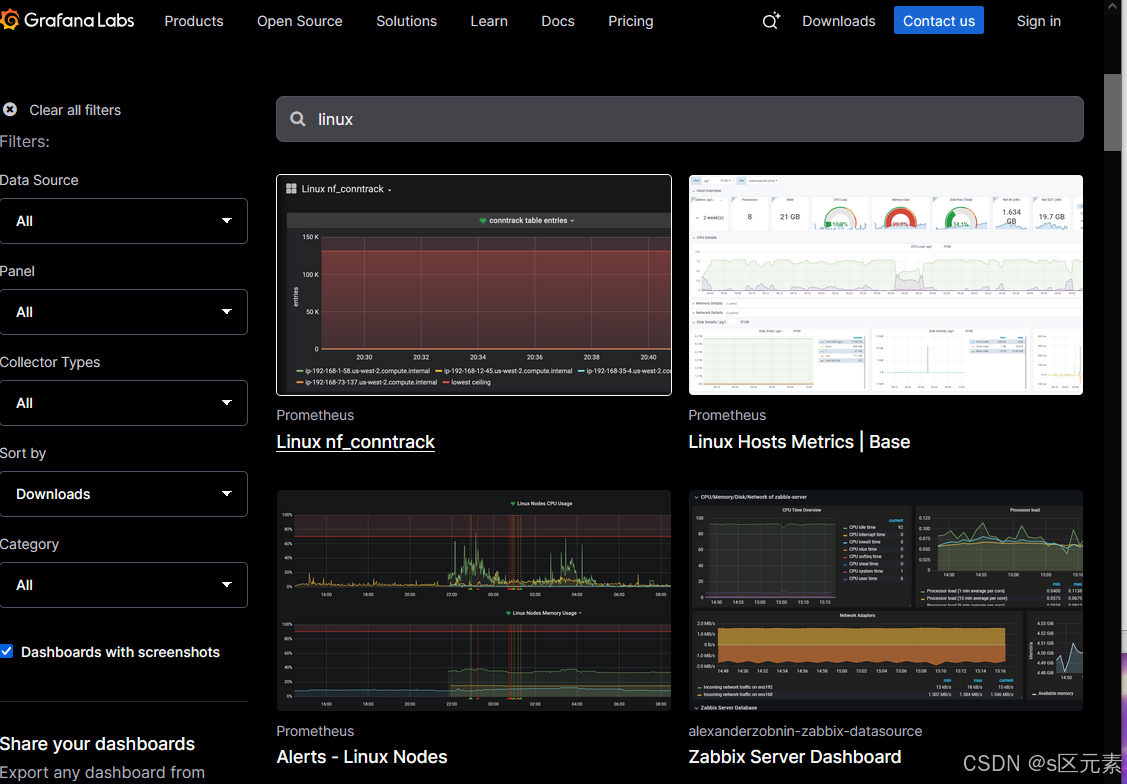
2.grafana中添加dashboard

3.添加prometheus指标数据

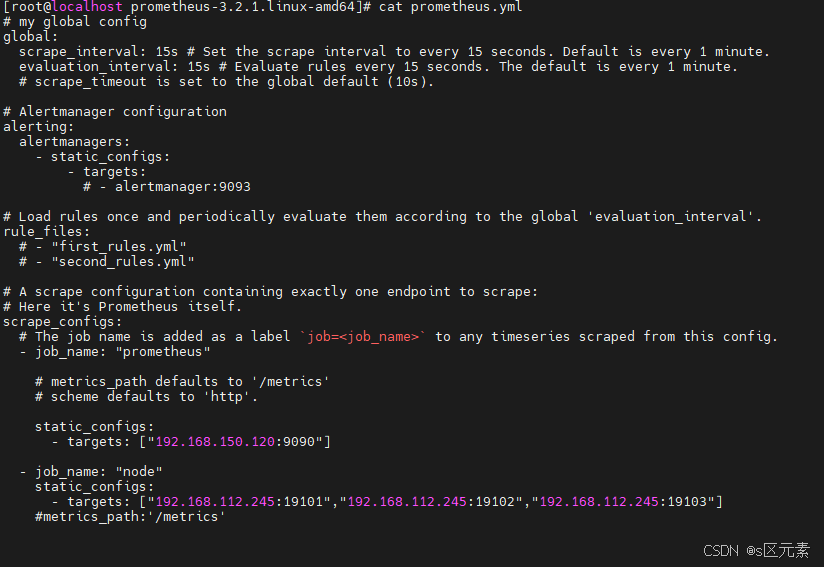
修改prometheus.yml文件,添加node_exporter所在主机

相关推荐
JAVA拾贝1 天前
Prometheus+Grafana运维监控并实现钉钉告警
运维·钉钉·grafana·prometheus·运维监控
微风◝1 天前
12. grafana-Dashboard的Variable(过滤)使用
grafana
不太聪明的样子15 天前
c++ 项目使用 prometheus + grafana 进行实时监控
c++·grafana·prometheus
Detachym20 天前
CentOS下的运维监控Grafana部署
运维·centos·grafana
南夏一木子21 天前
性能测试——搭建Prometheus+Grafana平台
grafana·prometheus
奈斯ing21 天前
【prometheus+Grafana篇】基于Prometheus+Grafana实现postgreSQL数据库的监控与可视化
运维·数据库·信息可视化·grafana·prometheus
xixingzhe222 天前
docker compose安装Prometheus、Grafana
docker·grafana·prometheus
碧水澜庭24 天前
Prometheus+ Grafana 监控系统入门
grafana·prometheus
遇见火星24 天前
一键部署Prometheus+Grafana+alertmanager对网站状态进行监控
grafana·prometheus
上海运维Q先生24 天前
Cilium动手实验室: 精通之旅---19.Golden Signals with Hubble and Grafana
云原生·k8s·grafana·cilium