绘制图形
python
import numpy as np
x = np.linspace(0, 10, 100)
y = np.sin(x)
import matplotlib as mpl
import matplotlib.pyplot as plt
plt.plot(x, y)
plt.show()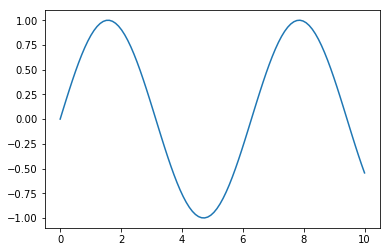
绘制多条曲线
python
siny = y.copy()
cosy = np.cos(x)
plt.plot(x, siny)
plt.plot(x, cosy)
plt.show()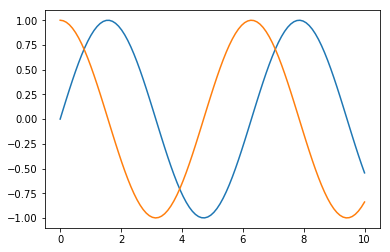
设置线条颜色
python
plt.plot(x, siny)
plt.plot(x, cosy, color="red")
plt.show()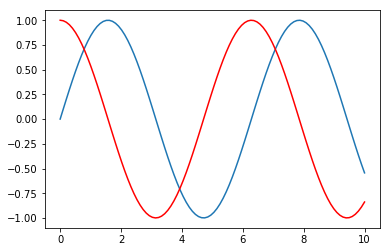
设置线条样式
python
plt.plot(x, siny)
plt.plot(x, cosy, color="red", linestyle="--")
plt.show()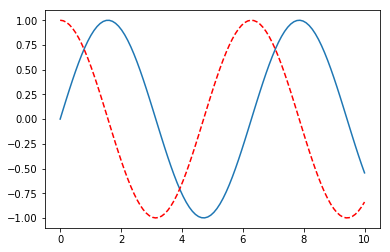
设置坐标系
python
plt.plot(x, siny)
plt.plot(x, cosy, color="red", linestyle="--")
plt.xlim(-5, 15)
plt.ylim(0, 1)
plt.show()
python
plt.plot(x, siny)
plt.plot(x, cosy, color="red", linestyle="--")
plt.axis([-1, 11, -2, 2])
plt.show()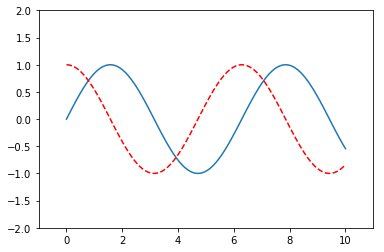
python
plt.plot(x, siny)
plt.plot(x, cosy, color="red", linestyle="--")
plt.xlabel("x axis")
plt.ylabel("y value")
plt.show()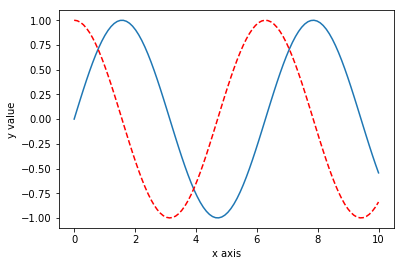
设置图示
python
plt.plot(x, siny, label="sin(x)")
plt.plot(x, cosy, color="red", linestyle="--", label="cos(x)")
plt.xlabel("x axis")
plt.ylabel("y value")
plt.legend()
plt.show()
设置标题
python
plt.plot(x, siny, label="sin(x)")
plt.plot(x, cosy, color="red", linestyle="--", label="cos(x)")
plt.xlabel("x axis")
plt.ylabel("y value")
plt.legend()
plt.title("Welcome to matplotlib world!")
plt.show()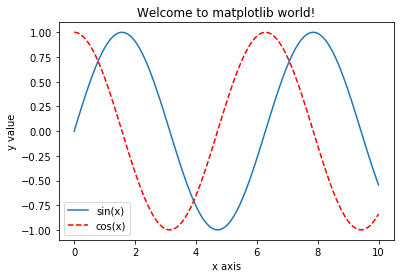
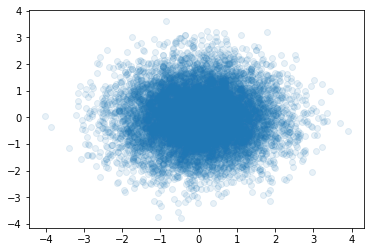
散点图
python
plt.scatter(x, siny)
plt.show()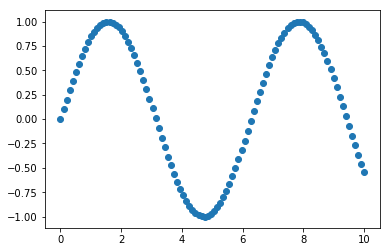
python
plt.scatter(x, siny)
plt.scatter(x, cosy, color="red")
plt.show()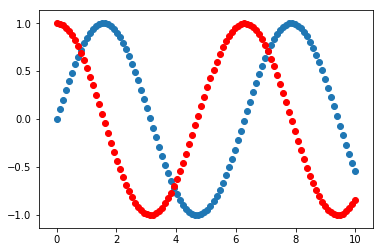
python
x = np.random.normal(0, 1, 10000)
y = np.random.normal(0, 1, 10000)

plt.scatter(x, y, alpha=0.1)
plt.show()