目录
概述
1 分析数据遇到需要一个股票多个指标对比或一个指标多个股票对比,涉及到同轴多条曲线的显示,所以开发了本工具。
2 多曲线显示部分可以当通用工具使用。
3 数据计算使用compile动态执行代码,返回固定格式的数据进行显示,尽最大可能实现工具的灵活性。
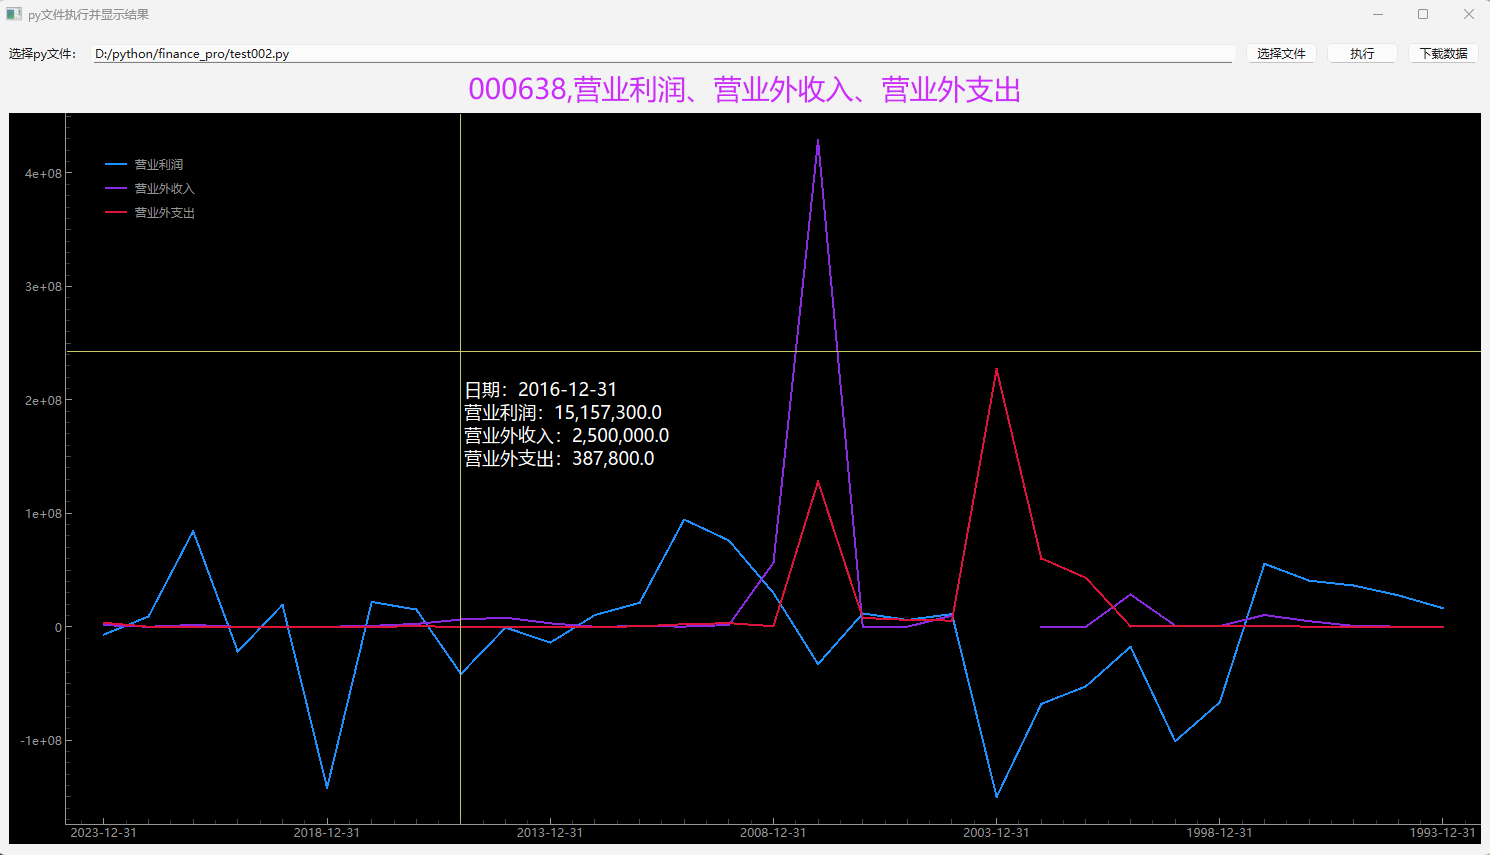
效果
代码
返回结果对象
import pandas as pd
from dataclasses import dataclass,field
@dataclass
class MultiLineObj:
    title:str=''
    df:pd.DataFrame=pd.DataFrame()
    col_dict: dict = field(default_factory=dict)
    error_msg:str = ''
    status:str='ok'
    pass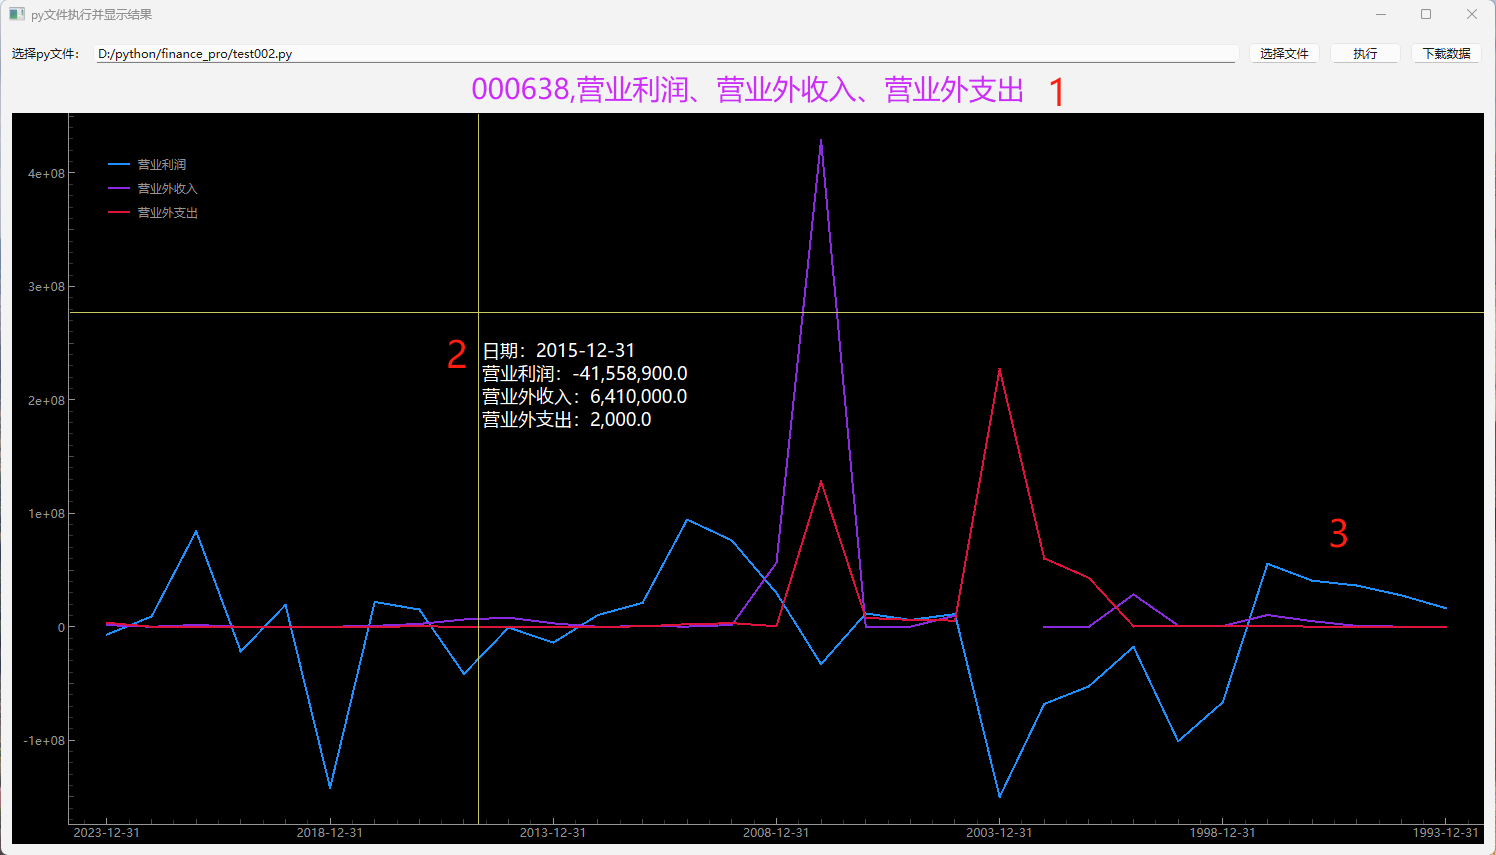
1 对应结果中的 title
2 字段中文名取自 col_dict = {df中的列名:中文名}
3 对应df中的数据,还用于右上角下载按钮,点击下载按钮可以将df数据下载到本地
字符型横坐标
class StrAxisItem(pg.AxisItem):
    def __init__(self,ticks,*args,**kwargs):
        pg.AxisItem.__init__(self,*args,**kwargs)
        self.x_values = [x[0] for x in ticks]
        self.x_strings = [x[1] for x in ticks]
        pass
    def tickStrings(self, values, scale, spacing):
        strings = []
        for v in values:
            vs = v*scale
            if vs in self.x_values:
                vstr = self.x_strings[self.x_values.index(vs)]
            else:
                vstr = ''
            strings.append(vstr)
        return strings
继承pg.AxisItem, 重写tickStrings方法
通用折线图工具
class MultiLineGraphWidget(pg.PlotWidget):
    def __init__(self):
        super().__init__()
        self.init_data()
        pass
    def init_data(self):
        self.whole_df:pd.DataFrame = pd.DataFrame()
        # pd的col名:显示名
        self.whole_col_dict:dict = {}
        self.color_10_list = [(30,144,255),(138,43,226),(220,20,60),(0,128,128),(0,255,255),(0,250,154),(173,255,47),(255,255,224),(255,215,0),(255,140,0)]
        pass
    def set_data(self,df:pd.DataFrame,col_dict:dict):
        self.clear()
        self.addLegend()

        self.whole_df = df
        self.whole_col_dict = col_dict

        x = df['x'].to_list()
        xTicks = df.loc[:, ['x', 'reportDate']].values

        i = 0
        for k,v in col_dict.items():
            one_color = self.color_10_list[i%len(self.color_10_list)]
            one_curve = pg.PlotCurveItem(x=np.array(x),y=np.array(df[k].to_list()),pen=pg.mkPen({'color':one_color,'width':2}),connect='finite',name=v)
            self.addItem(one_curve)
            i += 1
            pass

        horAxis = StrAxisItem(ticks=xTicks, orientation='bottom')
        self.setAxisItems({'bottom':horAxis})

        self.vLine = pg.InfiniteLine(angle=90,movable=False)
        self.hLine = pg.InfiniteLine(angle=0,movable=False)
        self.label = pg.TextItem()

        self.addItem(self.vLine,ignoreBounds=True)
        self.addItem(self.hLine,ignoreBounds=True)
        self.addItem(self.label,ignoreBounds=True)

        self.vb = self.getViewBox()
        self.proxy = pg.SignalProxy(self.scene().sigMouseMoved, rateLimit=60, slot=self.pw_mouseMoved)
        self.enableAutoRange()
        pass
    def pw_mouseMoved(self, evt):
        pos = evt[0]
        if self.sceneBoundingRect().contains(pos):
            mousePoint = self.vb.mapSceneToView(pos)
            index = int(mousePoint.x())
            if index>=0 and index<len(self.whole_df):
                html_str = '<p style="color:white;font-size:18px;">'
                html_str += f"<br/>日期:{self.whole_df.loc[self.whole_df['x'] == index].iloc[0]['reportDate']}"
                for k,v in self.whole_col_dict.items():
                    html_str += f"<br/>{v}:{self.whole_df.loc[self.whole_df['x'] == index].iloc[0][k]:,}"
                    pass
                html_str += '</p>'
                self.label.setHtml(html_str)
                self.label.setPos(mousePoint.x(),mousePoint.y())
                pass
            self.vLine.setPos(mousePoint.x())
            self.hLine.setPos(mousePoint.y())
        pass
    def wheelEvent(self,ev):
        if len(self.whole_df) <= 0:
            super().wheelEvent(ev)
        else:
            delta = ev.angleDelta().x()
            if delta == 0:
                delta = ev.angleDelta().y()

            s = 1.001 ** delta

            before_xmin, before_xmax = self.viewRange()[0]
            val_x = self.getViewBox().mapSceneToView(ev.position()).x()

            after_xmin = int(val_x - (val_x - before_xmin) // s)
            after_xmax = int(val_x + (before_xmax - val_x) // s)

            if after_xmin < 1:
                after_xmin = 0
            if after_xmin >= len(self.whole_df):
                after_xmin = max(len(self.whole_df) - 3, len(self.whole_df) - 1)
            if after_xmax < 1:
                after_xmax = min(len(self.whole_df) - 1, 1)
            if after_xmax >= len(self.whole_df):
                after_xmax = len(self.whole_df) - 1

            df00 = self.whole_df.loc[(self.whole_df['x'] >= after_xmin) & (self.whole_df['x'] <= after_xmax)].copy()
            min_list = []
            max_list = []
            for k in self.whole_col_dict.keys():
                min_list.append(df00[k].min())
                max_list.append(df00[k].max())
                pass
            after_ymin = min(min_list)
            after_ymax = max(max_list)

            self.setXRange(after_xmin, after_xmax)
            self.setYRange(after_ymin, after_ymax)
            pass
    pass
1)工具中设置了10种颜色,不同曲线将显示不同颜色,如果曲线个数超过10个,将循环使用颜色
2)set_data方法需要带入df 和 col_dict两个参数
2.1)df 必须要有 x 、reportDate 两个字段,x为递增整数,reportDate为横坐标要显示的字符,reportDate为字符型。
2.2)折线的y轴数据在df中的列名为 col_dict中的key值,建议列名为英文和数字组成,col_dict中的val为中文名
工具主界面
class PyExcuteGraphShowWidget(QWidget):
    def __init__(self):
        super().__init__()
        self.setWindowTitle('py文件执行并显示结果')
        self.setMinimumSize(QSize(1000,800))

        label00 = QLabel('选择py文件:')
        self.lineedit_file = QLineEdit()
        btn_choice = QPushButton('选择文件',clicked=self.btn_choice_clicked)
        self.btn_excute = QPushButton('执行',clicked=self.btn_excute_clicked)
        btn_download = QPushButton('下载数据',clicked=self.btn_download_clicked)

        self.label_title = QLabel('指标', alignment=Qt.AlignmentFlag.AlignHCenter)
        self.label_title.setStyleSheet("font-size:28px;color:#CC2EFA;")
        self.pw = MultiLineGraphWidget()

        layout00 = QHBoxLayout()
        layout00.addWidget(label00)
        layout00.addWidget(self.lineedit_file)
        layout00.addWidget(btn_choice)
        layout00.addWidget(self.btn_excute)
        layout00.addWidget(btn_download)

        layout = QVBoxLayout()
        layout.addLayout(layout00)
        layout.addWidget(self.label_title)
        layout.addWidget(self.pw)
        self.setLayout(layout)
        pass
    def open_init(self):
        self.whole_resObj:MultiLineObj = None
        pass
    def btn_choice_clicked(self):
        file_path,_ = QFileDialog.getOpenFileName(self,'选择文件')
        if file_path:
            self.lineedit_file.setText(file_path)
        pass
    def btn_excute_clicked(self):
        file_path = self.lineedit_file.text()
        if len(file_path) <= 0:
            QMessageBox.information(self,'提示','请选择要执行的py文件',QMessageBox.StandardButton.Ok)
            return
        with open(file_path,'r',encoding='utf-8') as fr:
            py_code = fr.read()
        namespace = {}
        fun_code = compile(py_code, '<string>', 'exec')
        exec(fun_code, namespace)
        res = namespace['execute_caculate']()
        if res.status == 'error':
            QMessageBox.information(self,'执行过程报错',res.error_msg,QMessageBox.StandardButton.Ok)
            return
        self.label_title.setText(res.title)
        self.whole_resObj = res
        df = res.df.copy()
        df['x'] = range(len(df))
        self.pw.set_data(df.copy(),res.col_dict)
        QMessageBox.information(self,'提示','执行完毕',QMessageBox.StandardButton.Ok)
        pass

    def btn_download_clicked(self):
        if self.whole_resObj is None or self.whole_resObj.status == 'error':
            QMessageBox.information(self,'提示','数据为空',QMessageBox.StandardButton.Ok)
            return
        dir_name = QFileDialog.getExistingDirectory(self,'选择保存位置')
        if dir_name:
            df = self.whole_resObj.df.copy()
            df.rename(columns=self.whole_resObj.col_dict,inplace=True)
            df.to_csv(dir_name+os.path.sep + self.whole_resObj.title +'.csv',encoding='utf-8',index=False)
            QMessageBox.information(self,'提示','下载完毕',QMessageBox.StandardButton.Ok)
            pass
    pass
使用举例
需要导入的包和运行代码
import os,sys
import pandas as pd
import numpy as np
from PyQt6.QtCore import (
QSize,
Qt
)
from PyQt6.QtWidgets import (
    QApplication,
    QLabel,
    QPushButton,
    QWidget,
    QVBoxLayout,
    QHBoxLayout,
    QFileDialog,
    QMessageBox,
    QLineEdit
)
import pyqtgraph as pg
from objects import MultiLineObj

if __name__ == '__main__':
    app = QApplication(sys.argv)
    mw = PyExcuteGraphShowWidget()
    mw.show()
    app.exec()
    pass
1)一个py文件例子,内容如下,方法名固定为 execute_caculate
def execute_caculate():
    import traceback
    import pandas as pd
    from utils import postgresql_utils
    from objects import MultiLineObj
    '''
    灵活py文件执行
    营业利润,营业外支出,营业外收入
    '''
    conn = postgresql_utils.connect_db()
    cur = conn.cursor()
    try:
        ticker = '000638'
        sql_str = f'''
        select reportDate,iii_operateProfit,add_nonoperateIncome,less_nonoperateExpenses from t_profit where ticker=\'{ticker}\' and reportDate like \'%-12-31\';
        '''
        cur.execute(sql_str)
        res = cur.fetchall()
        col_list = ['reportDate','a0','a1','a2']
        col_dict = {
            'a0':'营业利润',
            'a1':'营业外收入',
            'a2':'营业外支出'
        }
        df = pd.DataFrame(columns=col_list, data=res)
        res_obj = MultiLineObj(
            title=f'{ticker},营业利润、营业外收入、营业外支出',
            df=df,
            col_dict=col_dict,
            status='ok'
        )
        return res_obj
    except:
        res_obj = MultiLineObj(
            status='error',
            error_msg=traceback.format_exc()
        )
        return res_obj
    finally:
        cur.close()
        conn.close()
        pass
    pass
保存为 test002.py
注意:例子中涉及到的postgreSQL和财报数据在往期博文中可以找到。
2)点击"选择文件",选择 test002.py文件
3)点击"执行",执行完毕后就能显示效果图