目录
创建新类,继承pg.PlotWidget,在新类中实现业务内容,重写pg.PlotWidget中的wheelEvent方法并使用业务数据实现比较理想的缩放状态。
字符型横坐标代码
class StrAxisItem(pg.AxisItem):
    def __init__(self,ticks,*args,**kwargs):
        pg.AxisItem.__init__(self,*args,**kwargs)
        self.x_values = [x[0] for x in ticks]
        self.x_strings = [x[1] for x in ticks]
        pass
    def tickStrings(self, values, scale, spacing):
        strings = []
        for v in values:
            vs = v*scale
            if vs in self.x_values:
                vstr = self.x_strings[self.x_values.index(vs)]
            else:
                vstr = ''
            strings.append(vstr)
        return strings
折线图代码
class LineGraphWidget(pg.PlotWidget):
    def __init__(self):
        super().__init__()
        self.init_data()
        pass
    def init_data(self):
        self.whole_df:pd.DataFrame = pd.DataFrame()
        self.color_one = (30,144,255)
        self.color_two = (138,43,226)
        self.color_three = (220,20,60)
        pass
    def set_data(self,df:pd.DataFrame):
        self.clear()
        self.addLegend()

        self.whole_df = df

        x = df['x'].to_list()
        xTicks = df.loc[:, ['x', 'date']].values
        y_dict = {
            'one': df['one'].to_list(),
            'two': df['two'].to_list(),
            'three': df['three'].to_list()
        }

        one_curve = pg.PlotCurveItem(x=np.array(x),y=np.array(y_dict['one']),pen=pg.mkPen({'color':self.color_one}),connect='finite',name='one')
        two_curve = pg.PlotCurveItem(x=np.array(x),y=np.array(y_dict['two']),pen=pg.mkPen({'color':self.color_two}),connect='finite',name='two')
        three_curve = pg.PlotCurveItem(x=np.array(x),y=np.array(y_dict['three']),pen=pg.mkPen({'color':self.color_three}),connect='finite',name='three')

        horAxis = StrAxisItem(ticks=xTicks, orientation='bottom')
        self.setAxisItems({'bottom':horAxis})

        self.addItem(one_curve)
        self.addItem(two_curve)
        self.addItem(three_curve)

        self.vLine = pg.InfiniteLine(angle=90,movable=False)
        self.hLine = pg.InfiniteLine(angle=0,movable=False)
        self.label = pg.TextItem()

        self.addItem(self.vLine,ignoreBounds=True)
        self.addItem(self.hLine,ignoreBounds=True)
        self.addItem(self.label,ignoreBounds=True)

        self.vb = self.getViewBox()
        self.proxy = pg.SignalProxy(self.scene().sigMouseMoved, rateLimit=60, slot=self.pw_mouseMoved)
        self.enableAutoRange()
        pass
    def pw_mouseMoved(self, evt):
        pos = evt[0]
        if self.sceneBoundingRect().contains(pos):
            mousePoint = self.vb.mapSceneToView(pos)
            index = int(mousePoint.x())
            if index>=0 and index<len(self.whole_df):
                html_str = ''
                html_str += f"<br/>日期:{self.whole_df.loc[self.whole_df['x']==index].iloc[0]['date']}"
                html_str += f"<br/>one:{self.whole_df.loc[self.whole_df['x']==index].iloc[0]['one']}"
                html_str += f"<br/>two:{self.whole_df.loc[self.whole_df['x']==index].iloc[0]['two']}"
                html_str += f"<br/>three:{self.whole_df.loc[self.whole_df['x']==index].iloc[0]['three']}"

                self.label.setHtml(html_str)
                self.label.setPos(mousePoint.x(),mousePoint.y())
                pass
            self.vLine.setPos(mousePoint.x())
            self.hLine.setPos(mousePoint.y())
        pass
    def wheelEvent(self,ev):
        if len(self.whole_df) <= 0:
            super().wheelEvent(ev)
        else:
            delta = ev.angleDelta().x()
            if delta == 0:
                delta = ev.angleDelta().y()

            s = 1.001 ** delta

            before_xmin, before_xmax = self.viewRange()[0]
            val_x = self.getViewBox().mapSceneToView(ev.position()).x()

            after_xmin = int(val_x - (val_x - before_xmin) // s)
            after_xmax = int(val_x + (before_xmax - val_x) // s)

            if after_xmin < 1:
                after_xmin = 0
            if after_xmin >= len(self.whole_df):
                after_xmin = max(len(self.whole_df) - 3, len(self.whole_df) - 1)
            if after_xmax < 1:
                after_xmax = min(len(self.whole_df) - 1, 1)
            if after_xmax >= len(self.whole_df):
                after_xmax = len(self.whole_df) - 1

            # print(after_xmin, after_xmax)

            df00 = self.whole_df.loc[(self.whole_df['x'] >= after_xmin) & (self.whole_df['x'] <= after_xmax)].copy()
            after_ymin = min(df00['one'].min(), df00['two'].min(), df00['three'].min())
            after_ymax = max(df00['one'].max(), df00['two'].max(), df00['three'].max())
            self.setXRange(after_xmin, after_xmax)
            self.setYRange(after_ymin, after_ymax)
            pass
    pass
运行
if __name__ == '__main__':
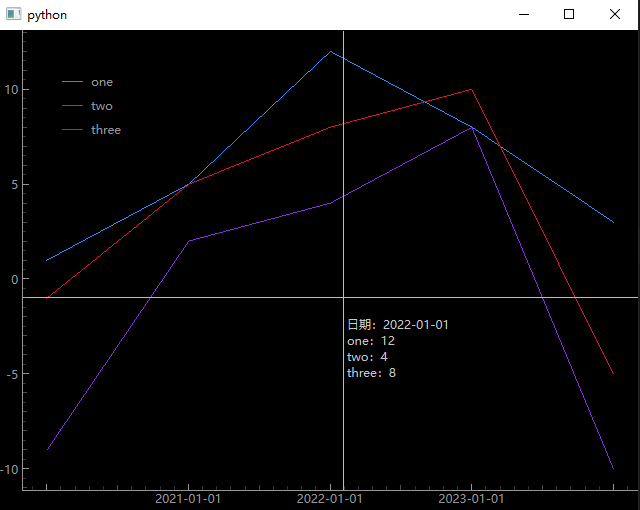
df = pd.DataFrame(data={
'date':['2020-01-01','2021-01-01','2022-01-01','2023-01-01','2024-01-01'],
'one':[1,5,12,8,3],
'two':[-9,2,4,8,-10],
'three':[-1,5,8,10,-5]
})
df['x'] = range(len(df))
app = QApplication([])
pw = LineGraphWidget()
pw.set_data(df.copy())
pw.show()
app.exec()
pass