prometheus登录地址为:ip+9090端口
graph页面
-
autocomplete 可以补全metrics tag信息或者内置的关键字,如:sum等聚合函数
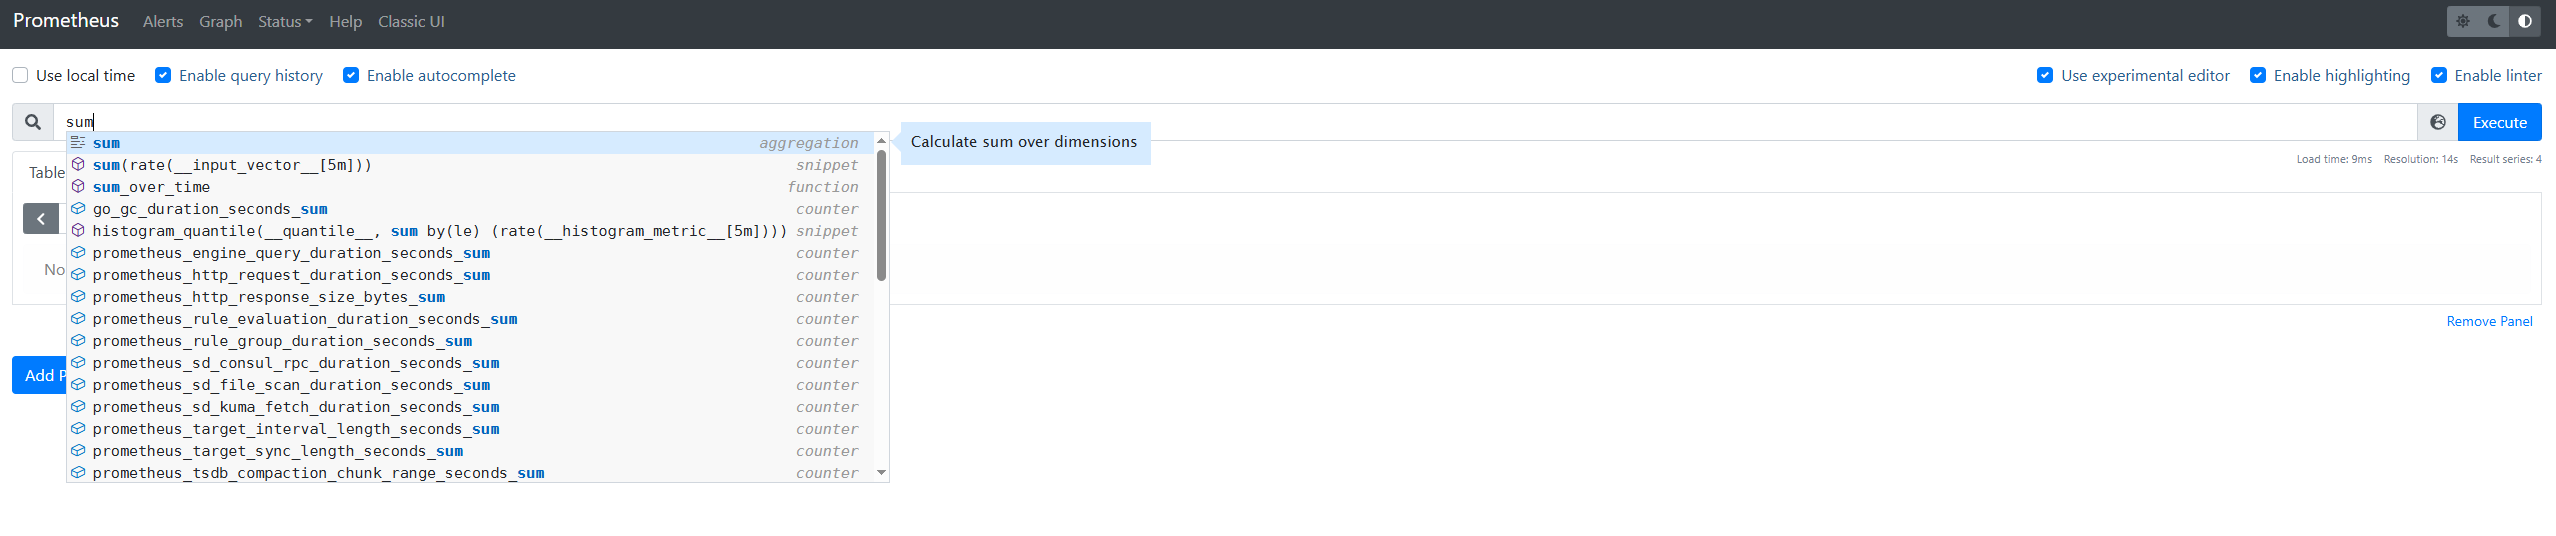
-
table查询 instante查询,一个点的查询
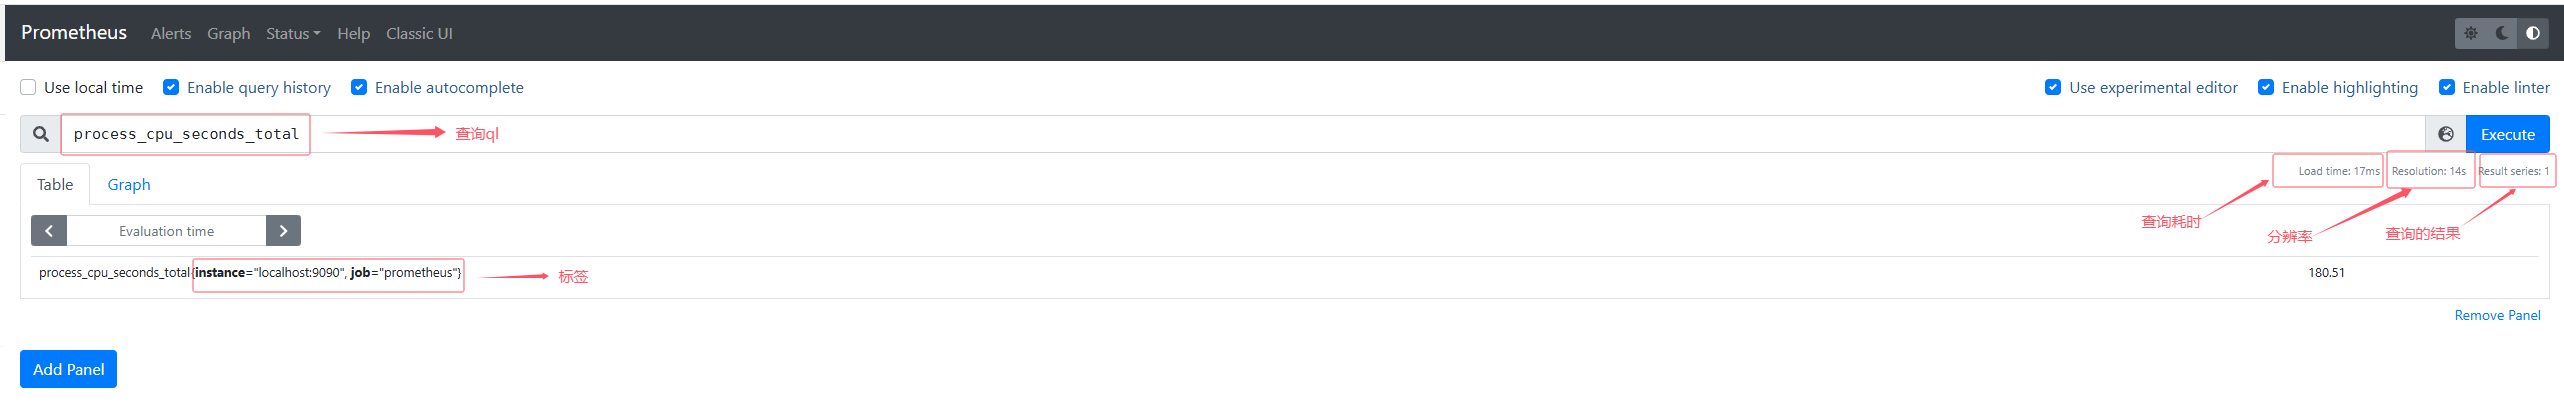
-
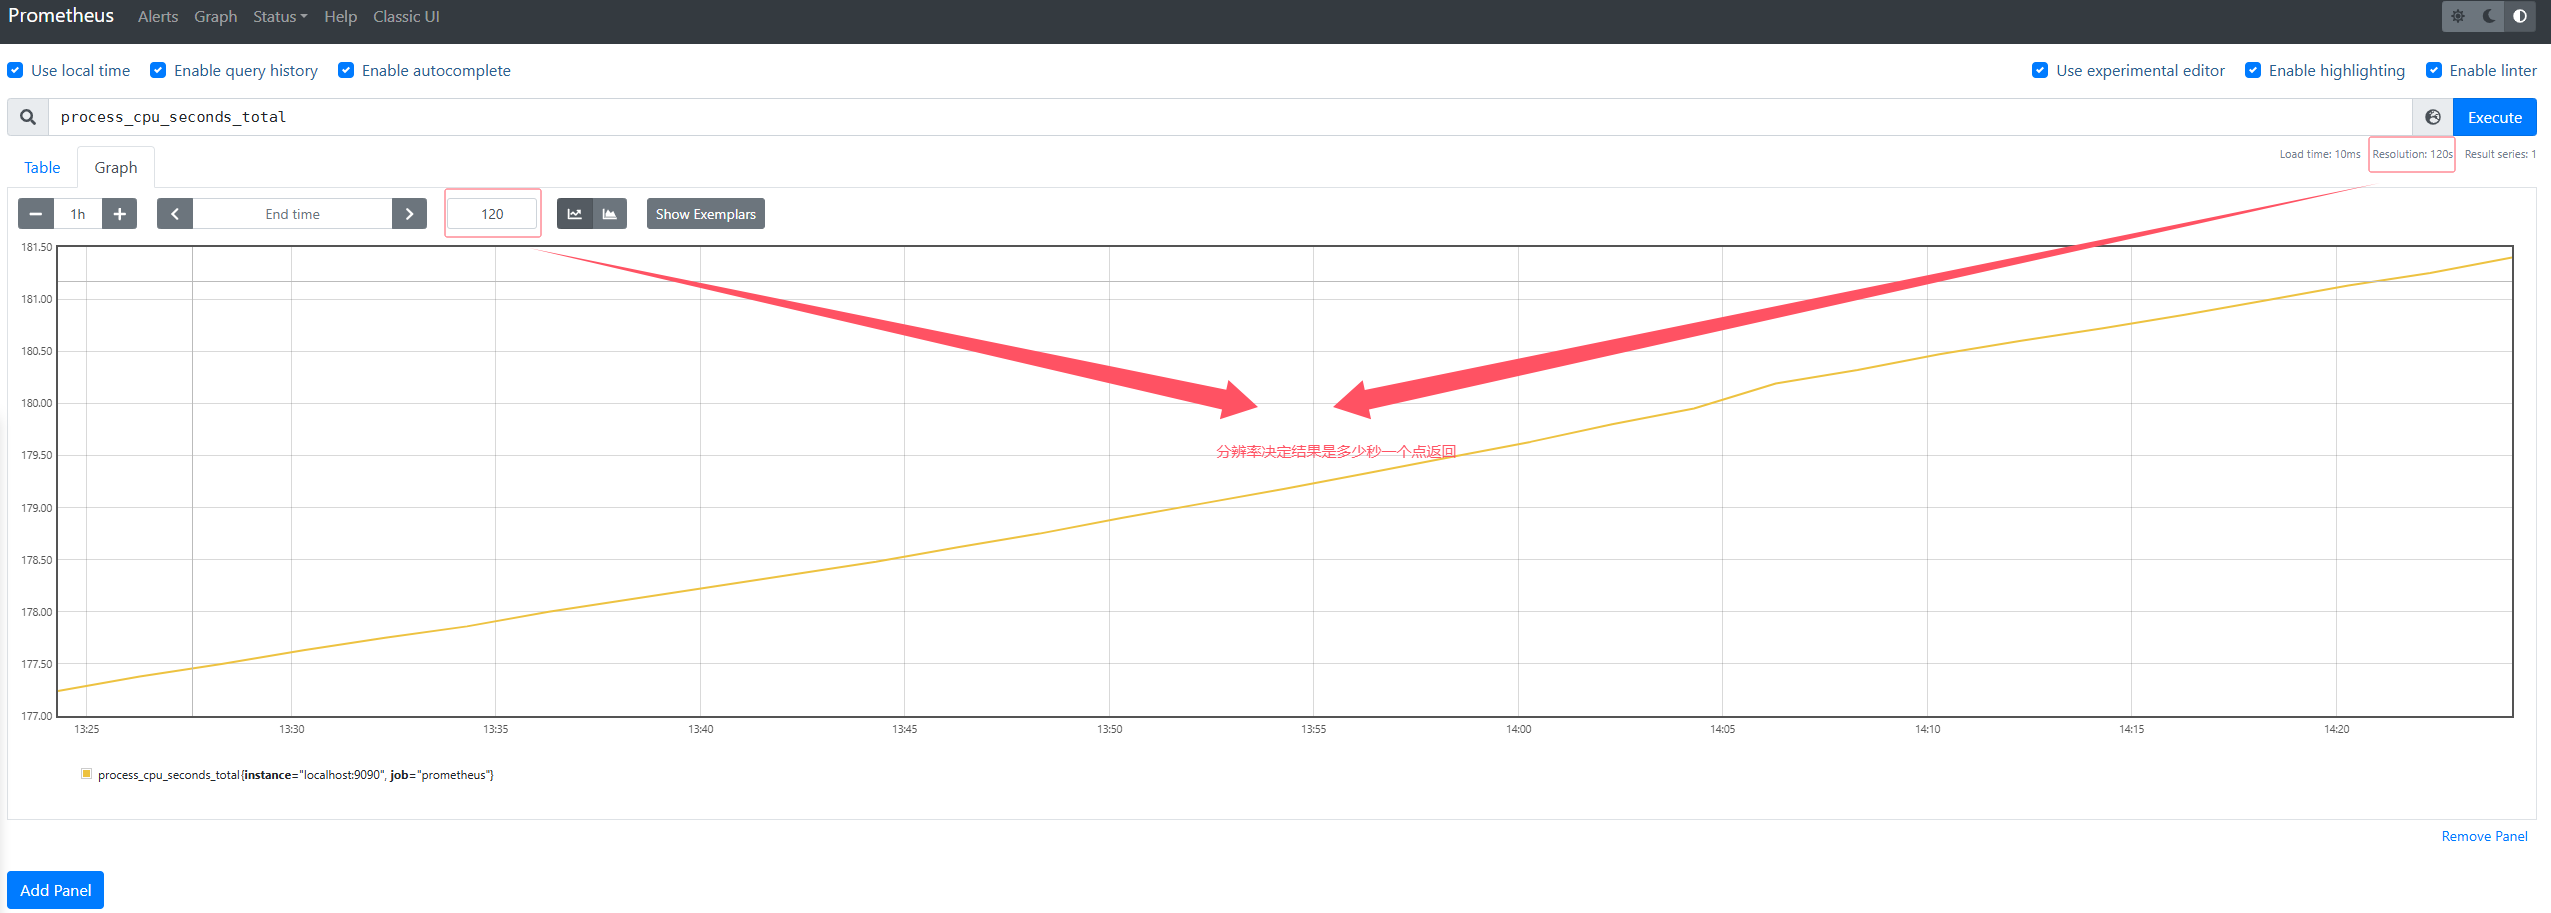
graph 查询
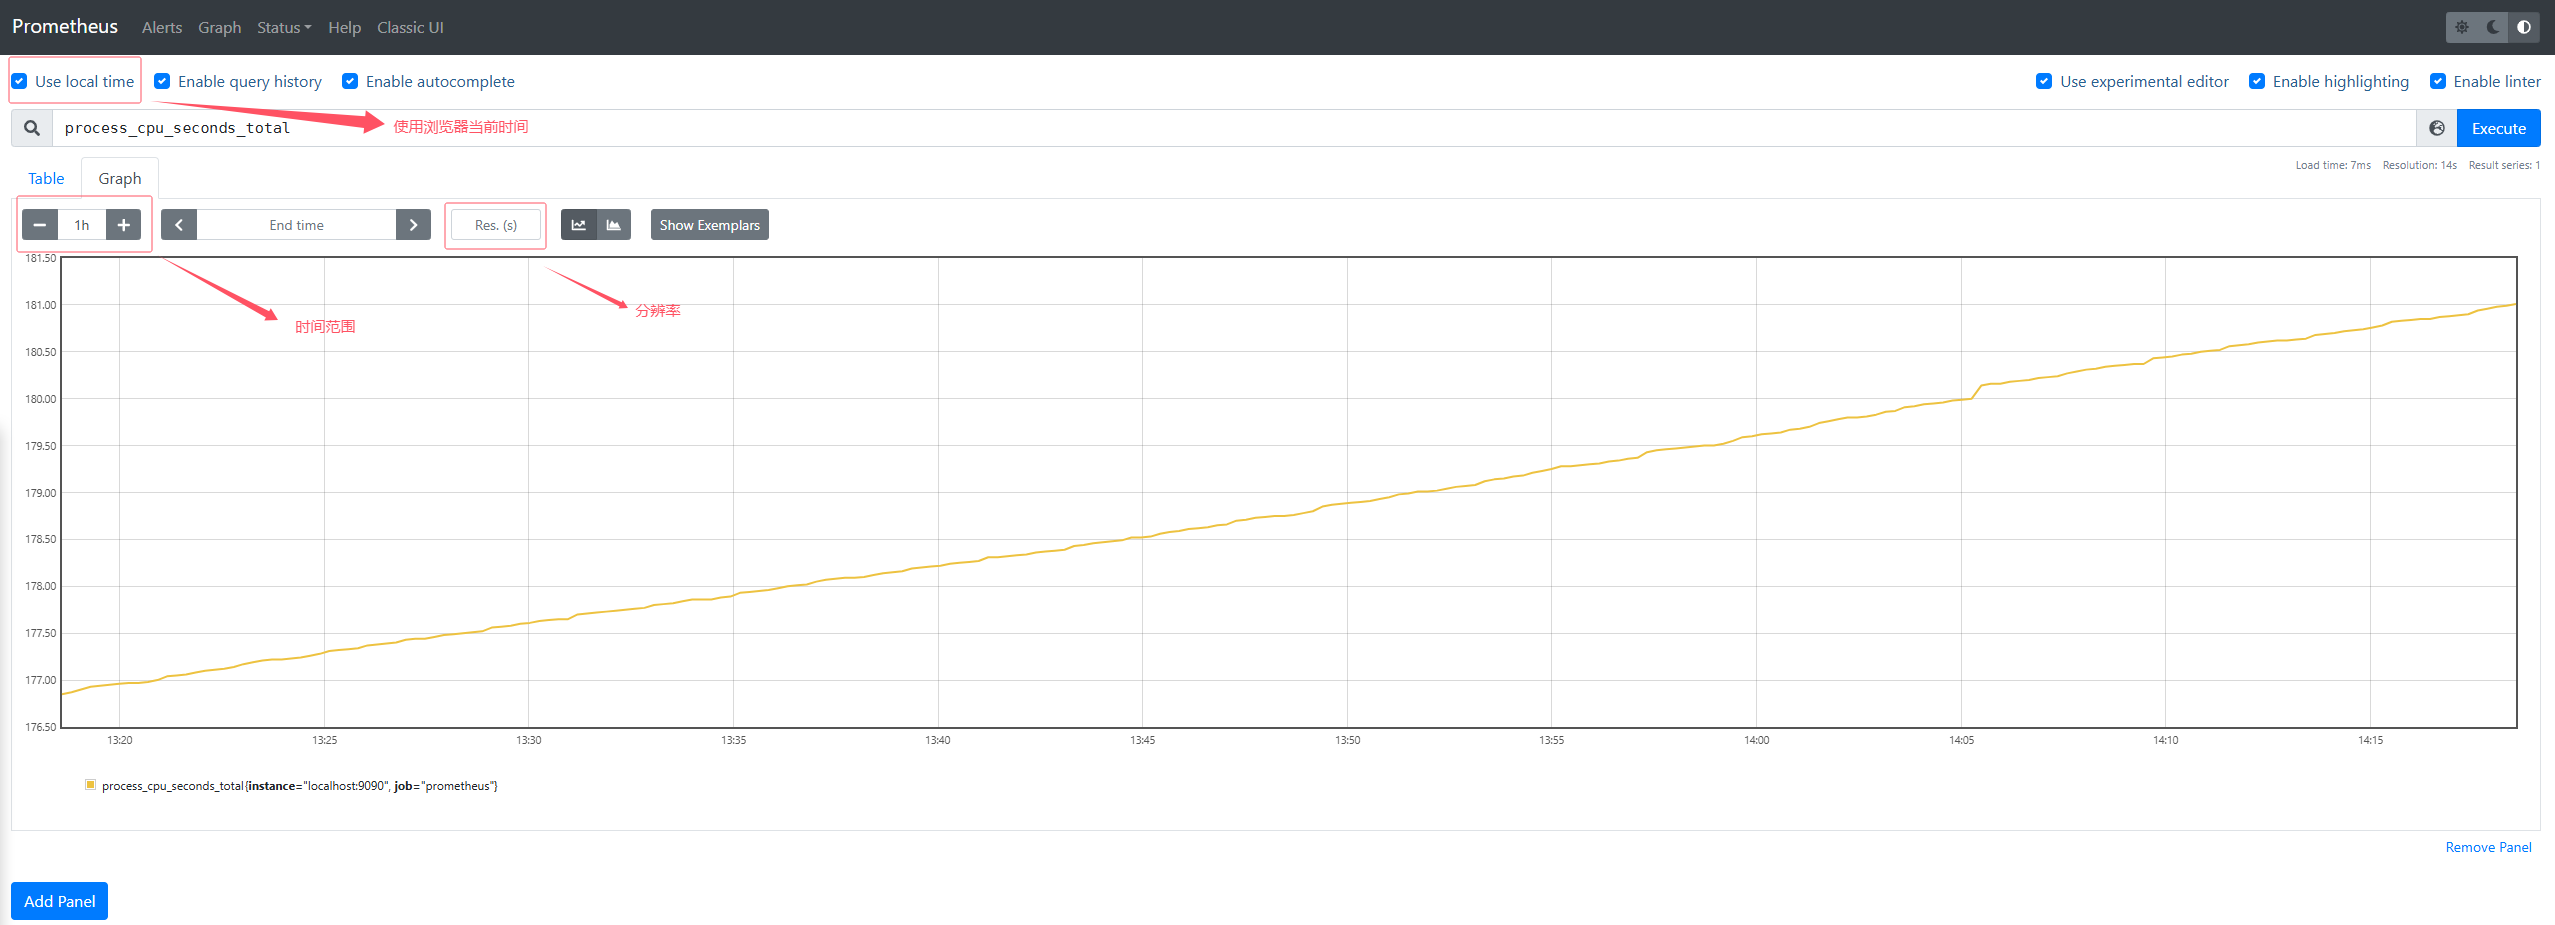
-
调整分辨率 resolution
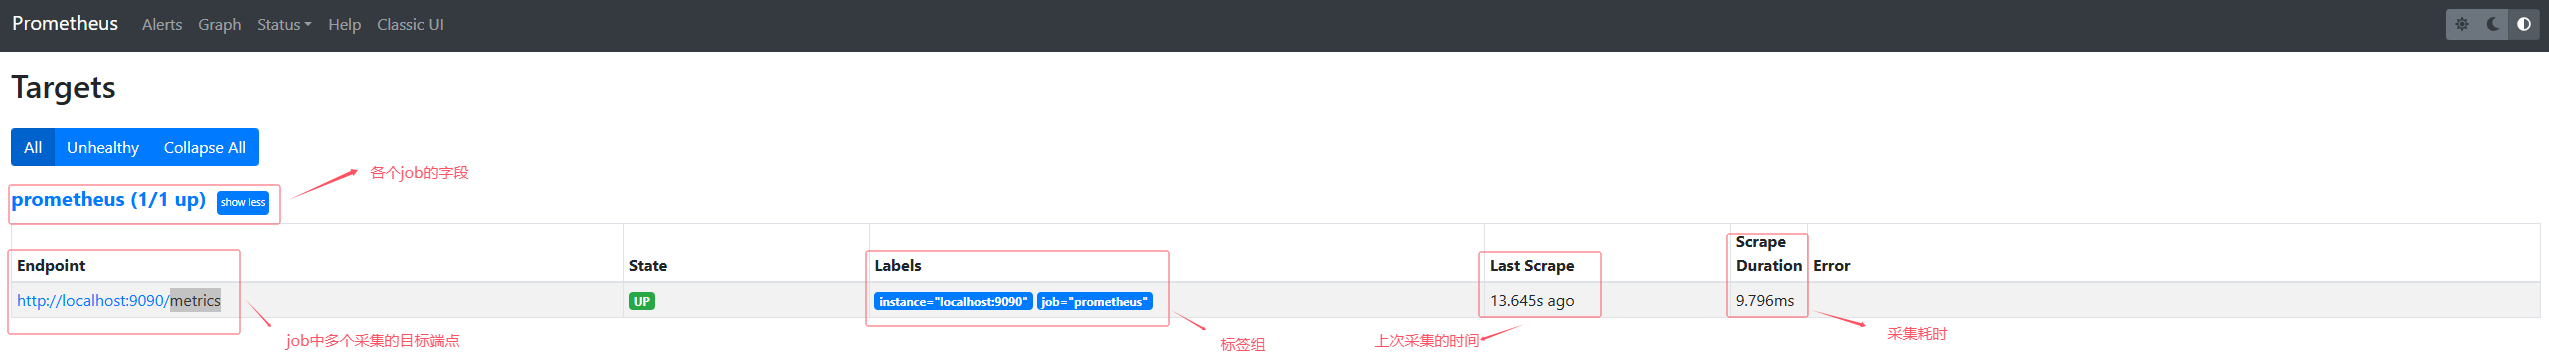
target页面展示采集任务
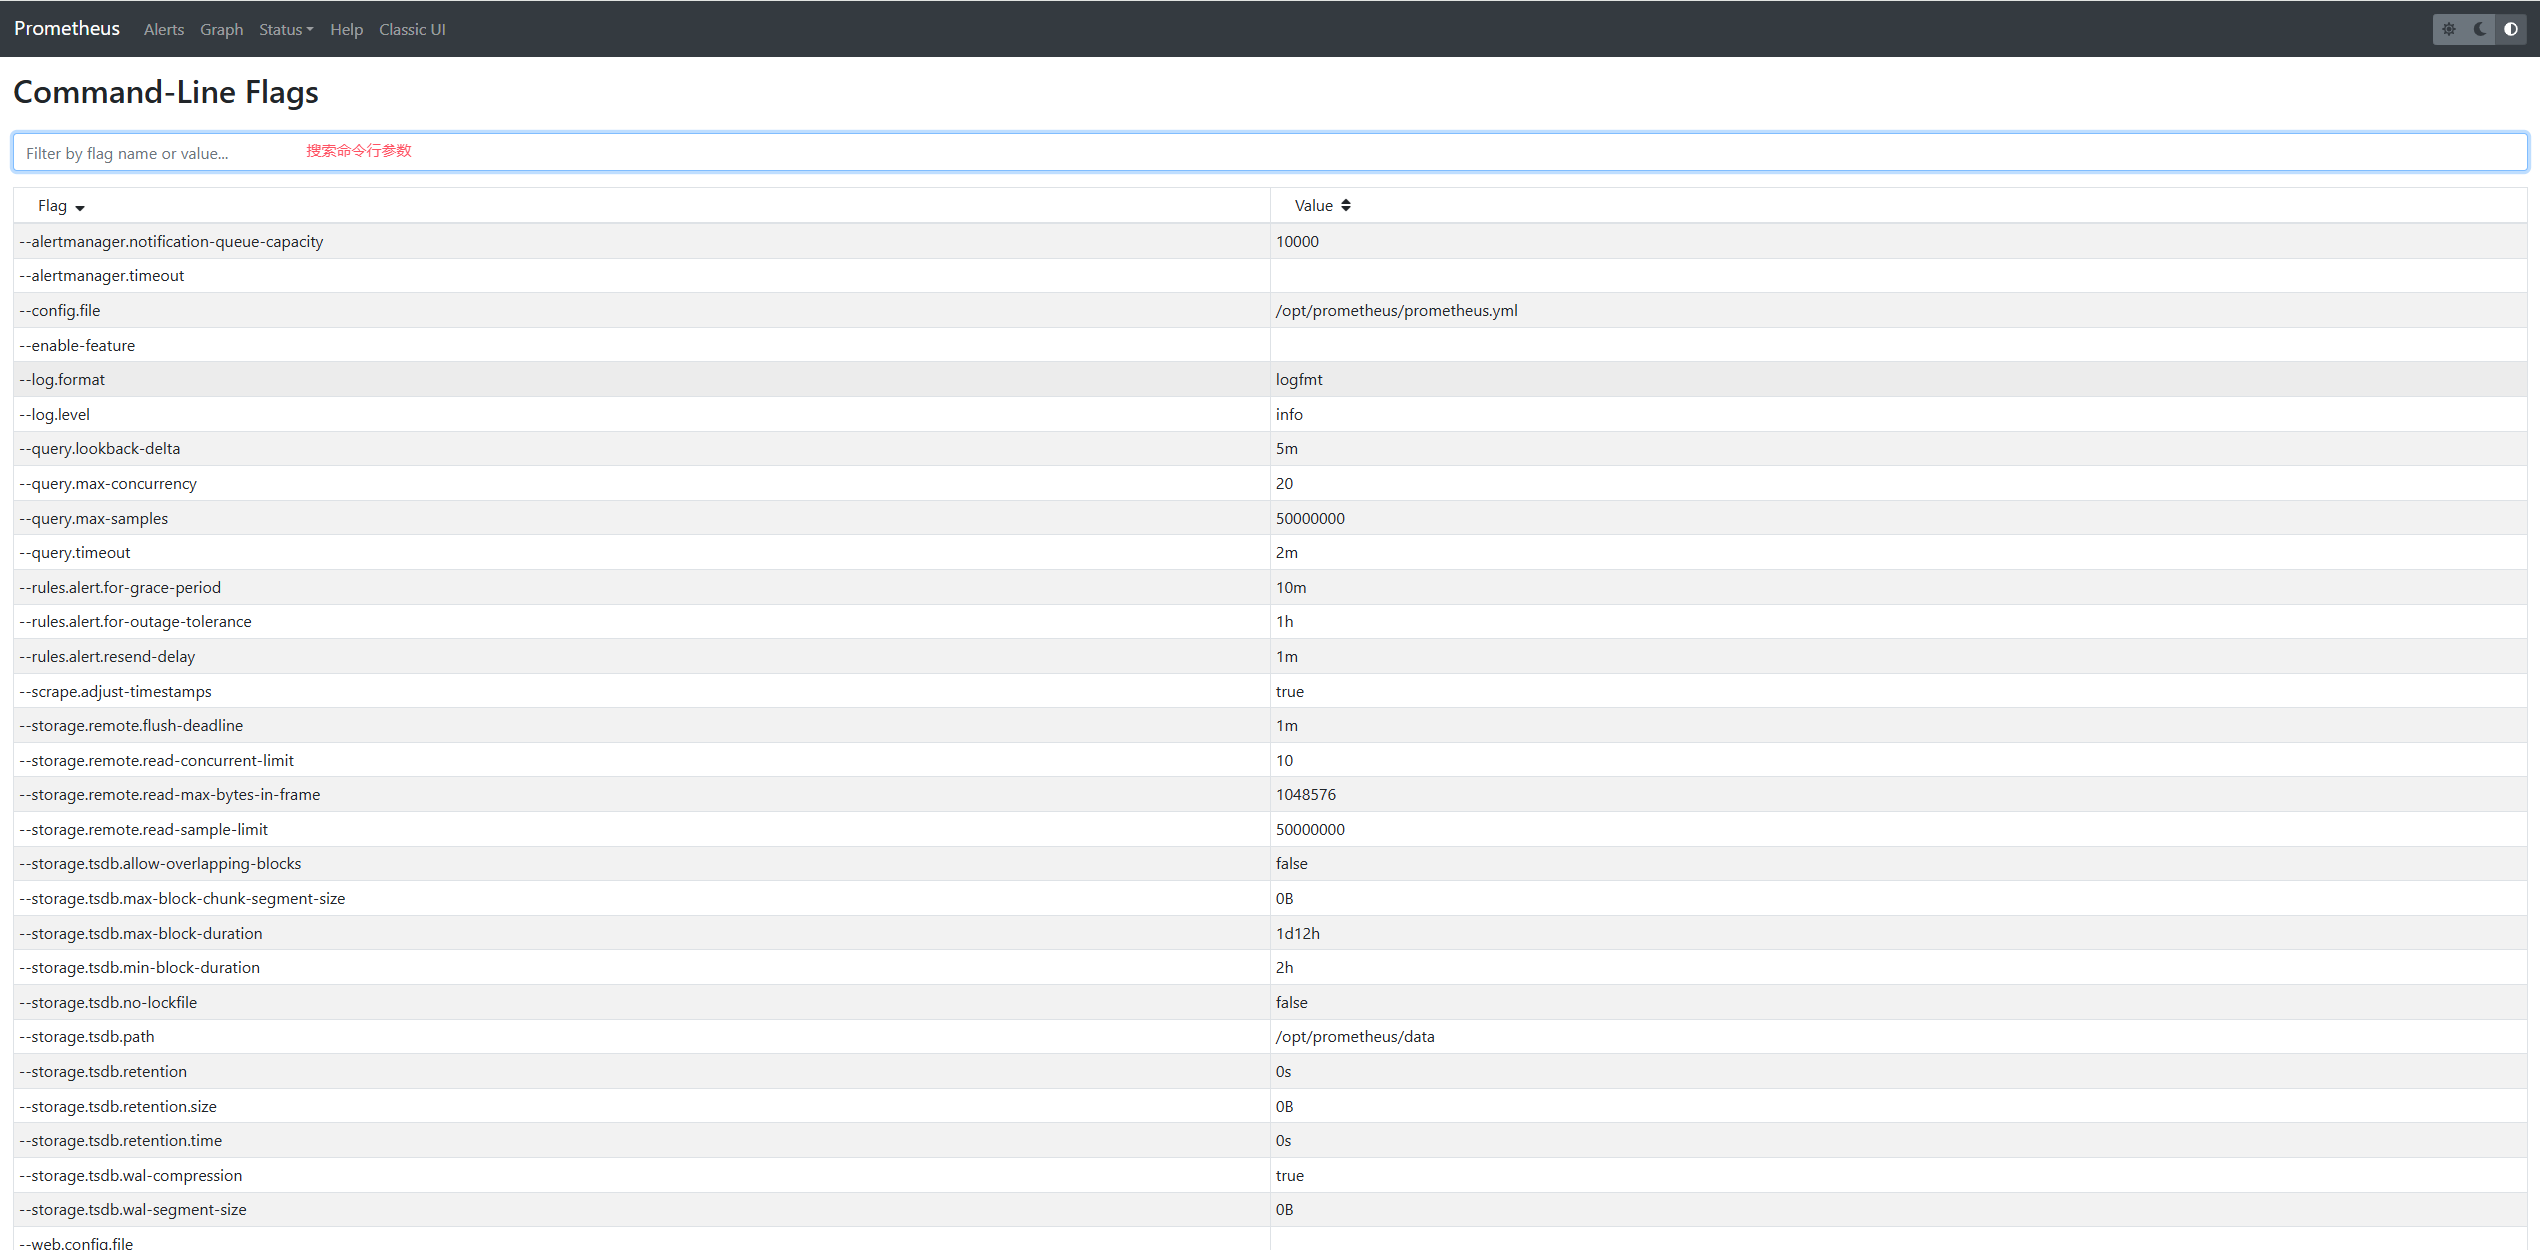
 flags页面
展示命令行参数,没设置的取默认值
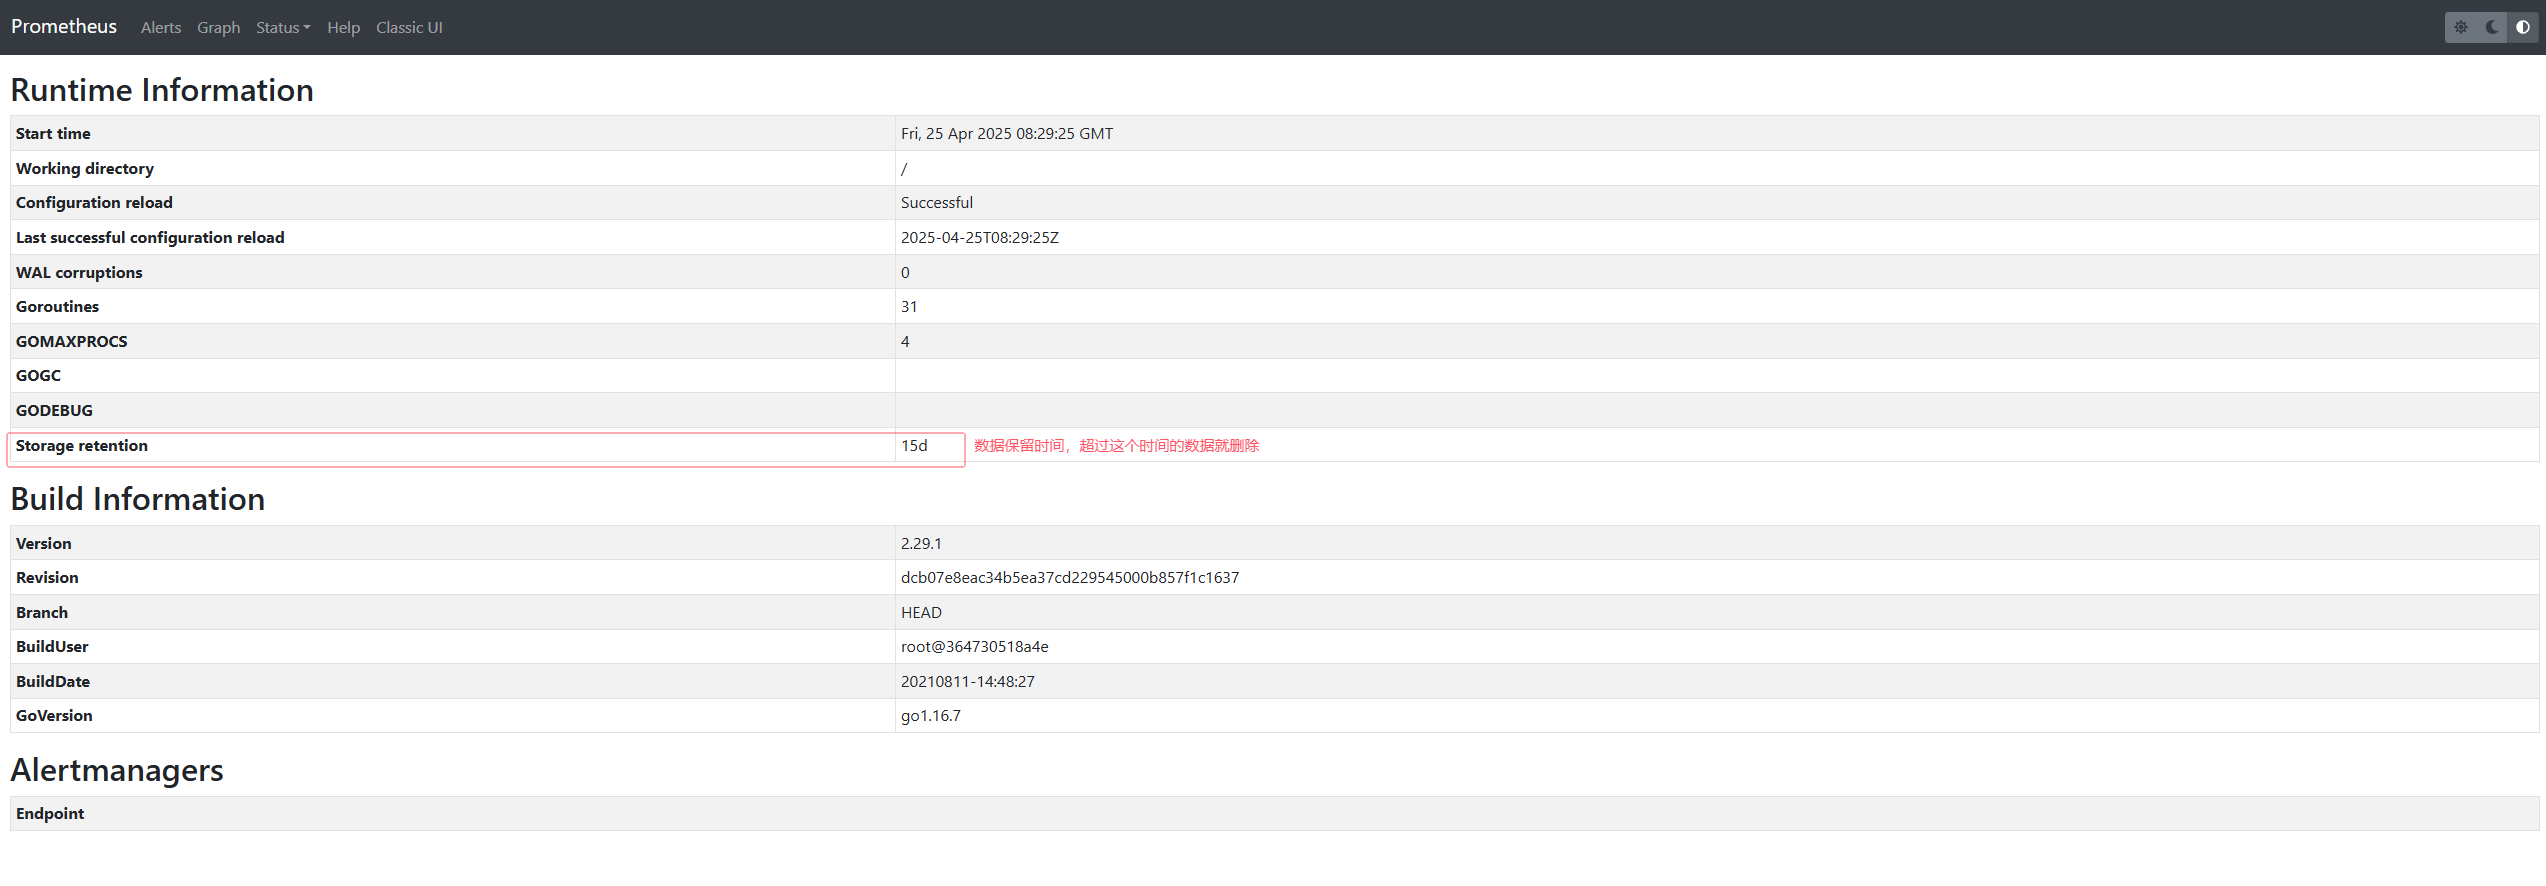
 status页面
描述运行信息和编译信息
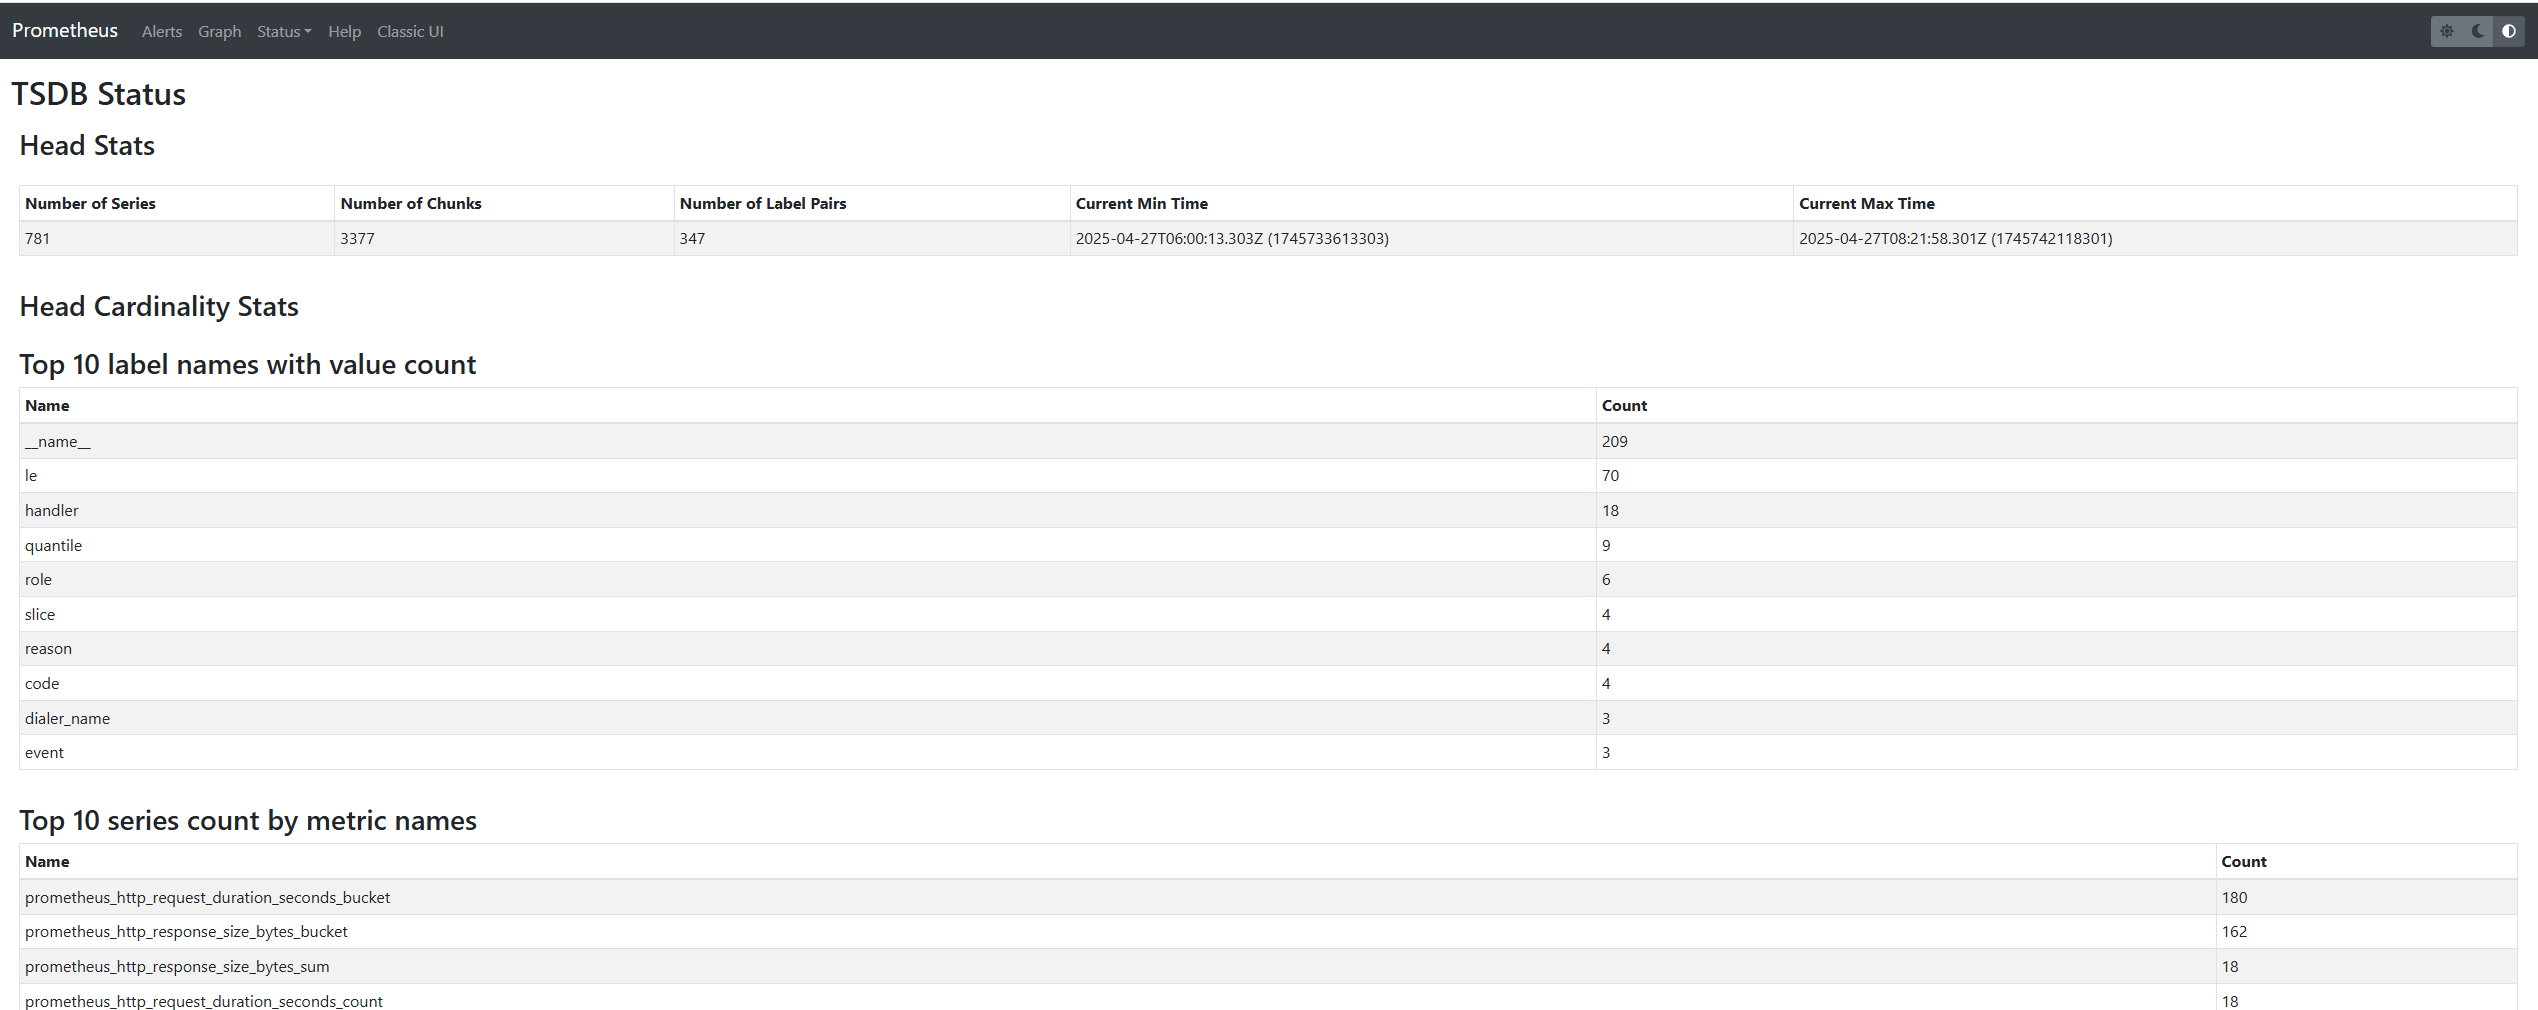
 tsdb-status页面
存储运行状态信息,定位重查询的
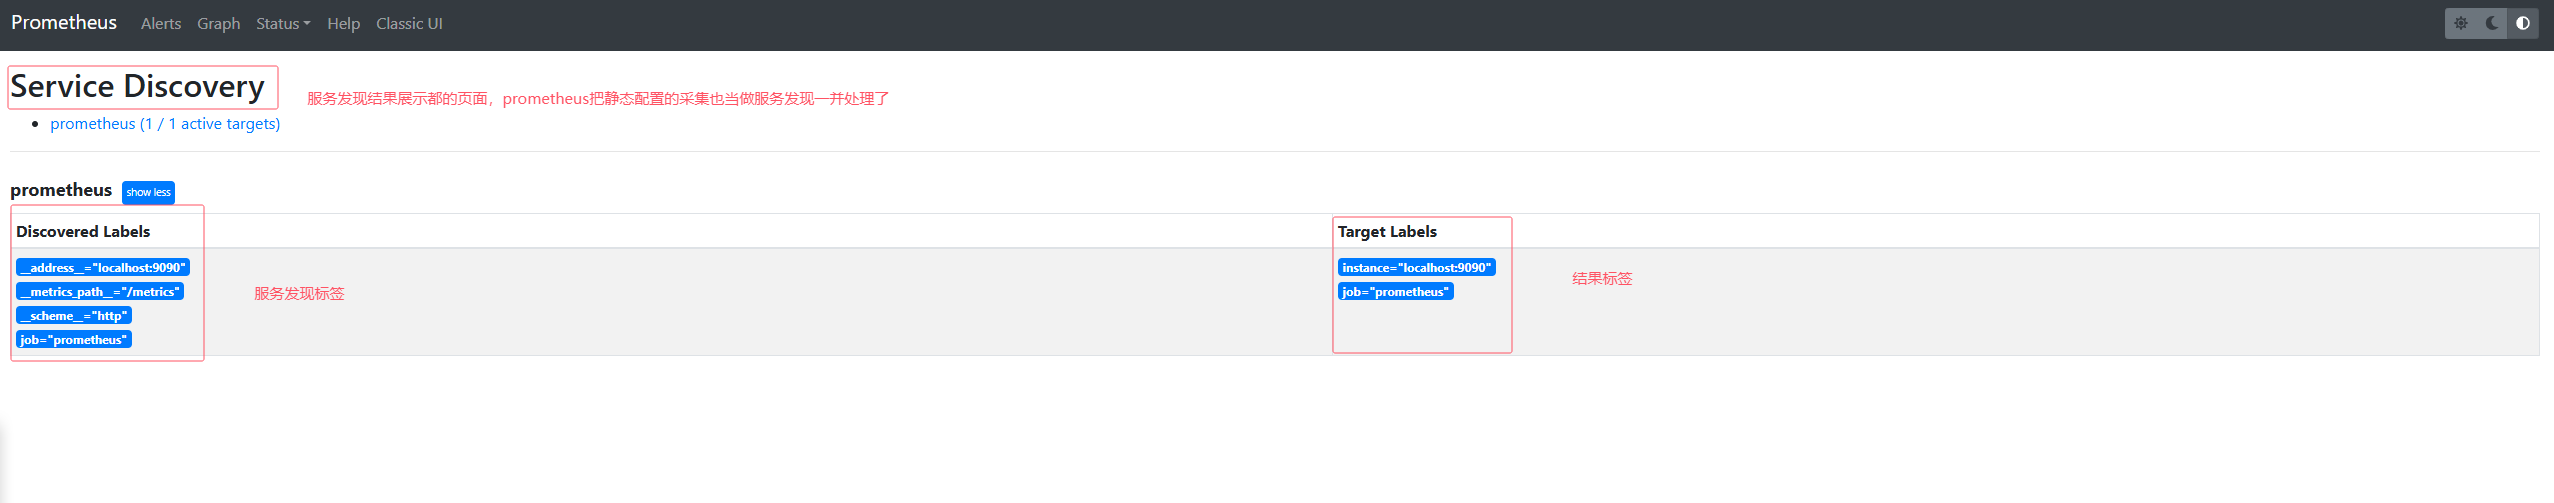
Service Discovery