运行环境:jupyter notebook (python 3.12.7) + Pyecharts
1.安装pyecharts
python
!pip install pyecharts验证安装是否成功:
python
from pyecharts import __version__
print("Pyecharts版本:", __version__)  # 应显示1.x以上版本
2.运行基础版代码,生成深/浅色双模式HTML
python
from pyecharts.charts import Line, Bar, Pie, Scatter, Page
from pyecharts import options as opts
import random

# 生成示例数据
categories = ['Mon', 'Tue', 'Wed', 'Thu', 'Fri', 'Sat', 'Sun']
data1 = [random.randint(20, 100) for _ in range(7)]
data2 = [random.randint(30, 150) for _ in range(7)]
pie_data = [('A', 45), ('B', 30), ('C', 25)]
scatter_data = [(i, random.randint(10, 50)) for i in range(20)]

# 创建 Page 实例
page = Page(layout=Page.SimplePageLayout)

# 折线图(添加固定ID)
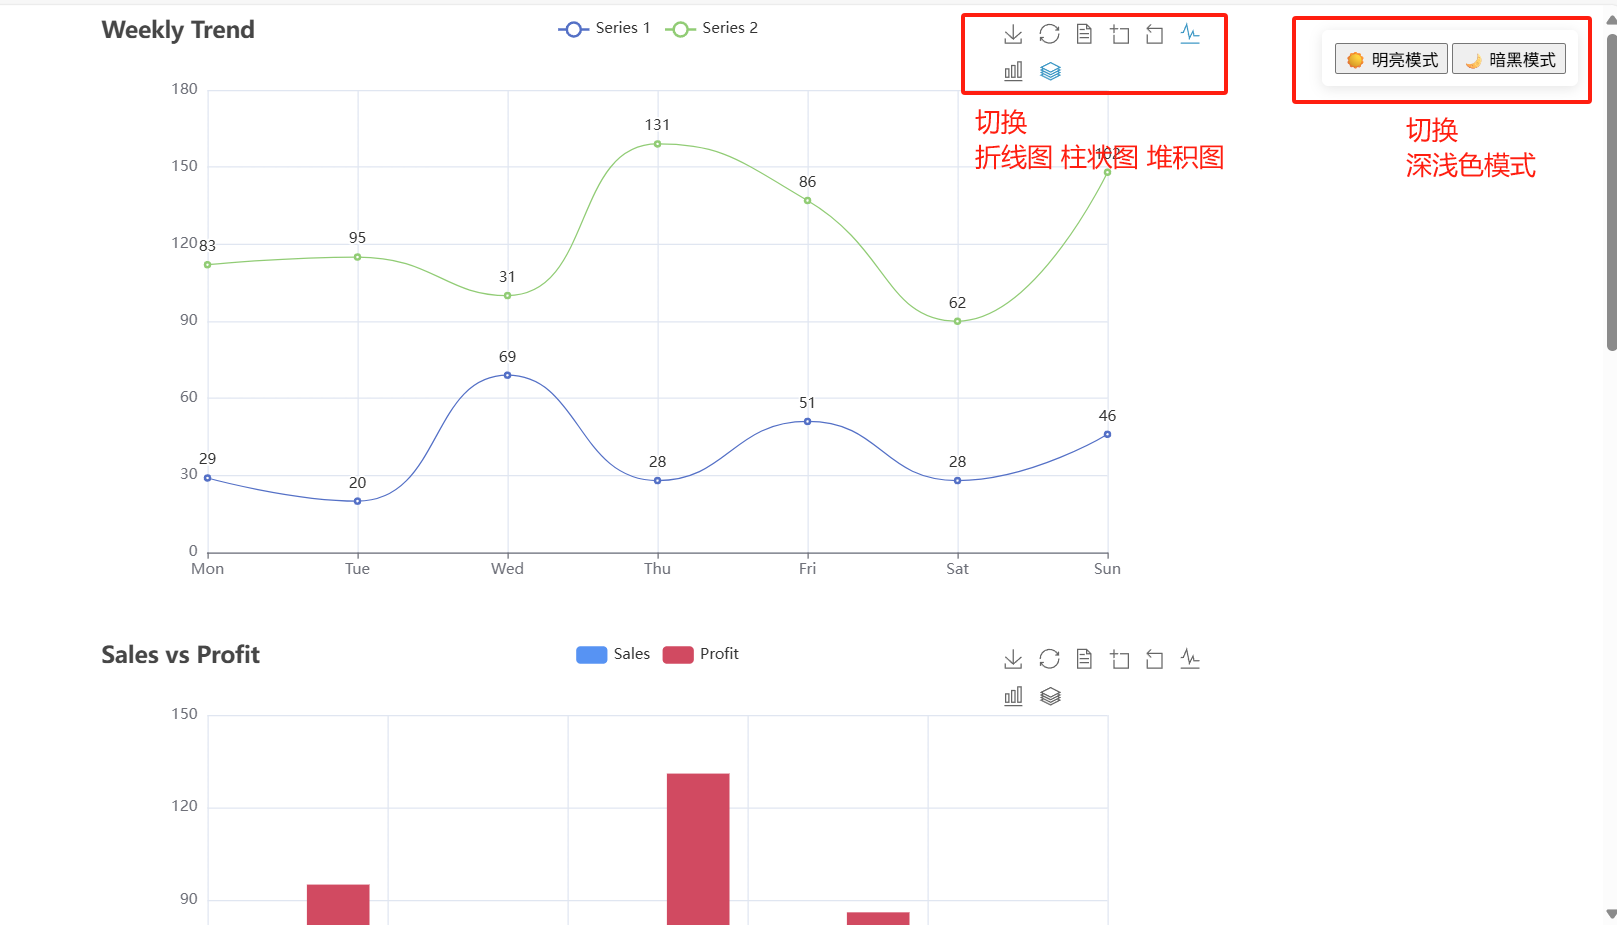
line = (
    Line(init_opts=opts.InitOpts(chart_id="chart_line"))
    .add_xaxis(categories)
    .add_yaxis("Series 1", data1, is_smooth=True)
    .add_yaxis("Series 2", data2, is_smooth=True)
    .set_global_opts(
        title_opts=opts.TitleOpts(title="Weekly Trend"),
        toolbox_opts=opts.ToolboxOpts(),
        tooltip_opts=opts.TooltipOpts(trigger="axis")
    )
)

# 柱状图(添加固定ID)
bar = (
    Bar(init_opts=opts.InitOpts(chart_id="chart_bar"))
    .add_xaxis(categories)
    .add_yaxis("Sales", data1, color="#5793f3")
    .add_yaxis("Profit", data2, color="#d14a61")
    .set_global_opts(
        title_opts=opts.TitleOpts(title="Sales vs Profit"),
        datazoom_opts=opts.DataZoomOpts(),
        toolbox_opts=opts.ToolboxOpts()
    )
)

# 饼图(添加固定ID)
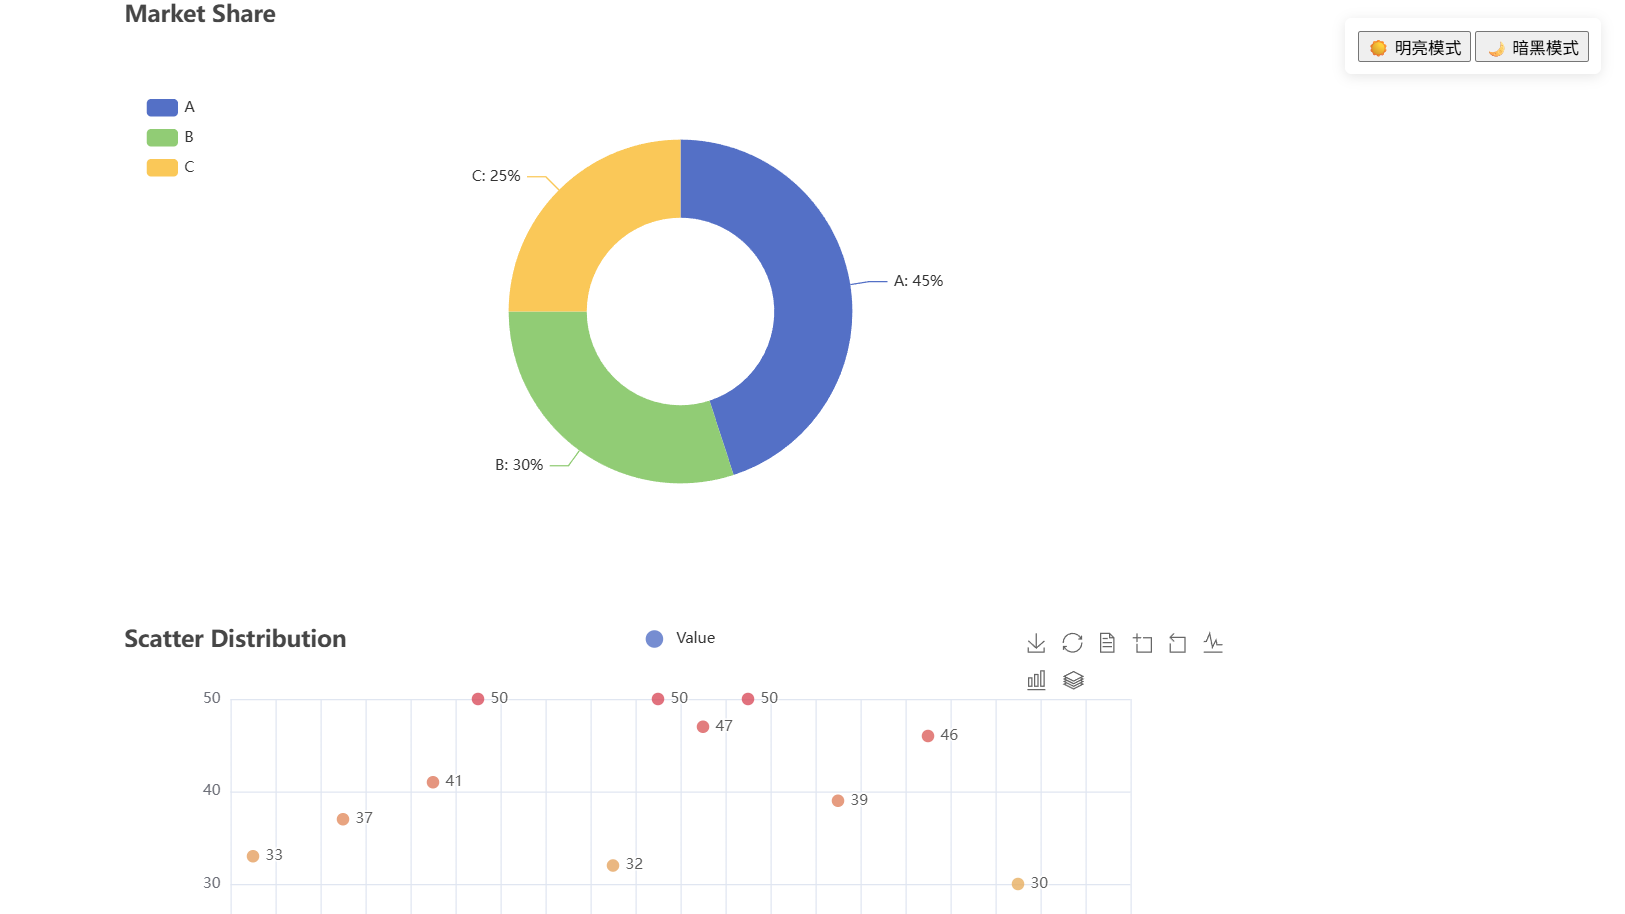
pie = (
    Pie(init_opts=opts.InitOpts(chart_id="chart_pie"))
    .add("", pie_data, radius=["30%", "55%"])
    .set_global_opts(
        title_opts=opts.TitleOpts(title="Market Share"),
        legend_opts=opts.LegendOpts(orient="vertical", pos_top="15%", pos_left="2%")
    )
    .set_series_opts(label_opts=opts.LabelOpts(formatter="{b}: {d}%"))
)

# 散点图(添加固定ID)
scatter = (
    Scatter(init_opts=opts.InitOpts(chart_id="chart_scatter"))
    .add_xaxis([x[0] for x in scatter_data])
    .add_yaxis("Value", [y[1] for y in scatter_data])
    .set_global_opts(
        title_opts=opts.TitleOpts(title="Scatter Distribution"),
        toolbox_opts=opts.ToolboxOpts(),
        visualmap_opts=opts.VisualMapOpts(max_=50)
    )
)

# 将图表添加到 Page
page.add(line, bar, pie, scatter)

# 生成初始 HTML
page.render("dashboard.html")

# ------------- 手动添加交互功能 --------------
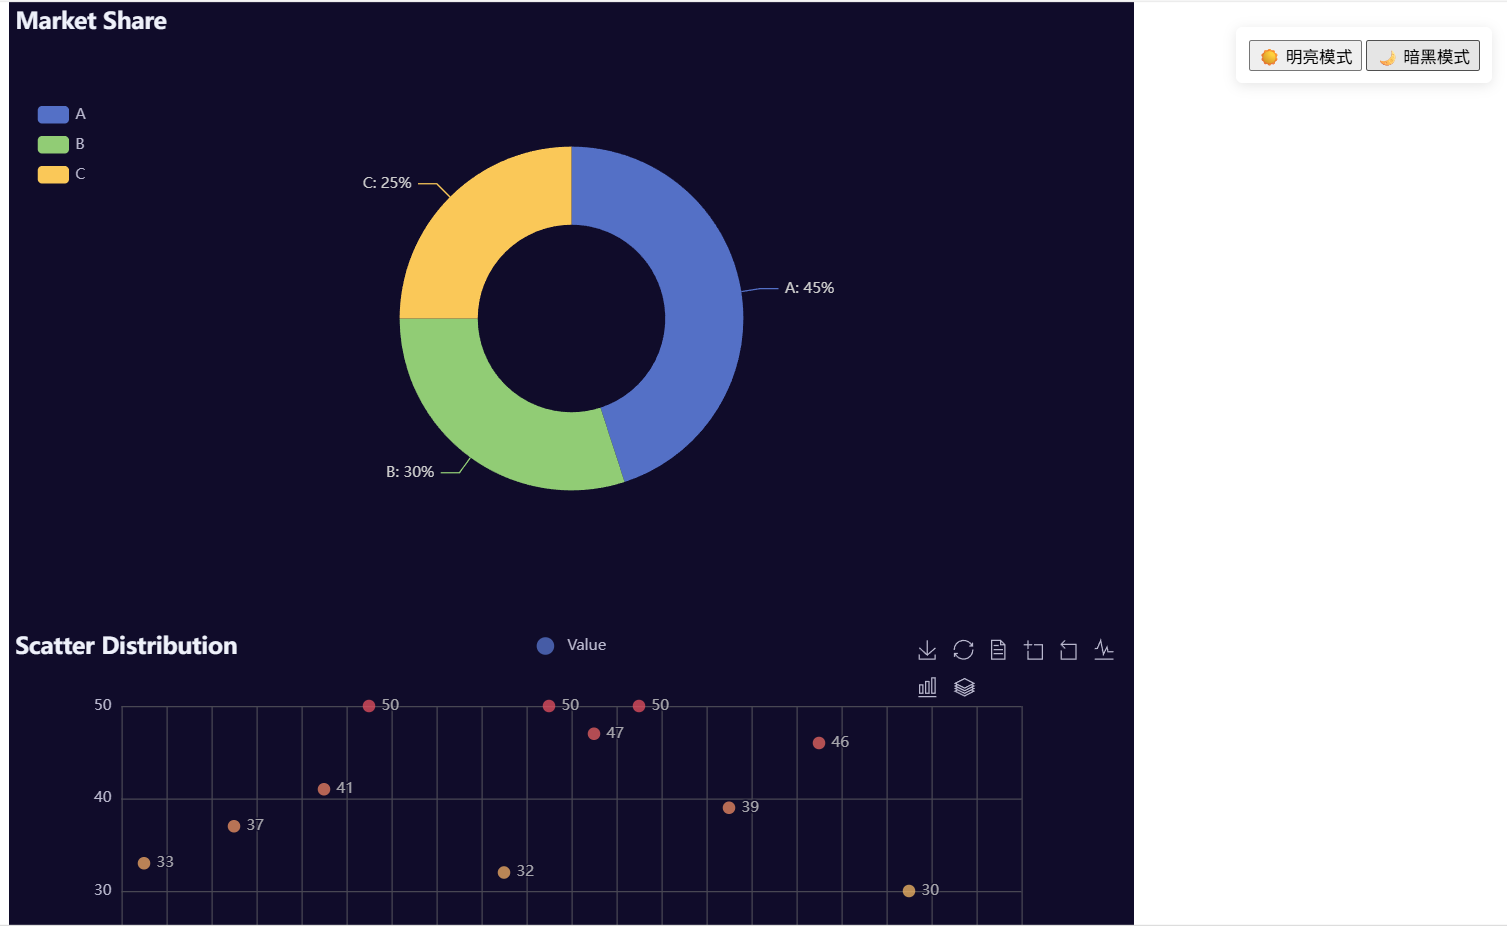
def insert_theme_switcher():
    """向生成的 HTML 中插入主题切换组件"""
    with open("dashboard.html", "r", encoding="utf-8") as f:
        html = f.read()

    insert_code = f"""
    <!-- 主题切换按钮 -->
    <div style="position: fixed; top: 20px; right: 20px; z-index: 9999; background: white; padding: 10px; border-radius: 5px; box-shadow: 0 2px 10px rgba(0,0,0,0.1);">
        <button onclick="changeTheme('light')">☀️ 明亮模式</button>
        <button onclick="changeTheme('dark')">🌙 暗黑模式</button>
    </div>
    <script>
    // 存储图表配置
    var chartConfigs = {{
        chart_line: {line.dump_options()},
        chart_bar: {bar.dump_options()},
        chart_pie: {pie.dump_options()},
        chart_scatter: {scatter.dump_options()}
    }};

    // 主题切换函数
    function changeTheme(theme) {{
        ['chart_line', 'chart_bar', 'chart_pie', 'chart_scatter'].forEach(chartId => {{
            let chart = echarts.getInstanceByDom(document.getElementById(chartId));
            if (chart) chart.dispose();
            let newChart = echarts.init(
                document.getElementById(chartId),
                theme,
                {{ renderer: 'canvas' }}
            );
            newChart.setOption(chartConfigs[chartId]);
        }});
    }}
    </script>
    """

    # 在 </body> 前插入代码
    new_html = html.replace("</body>", insert_code + "\n</body>")
    with open("dashboard.html", "w", encoding="utf-8") as f:
        f.write(new_html)

insert_theme_switcher()
print("仪表盘生成成功!打开 dashboard.html 查看效果")
HTML截图: