概述
我们使用 docker compose 来安装 ClickHouse
但我们不是裸装 ClickHouse,实际上我们安装的是 ClickStack。有点儿像 elastic-stack 与 elastic search 的关系 ,但并不完全一样。
ClickStack 是基于 ClickHouse 构建的完整观察性平台,集成了日志、指标、追踪和会话回放功能,提供统一的用户界面和查询能力。因此,ClickStack 是在 ClickHouse 的基础上,结合 HyperDX 提供的前端界面和 OpenTelemetry Collector 实现的完整解决方案。它不仅仅是一个数据库,而是一个集成的观察性平台。
安装步骤参考官方文档:clickhouse.com/docs/zh/use...
安装
克隆 HyperDX 仓库
bash
git clone https://github.com/hyperdxio/hyperdx.git

cd hyperdx

# switch to the v2 branch
git checkout v2
根据自身情况修改配置文件 .env
我将 HDX_IMAGE_REPO=docker.hyperdx.io 修改为 HDX_IMAGE_REPO=docker.io 不然镜像拉不下来
ini
# Used by docker-compose.yml
HDX_IMAGE_REPO=docker.hyperdx.io
IMAGE_NAME=ghcr.io/hyperdxio/hyperdx
IMAGE_NAME_DOCKERHUB=hyperdx/hyperdx
LOCAL_IMAGE_NAME=ghcr.io/hyperdxio/hyperdx-local
LOCAL_IMAGE_NAME_DOCKERHUB=hyperdx/hyperdx-local
ALL_IN_ONE_IMAGE_NAME=ghcr.io/hyperdxio/hyperdx-all-in-one
ALL_IN_ONE_IMAGE_NAME_DOCKERHUB=hyperdx/hyperdx-all-in-one
OTEL_COLLECTOR_IMAGE_NAME=ghcr.io/hyperdxio/hyperdx-otel-collector
OTEL_COLLECTOR_IMAGE_NAME_DOCKERHUB=hyperdx/hyperdx-otel-collector
CODE_VERSION=2.0.5
IMAGE_VERSION_SUB_TAG=.0.5
IMAGE_VERSION=2
IMAGE_NIGHTLY_TAG=2-nightly
IMAGE_LATEST_TAG=latest

# Set up domain URLs
HYPERDX_API_PORT=8000 #optional (should not be taken by other services)
HYPERDX_APP_PORT=8080
HYPERDX_APP_URL=http://localhost
HYPERDX_LOG_LEVEL=debug
HYPERDX_OPAMP_PORT=4320

# Otel/Clickhouse config
HYPERDX_OTEL_EXPORTER_CLICKHOUSE_DATABASE=default
docker compose 启动
docker-compose up -dDocker-compose 文件如下:
yaml
name: hdx-oss
services:
  # ONLY USED FOR DEMO SSL SETUP
  # nginx:
  #   image: nginx:1.27.3
  #   volumes:
  #     - ./docker/nginx/nginx.conf:/etc/nginx/nginx.conf
  #     - ./docker/nginx/ssl:/etc/nginx/ssl
  #     - .volumes/nginx_logs:/var/log/nginx
  #   ports:
  #     - 80:80
  #     - 443:443
  #   networks:
  #     - internal
  #   depends_on:
  #     - app
  db:
    image: mongo:5.0.14-focal
    volumes:
      - .volumes/db:/data/db
    # WARNING: Exposing the database port will make it accessible from outside the container,
    # potentially allowing unauthorized access. If you uncomment the ports below,
    # ensure to secure your database (e.g., with strong authentication, proper network rules, and firewalls).
    # ports:
    #   - 27017:27017
    networks:
      - internal
  otel-collector:
    image: ${HDX_IMAGE_REPO}/${OTEL_COLLECTOR_IMAGE_NAME_DOCKERHUB}:${IMAGE_VERSION}
    environment:
      CLICKHOUSE_ENDPOINT: 'tcp://ch-server:9000?dial_timeout=10s'
      HYPERDX_OTEL_EXPORTER_CLICKHOUSE_DATABASE: ${HYPERDX_OTEL_EXPORTER_CLICKHOUSE_DATABASE}
      HYPERDX_LOG_LEVEL: ${HYPERDX_LOG_LEVEL}
      OPAMP_SERVER_URL: 'http://app:${HYPERDX_OPAMP_PORT}'
    ports:
      - '13133:13133' # health_check extension
      - '24225:24225' # fluentd receiver
      - '4317:4317' # OTLP gRPC receiver
      - '4318:4318' # OTLP http receiver
      - '8888:8888' # metrics extension
    restart: always
    networks:
      - internal
    depends_on:
      - ch-server
  app:
    image: ${HDX_IMAGE_REPO}/${IMAGE_NAME_DOCKERHUB}:${IMAGE_VERSION}
    ports:
      - ${HYPERDX_API_PORT}:${HYPERDX_API_PORT}
      - ${HYPERDX_APP_PORT}:${HYPERDX_APP_PORT}
    environment:
      FRONTEND_URL: ${HYPERDX_APP_URL}:${HYPERDX_APP_PORT}
      HYPERDX_API_KEY: ${HYPERDX_API_KEY}
      HYPERDX_API_PORT: ${HYPERDX_API_PORT}
      HYPERDX_APP_PORT: ${HYPERDX_APP_PORT}
      HYPERDX_APP_URL: ${HYPERDX_APP_URL}
      HYPERDX_LOG_LEVEL: ${HYPERDX_LOG_LEVEL}
      MINER_API_URL: 'http://miner:5123'
      MONGO_URI: 'mongodb://db:27017/hyperdx'
      NEXT_PUBLIC_SERVER_URL: http://127.0.0.1:${HYPERDX_API_PORT}
      OPAMP_PORT: ${HYPERDX_OPAMP_PORT}
      OTEL_SERVICE_NAME: 'hdx-oss-api'
      USAGE_STATS_ENABLED: ${USAGE_STATS_ENABLED:-true}
      DEFAULT_CONNECTIONS:
        '[{"name":"Local
        ClickHouse","host":"http://ch-server:8123","username":"default","password":""}]'
      DEFAULT_SOURCES:
        '[{"from":{"databaseName":"default","tableName":"otel_logs"},"kind":"log","timestampValueExpression":"TimestampTime","name":"Logs","displayedTimestampValueExpression":"Timestamp","implicitColumnExpression":"Body","serviceNameExpression":"ServiceName","bodyExpression":"Body","eventAttributesExpression":"LogAttributes","resourceAttributesExpression":"ResourceAttributes","defaultTableSelectExpression":"Timestamp,ServiceName,SeverityText,Body","severityTextExpression":"SeverityText","traceIdExpression":"TraceId","spanIdExpression":"SpanId","connection":"Local
        ClickHouse","traceSourceId":"Traces","sessionSourceId":"Sessions","metricSourceId":"Metrics"},{"from":{"databaseName":"default","tableName":"otel_traces"},"kind":"trace","timestampValueExpression":"Timestamp","name":"Traces","displayedTimestampValueExpression":"Timestamp","implicitColumnExpression":"SpanName","serviceNameExpression":"ServiceName","bodyExpression":"SpanName","eventAttributesExpression":"SpanAttributes","resourceAttributesExpression":"ResourceAttributes","defaultTableSelectExpression":"Timestamp,ServiceName,StatusCode,round(Duration/1e6),SpanName","traceIdExpression":"TraceId","spanIdExpression":"SpanId","durationExpression":"Duration","durationPrecision":9,"parentSpanIdExpression":"ParentSpanId","spanNameExpression":"SpanName","spanKindExpression":"SpanKind","statusCodeExpression":"StatusCode","statusMessageExpression":"StatusMessage","connection":"Local
        ClickHouse","logSourceId":"Logs","sessionSourceId":"Sessions","metricSourceId":"Metrics"},{"from":{"databaseName":"default","tableName":""},"kind":"metric","timestampValueExpression":"TimeUnix","name":"Metrics","resourceAttributesExpression":"ResourceAttributes","metricTables":{"gauge":"otel_metrics_gauge","histogram":"otel_metrics_histogram","sum":"otel_metrics_sum","_id":"682586a8b1f81924e628e808","id":"682586a8b1f81924e628e808"},"connection":"Local
        ClickHouse","logSourceId":"Logs","traceSourceId":"Traces","sessionSourceId":"Sessions"},{"from":{"databaseName":"default","tableName":"hyperdx_sessions"},"kind":"session","timestampValueExpression":"TimestampTime","name":"Sessions","displayedTimestampValueExpression":"Timestamp","implicitColumnExpression":"Body","serviceNameExpression":"ServiceName","bodyExpression":"Body","eventAttributesExpression":"LogAttributes","resourceAttributesExpression":"ResourceAttributes","defaultTableSelectExpression":"Timestamp,ServiceName,SeverityText,Body","severityTextExpression":"SeverityText","traceIdExpression":"TraceId","spanIdExpression":"SpanId","connection":"Local
        ClickHouse","logSourceId":"Logs","traceSourceId":"Traces","metricSourceId":"Metrics"}]'
    networks:
      - internal
    depends_on:
      - ch-server
      - db
  ch-server:
    image: clickhouse/clickhouse-server:24-alpine
    # WARNING: Exposing the database port will make it accessible from outside the container,
    # potentially allowing unauthorized access. If you uncomment the ports below,
    # ensure to secure your database (e.g., with strong authentication, proper network rules, and firewalls).
    ports:
      - 8123:8123 # http api
      - 9050:9000 # native
    # environment:
      # default settings
      # CLICKHOUSE_DEFAULT_ACCESS_MANAGEMENT: 1
    volumes:
      - ./docker/clickhouse/local/config.xml:/etc/clickhouse-server/config.xml
      - ./docker/clickhouse/local/users.xml:/etc/clickhouse-server/users.xml
      - ./empty.xml:/etc/clickhouse-server/users.d/default-password.xml
      - .volumes/ch_data:/var/lib/clickhouse
      - .volumes/ch_logs:/var/log/clickhouse-server
    restart: on-failure
    networks:
      - internal
networks:
  internal:
注意:environment 部分我注释掉了,另外 加了一行:./empty.xml:/etc/clickhouse-server/users.d/default-password.xml 作用是解决 clickhouse 连接异常的问题。
通过 /data/clickhouse/hyperdx/docker/clickhouse/local/users.xml 可以看到 clickhouse 的账户信息:
xml
<?xml version="1.0"?>
<clickhouse>
    <profiles>
        <default>
            <max_memory_usage>10000000000</max_memory_usage>
            <use_uncompressed_cache>0</use_uncompressed_cache>
            <load_balancing>in_order</load_balancing>
            <log_queries>1</log_queries>
        </default>
    </profiles>

    <users>
        <default>
            <password_sha256_hex>2d964690ad5ac2d2f78bebadc30895bc519969ffcef4d3c9e7ff04ee1c765d96</password_sha256_hex>
            <profile>default</profile>
            <networks>
                <ip>::/0</ip>
            </networks>
            <quota>default</quota>
        </default>
        <api>
            <password>api</password>
            <profile>default</profile>
            <networks>
                <ip>::/0</ip>
            </networks>
            <quota>default</quota>
        </api>
        <worker>
            <password>worker</password>
            <profile>default</profile>
            <networks>
                <ip>::/0</ip>
            </networks>
            <quota>default</quota>
        </worker>
    </users>

    <quotas>
        <default>
            <interval>
                <duration>3600</duration>
                <queries>0</queries>
                <errors>0</errors>
                <result_rows>0</result_rows>
                <read_rows>0</read_rows>
                <execution_time>0</execution_time>
            </interval>
        </default>
    </quotas>
</clickhouse>
密码用 sha256sum 处理过
可以这样生成:
bash
echo -n '你的密码' | sha256sum运行
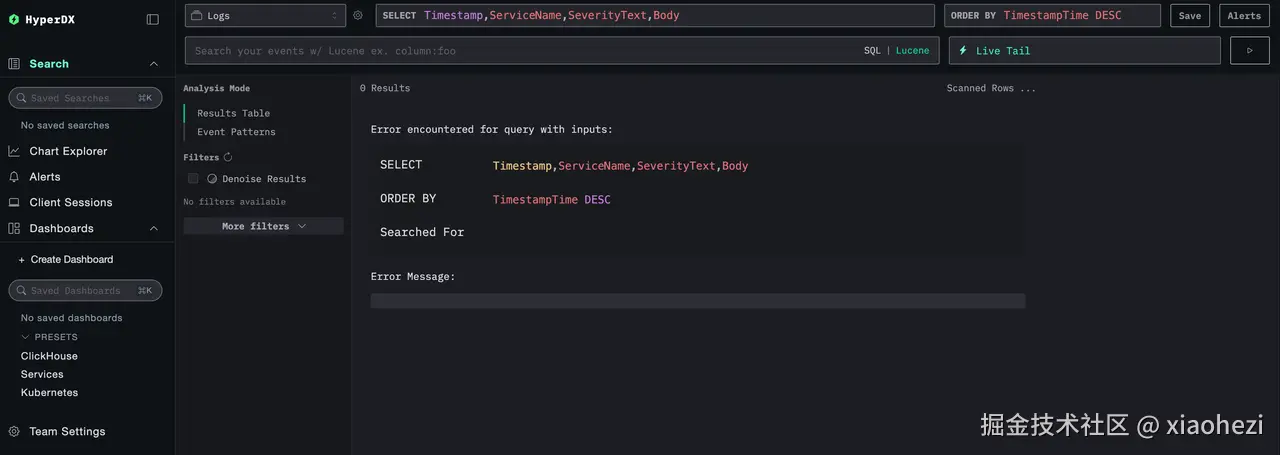
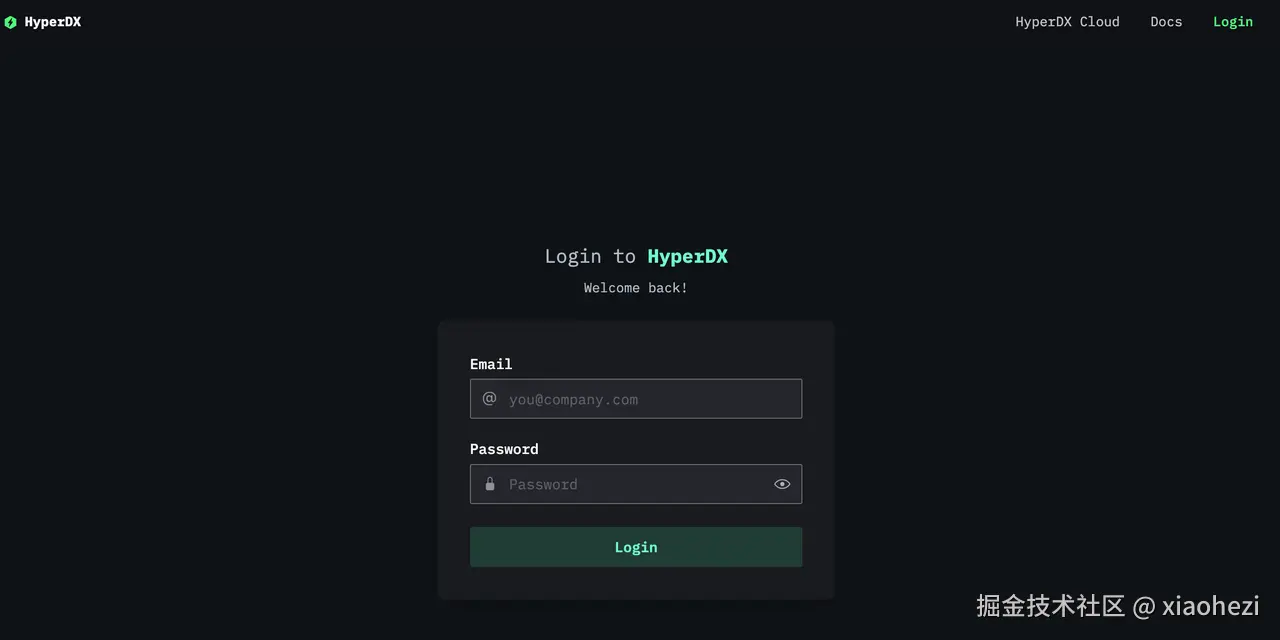 点击登录跳转至首页
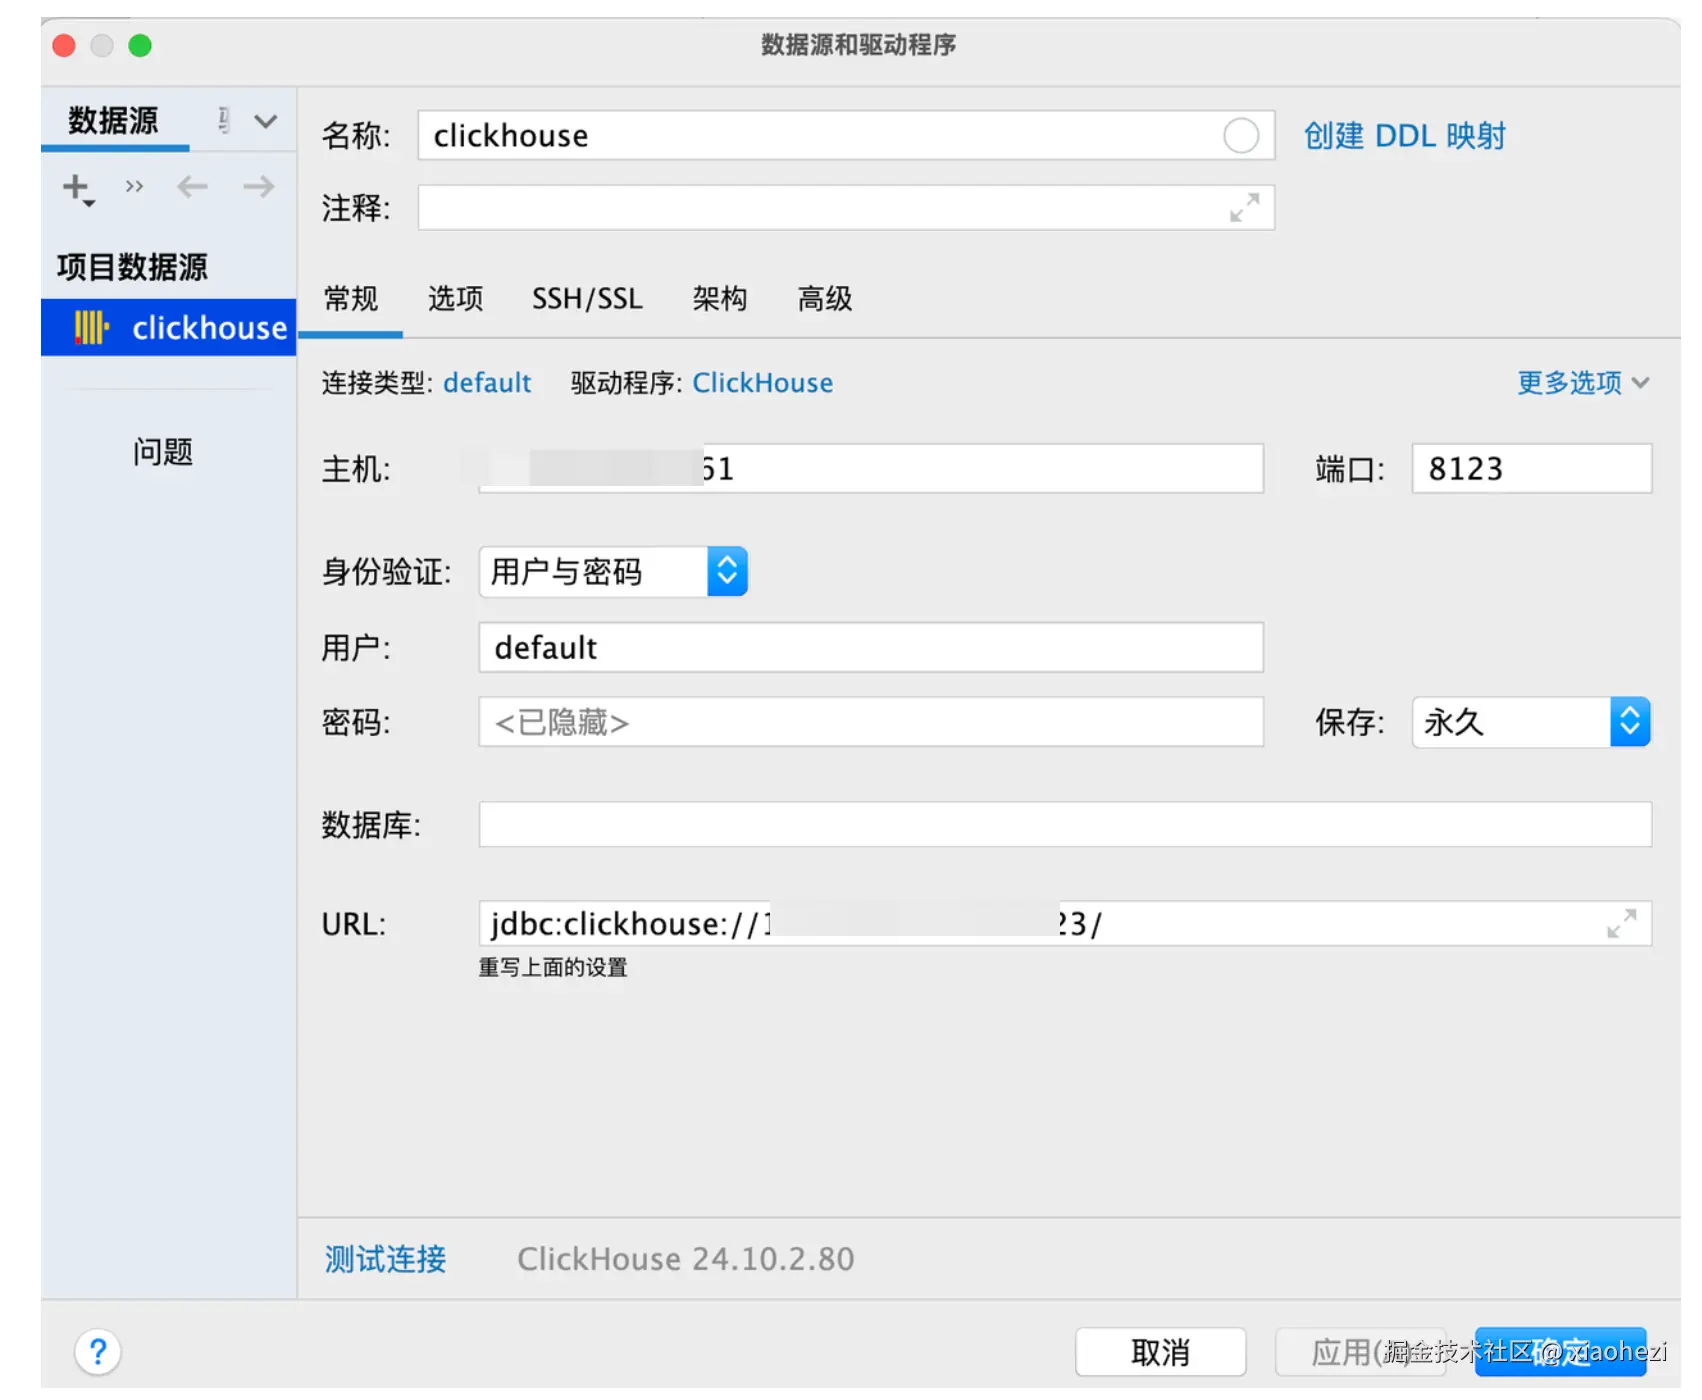
客户端连接
- 用户名:default
- 密码: 你的密码
- 端口:8123
数据库初始化
初始化 sql 脚本
sql
/* 1. 创建数据库(如已存在可先 DROP DATABASE IF EXISTS testdb) */
CREATE DATABASE IF NOT EXISTS testdb;

/* 2. 维度表:用户 */
CREATE TABLE IF NOT EXISTS testdb.users (
    user_id     UInt32,
    user_name   String,
    signup_date Date
) ENGINE = MergeTree
ORDER BY user_id;

/* 3. 维度表:页面 */
CREATE TABLE IF NOT EXISTS testdb.pages (
    page_id   UInt32,
    page_url  String,
    category  String
) ENGINE = MergeTree
ORDER BY page_id;

/* 4. 事实表:页面访问日志 */
CREATE TABLE IF NOT EXISTS testdb.pageviews (
    event_date Date,
    event_time DateTime,
    user_id    UInt32,
    page_id    UInt32,
    duration   UInt32   -- 停留秒数
) ENGINE = MergeTree
PARTITION BY toYYYYMM(event_date)
ORDER BY (event_date, user_id, page_id);

/* 5. 物化视图:每日 PV / UV 聚合 */
CREATE MATERIALIZED VIEW IF NOT EXISTS testdb.pv_uv_daily
ENGINE = SummingMergeTree
PARTITION BY toYYYYMM(event_date)
ORDER BY event_date
AS
SELECT
    event_date,
    count()               AS pv,
    uniqExact(user_id)    AS uv
FROM testdb.pageviews
GROUP BY event_date;

/* 6. 演示数据插入 ---------------------------------------- */

/* 用户维度 */
INSERT INTO testdb.users (user_id, user_name, signup_date) VALUES
    (1, 'Alice', '2024-06-01'),
    (2, 'Bob',   '2024-07-15'),
    (3, 'Cathy', '2024-11-30');

/* 页面维度 */
INSERT INTO testdb.pages (page_id, page_url, category) VALUES
    (10, '/home',    'landing'),
    (11, '/pricing', 'info'),
    (12, '/blog',    'content');

/* 页面访问日志 */
INSERT INTO testdb.pageviews (event_date, event_time, user_id, page_id, duration) VALUES
    ('2025-07-13', '2025-07-13 09:17:00', 1, 10, 35),
    ('2025-07-13', '2025-07-13 09:18:07', 1, 11, 50),
    ('2025-07-13', '2025-07-13 09:19:02', 2, 10, 15),
    ('2025-07-14', '2025-07-14 10:03:45', 3, 12, 120),
    ('2025-07-14', '2025-07-14 10:05:22', 1, 12, 90);

/* 7. 快速验证 --------------------------------------------- */

/* 查看当前数据库已创建的表 */
SHOW TABLES FROM testdb;

/* 查询物化视图结果 */
SELECT * FROM testdb.pv_uv_daily ORDER BY event_date;

/* 联表查询示例 */
SELECT
    u.user_name,
    p.page_url,
    v.event_time,
    v.duration
FROM testdb.pageviews AS v
LEFT JOIN testdb.users  AS u ON v.user_id = u.user_id
LEFT JOIN testdb.pages  AS p ON v.page_id = p.page_id
ORDER BY v.event_time DESC;