背景
要使用高德地图在中国地图上标注出业务点(大概2000-3000个)。一开始,我们用的mock数据,界面没有卡死。后续我们接入了接口数据,发现界面卡死。此时,地图上要标注的点已经有2000-3000个。
因此,我在下面列出了两种方案和相关源代码。
方案一:遍历数据,使用marker直接渲染。(造成卡顿)
方案二:使用LabelsLayer(标注图层)和LabelMarker(标注)渲染。(轻松渲染2000-3000个数据点)
注意:高德地图版本我们使用的是1.4.15,在标点时,地图的viewMode为2D时标注建议在 3000 点内,viewMode为3D标注建议在 30000 点内。
方案一:遍历数据,使用marker直接渲染的方法
- vue文件如下
js
 <template>
  <div class="static-china-content">
    <div class="static-result-content-wrapper">
      <div class="static-result-right">
        <div ref="amap" class="amap-inner" style="height: 100%"></div>
      </div>
    </div>
  </div>
</template>

<script>
import testJson from "./test.json"; // 这里是点的数据
import mapMarkers1 from "@/assets/statistic-red-map.png"; // 这里使用的打点的图片
export default {
  name: "MapDemo",
  data() {
    return {
      markerList: [],
      amap: null,
      styleName: "amap://styles/e925346429e081692612c396263b6ce6",
      colors: ["#FF0303", "#FE6F14", "#FFC000", "#205AEC", "#008000"],
      mapMarkers: mapMarkers1,
    };
  },
  mounted() {
      // 这里链接里的key值要换成自己的
    this.loadScript(
      "https://webapi.amap.com/maps?v=1.4.15&key=xxxxxx&plugin=AMap.Scale,AMap.OverView,AMap.ToolBar",
      () => {
        this.initAmap();
        this.handleSearch();
      }
    );
  },
  methods: {
      // 加载地图工具函数
    loadScript(src, callback) {
      // 在你的 Vue 组件或 utils 文件夹中创建 loadScript 函数
      // 检查是否已经存在该脚本
      if (document.querySelector(`script[src="${src}"]`)) {
        callback && callback();
        return;
      }

      // 创建 script 标签
      const script = document.createElement("script");
      script.type = "text/javascript";
      script.src = src;

      // 添加错误处理
      script.onerror = () => {
        console.error(`Failed to load script: ${src}`);
        callback && callback(new Error("Script load failed"));
      };

      // 确保在加载完成后调用回调函数
      script.onload = () => {
        console.log(`Script loaded successfully: ${src}`);
        callback && callback(null);
      };

      // 将 script 标签添加到 head 中
      document.head.appendChild(script);
    },
    openInfo(item, position) {
      //构建信息窗体中显示的内容
      let list = `<ul><li><label>发布时间:</label><span>${item?.createTime}</span></li></ul>`;
      var content = `<div class="statistic-station-info">${list}</div>`;

      const infoWindow = new AMap.InfoWindow({
        content: content,
        offset: new AMap.Pixel(0, 0),
        retainWhenClose: true,
      });

      infoWindow.open(this.amap, position);
    },
    // 初始化高德地图
    initAmap() {
      let map = this.$refs.amap;

      this.amap = new AMap.Map(map, {
        // center: [this.longitude, this.latitude],
        zoom: 4, //地图级别
        //  mapStyle: this.styleName, //设置地图的显示样式
        viewMode: "2D", //设置地图模式
        lang: "zh_cn", //设置地图语言类型
        resizeEnable: true,
        showBuildingBlock: false,
        layers: [new AMap.TileLayer.Satellite()],
        // features: ["bg", "road", "admin", "water"],
      });
    },
    setMarker(item) {
      let marker = new AMap.Marker({
        icon: new AMap.Icon({
          image: this.mapMarkers,
          size: new AMap.Size(12, 13), //图标所处区域大小
          imageSize: new AMap.Size(12, 13), //图标大小
        }),
        position: new AMap.LngLat(item.eventLongitude, item.eventLatitude),
        // position: new AMap.LngLat(116.39, 39.9), // 经纬度对象,也可以是经纬度构成的一维数组[116.39, 39.9]
      });

      marker.on("click", () =>
        this.openInfo(item, [item.eventLongitude, item.eventLatitude])
      );

      // 将创建的点标记添加到已有的地图实例:
      this.amap.add(marker);
    },
    async handleSearch() {
      this.tableData = testJson?.dataset?.datas;
      this.tableData?.MapData.forEach((item) => this.setMarker(item));
      // this.setLabelsLayer(this.tableData?.MapData);
      this.amap.setFitView();
    }
  },
};
</script>

<style lang="less" scoped>
.static-result-right {
  width: 800px;
  height: 800px;
  .amap-inner {
    width: 100%;
    height: 100%;
  }
}
</style>
2.test.json数据如下
test.json
{
  "success": true,
  "dataset": {
    "datas": {
      "MapData": [
        {
          "eventLatitude": 29.3243,
          "eventLongitude": 114.4567,
        }
      ]
   }
 }
}
但是,可以看到当我们的点过多时,页面就会卡顿,甚至卡死。所以面对点多的情况,我们下面使用方案二。
方案二:遍历数据,使用marker直接渲染的方法
1.test.json文件此处省略,该文件中地图的点有14000+个。 2.vue文件
js
<template>
<div class="static-china-content">
<div class="static-result-content-wrapper">
<div class="static-result-right">
<div ref="amap" class="amap-inner" style="height: 100%"></div>
</div>
</div>
</div>
</template>
<script>
import testJson from "./test.json"; // 这里是点数据
import mapMarkers1 from "@/assets/statistic-red-map.png";
export default {
name: "MapDemo",
data() {
return {
markerList: [],
amap: null,
styleName: "amap://styles/e925346429e081692612c396263b6ce6",
colors: ["#FF0303", "#FE6F14", "#FFC000", "#205AEC", "#008000"],
mapMarkers: mapMarkers1,
};
},
mounted() {
// 这里链接里的key值要换成自己的
this.loadScript(
"https://webapi.amap.com/maps?v=1.4.15&key=xxxxxx&plugin=AMap.Scale,AMap.OverView,AMap.ToolBar",
() => {
this.initAmap();
this.handleSearch();
}
);
},
methods: {
loadScript(src, callback) {
// 在你的 Vue 组件或 utils 文件夹中创建 loadScript 函数
// 检查是否已经存在该脚本
if (document.querySelector(`script[src="${src}"]`)) {
callback && callback();
return;
}
// 创建 script 标签
const script = document.createElement("script");
script.type = "text/javascript";
script.src = src;
// 添加错误处理
script.onerror = () => {
console.error(`Failed to load script: ${src}`);
callback && callback(new Error("Script load failed"));
};
// 确保在加载完成后调用回调函数
script.onload = () => {
console.log(`Script loaded successfully: ${src}`);
callback && callback(null);
};
// 将 script 标签添加到 head 中
document.head.appendChild(script);
},
openInfo(item, position) {
//构建信息窗体中显示的内容
let list = `<ul>
<li><label>发布时间:</label><span>${item?.createTime}</span></li></ul>`;
var content = `<div class="statistic-station-info">
${list}
</div>`;
const infoWindow = new AMap.InfoWindow({
content: content,
offset: new AMap.Pixel(0, 0),
retainWhenClose: true,
});
infoWindow.open(this.amap, position);
},
// 初始化高德地图
initAmap() {
let map = this.$refs.amap;
this.amap = new AMap.Map(map, {
// center: [this.longitude, this.latitude],
zoom: 4, //地图级别
// mapStyle: this.styleName, //设置地图的显示样式
viewMode: "2D", //设置地图模式
lang: "zh_cn", //设置地图语言类型
resizeEnable: true,
showBuildingBlock: false,
layers: [new AMap.TileLayer.Satellite()],
});
},
async handleSearch() {
this.tableData = testJson?.dataset?.datas;
this.setLabelsLayer(this.tableData?.MapData);
this.amap.setFitView();
},
setLabelsLayer(positions) {
const markers = [];
// 创建 AMap.LabelsLayer 图层
const layer = new AMap.LabelsLayer({
zooms: [3, 20],
zIndex: 111,
// 关闭标注避让,默认为开启,v1.4.15 新增属性
animation: false,
// 关闭标注淡入动画,默认为开启,v1.4.15 新增属性
collision: false,
});
// 将图层添加到地图
this.amap.add(layer);
for (let i = 0; i < positions.length; i++) {
const curPosition = positions[i];
var icon = {
type: "image",
image: this.mapMarkers,
size: [6, 9],
anchor: "bottom-center",
angel: 0,
retina: true,
};
if (!curPosition?.eventLatitude || !curPosition?.eventLongitude) {
continue;
}
const curData = {
position: [curPosition?.eventLongitude, curPosition?.eventLatitude],
icon,
offset: new AMap.Pixel(-6, -13),
};
const labelMarker = new AMap.LabelMarker(curData);
// 事件
labelMarker.on("click", () =>
this.openInfo(curPosition, labelMarker.getPosition())
);
markers.push(labelMarker);
}
// 一次性将海量点添加到图层
layer.add(markers);
},
},
};
</script>
<style lang="less" scoped>
.static-result-right {
width: 800px;
height: 800px;
.amap-inner {
width: 100%;
height: 100%;
}
}
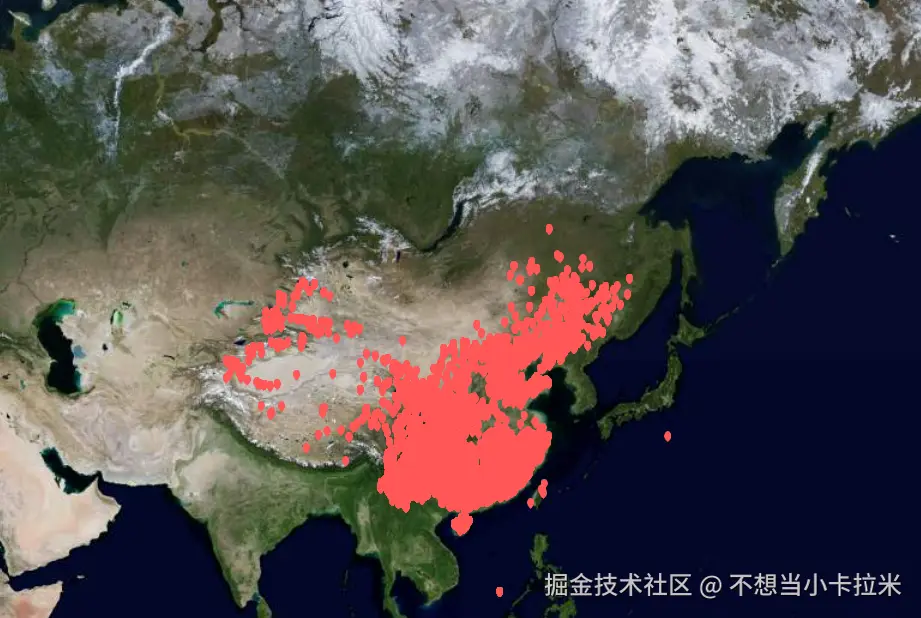
</style>此时,地图上展示14000+个点是没有什么压力的。
写在最后
文章对比了两种针对海量数据打点在高德地图上展示的方案,对比过后,方案二更适合数据点多时的情况。
文章中使用的高德地图的版本是1.4.15。
文章参考链接:# 标注和标注图层-海量点