在qt中我们常常会使用数据来绘制曲线,常用的的绘制方法用QCutomPlot、QChart和QPrinter。有时我们会根据需要在曲线进行二次绘制,包括对曲线打标签,显示某个点的值等功能。本文主要为大家介绍在QCustomPlot中使用QCPItemTracer和QCPItemText绘制跟随鼠标移动标签和鼠标双击标签线条。
在图表中常使用到自动跟随鼠标显示曲线当前的值。
1、下面将介绍说明使用QCustomPlot绘制标签跟随鼠标移动标签。
第一步:创建一个空白的Qwidget并提升为QCustomPlot,并按照个人喜好初始化QCustomPlot设置对应的绘制样式。
第二步:初始化需要显示到QCustomPlot上标签对象,本文主要使用QCPItemTracer绘制标签和使用QCPItemText绘制标签文本。
第三步:准备一组曲线数据,并将数据绘制到QCustomPlot中。
第四步:绑定鼠标移动事件,移动鼠标,观察效果。
说太多,也懒得写了,老规则,直接上代码(代码只提供主要函数哦,有问题请私聊我哟)。
cpp
QCPItemTracer *tracer = nullptr;
QCPItemText *tracerLabel = nullptr;
QCPGraph *tracerGraph;
/***************************************************
* @brief: QCustomPlot初始化
* @param: customPlot-指定对象
* @return : 无
* @author :鬼魅
* @date :2025-7-29 9:48:38
***************************************************/
void QCustomPlotWidgetInit(QCustomPlot* customPlot)
{
//设置默认追踪鼠标,否则在触发鼠标移动时,必须先点一下才有效
this->setMouseTracking(true);
customPlot->setMouseTracking(true);
//信号-槽连接语句
bool ret1 = connect(customPlot, SIGNAL(mouseDoubleClick(QMouseEvent*)), this, SLOT(mouseDoubleClick(QMouseEvent*)));
//信号-槽连接语句
bool ret = connect(customPlot, SIGNAL(mouseMove(QMouseEvent*)), this, SLOT(mouseMoveEventSlot(QMouseEvent*)));
customPlot->clearGraphs();
QLinearGradient plotGradient;
plotGradient.setColorAt(0, QColor(241, 245, 252));
customPlot->setBackground(plotGradient); // 设置背景颜色
QList<QPen> str = { QPen(QColor(22,192,130)), QPen(QColor(50,90,208)), QPen(QColor(6,190,244)) ,QPen(QColor(136,122,242)), QPen(Qt::yellow) };
QList<QBrush> strColor = { QBrush(QColor(0, 0, 255, 150)), QBrush(QColor(255, 255, 0, 150)), QBrush(QColor(255, 150, 0, 150)) };
customPlot->addGraph();
customPlot->graph(0)->setPen(str[0]); // 第一个图的线条颜色为蓝色
customPlot->graph(0)->setSmooth(true);//添加平滑曲线
customPlot->legend->setVisible(true);//显示图标
customPlot->legend->setBorderPen(Qt::NoPen);//隐藏图标边框
customPlot->legend->setBrush(QColor(255, 255, 255, 150));//设置图标灰色透明
customPlot->legend->setTextColor(Qt::black);//设置图例文字颜色
customPlot->legend->setFont(QFont("Helvetica", 10));//设置图标字体
customPlot->legend->setMargins(QMargins(0, 0, 0, 0));//设置图标中图形与文字到边框距离
customPlot->axisRect(0)->insetLayout()->setInsetAlignment(0, Qt::AlignTop | Qt::AlignRight);//设置图列居中
customPlot->axisRect(0)->setBackground(QColor(255, 255, 255));//设置背景为黑色
customPlot->xAxis->setTickLabelColor(Qt::black);//设置x轴文本颜色
customPlot->xAxis->setBasePen(QPen(Qt::black));//设置x轴颜色
customPlot->xAxis->setTickPen(QPen(Qt::black));
customPlot->xAxis->setSubTickPen(QPen(Qt::black));
customPlot->xAxis->grid()->setVisible(true);
customPlot->xAxis->setSubTickLengthIn(0); // 轴线内子刻度的长度
customPlot->yAxis->setTickLabelColor(Qt::black);//设置y轴文本颜色
customPlot->yAxis->setBasePen(QPen(Qt::black));//设置y轴颜色
customPlot->yAxis->setTickPen(QPen(Qt::black));
customPlot->yAxis->setSubTickPen(QPen(Qt::black));
customPlot->yAxis->grid()->setVisible(true);
// 使左轴和底轴的范围始终转移到右轴和顶轴
connect(customPlot->xAxis, SIGNAL(rangeChanged(QCPRange)), customPlot->xAxis2, SLOT(setRange(QCPRange)));
connect(customPlot->yAxis, SIGNAL(rangeChanged(QCPRange)), customPlot->yAxis2, SLOT(setRange(QCPRange)));
//设置横坐标为时间格式
QSharedPointer<QCPAxisTickerTime> timeTicker(new QCPAxisTickerTime);
timeTicker->setTimeFormat("%h:%m:%s");
timeTicker->setTickCount(10);
customPlot->xAxis->setTicker(timeTicker);
customPlot->xAxis->setTickLabelRotation(0);//设置x轴时间旋转角度为30度
customPlot->xAxis->setVisible(true);
customPlot->graph(0)->rescaleAxes(true);
customPlot->setInteractions(QCP::iRangeDrag | QCP::iRangeZoom | QCP::iSelectPlottables);
customPlot->setStyleSheet("background:#f1f5fc;");
customPlot->replot();
customPlot->layout()->update();
customPlot->show();
}
/***************************************************
* @brief: QCustomPlotLabel初始化
* @param: customPlot-指定对象
* @return : 无
* @author :鬼魅
* @date :2025-7-29 9:48:38
***************************************************/
void QCustomPloLabelInit(QCustomPlot* customPlot)
{
//生成游标
if (tracer)
{
tracer = nullptr;
}
tracer = new QCPItemTracer(customPlot); //生成游标
tracer->setPen(QPen(Qt::red));//圆圈轮廓颜色
tracer->setBrush(QBrush(Qt::red));//圆圈圈内颜色
tracer->setStyle(QCPItemTracer::tsCircle);//圆圈
tracer->setSize(10);//设置大小
tracer->setVisible(false);
//游标说明
if (tracerLabel)
{
tracerLabel = nullptr;
}
tracerLabel = new QCPItemText(customPlot); //生成游标说明
tracerLabel->setLayer("overlay");//设置图层为overlay,因为需要频繁刷新
//tracerLabel->setPen(QPen(Qt::red, Qt::NoPen));//设置游标说明颜色
tracerLabel->setColor(Qt::red);
tracerLabel->setBrush(Qt::NoBrush);
tracerLabel->setPositionAlignment(Qt::AlignLeft | Qt::AlignTop);//左上
tracerLabel->position->setParentAnchor(tracer->position);//将游标说明锚固在tracer位置处,实现自动跟随
tracerLabel->setVisible(false);
}
/***************************************************
* @brief: QCustomPlot绘制曲线
* @param: customPlot-指定对象;data-数据;key-关键字
* @return : 无
* @author :鬼魅
* @date :2025-7-29 9:48:38
***************************************************/
void QCustomPlotWidgetShow(QCustomPlot* customPlot, QMap<int, QStringList> data, QString key)
{
if (!customPlot || data.isEmpty()) return;
QVector<double> x1, y1;
double min = -10, max = 10;
int index = -1;
for (int i = 0; i < data.first().size(); i++)
{
if (data.first()[i] == key)
{
index = i; break;
}
}
if (index == -1) return; // 未找到key
for (int i = 1; i < data.size(); i++)
{
x1.push_back(i);
y1.push_back(data[i][index].toDouble());
max = qMax(max, y1.last());
min = qMin(min, y1.last());
}
if (min == 0) { min = -max; }
if (x1.isEmpty() || y1.isEmpty()) return;
customPlot->xAxis->setRange(x1.first(), x1.last());
customPlot->yAxis->setRange(min*1.5, max*1.5);
customPlot->graph(0)->setData(x1, y1);
customPlot->graph(0)->setName(key);
customPlot->replot();
}
/***************************************************
* @brief: 鼠标移动事件函数
* @param: event-鼠标对象
* @return : 无
* @author :鬼魅
* @date :2025-7-29 9:48:38
***************************************************/
void mouseMoveEventSlot(QMouseEvent *event)
{
if (ui.widget_alarmData->underMouse())
{
tracer->setVisible(true);
tracerLabel->setVisible(true);
}
else
{
tracer->setVisible(false);
tracerLabel->setVisible(false);
}
if (ui.widget_alarmData->graphCount() <= 0)
{
return;
}
else
{
tracerGraph = ui.widget_alarmData->graph(0);
tracer->setGraph(tracerGraph);
}
if (tracer == nullptr)
{
return;
}
if (tracer->graph() == nullptr)
{
return;
}
if (tracer->visible())
{
if (tracerGraph)
{
double x = ui.widget_alarmData->xAxis->pixelToCoord(event->pos().x());
tracer->setGraphKey(x); //将游标横坐标设置成刚获得的横坐标数据x
tracer->setInterpolating(true); //自动计算y值,若只想看已有点,不需要这个
tracer->updatePosition(); //使得刚设置游标的横纵坐标位置生效
tracerLabel->setText(QString("time-%1\nvalue-%2").arg(QTime(0, 0, 0).addSecs(int(tracer->position->key())).toString(QString::fromLatin1("HH:mm:ss"))).arg(tracer->position->value()));
ui.widget_alarmData->replot(QCustomPlot::rpQueuedReplot);
}
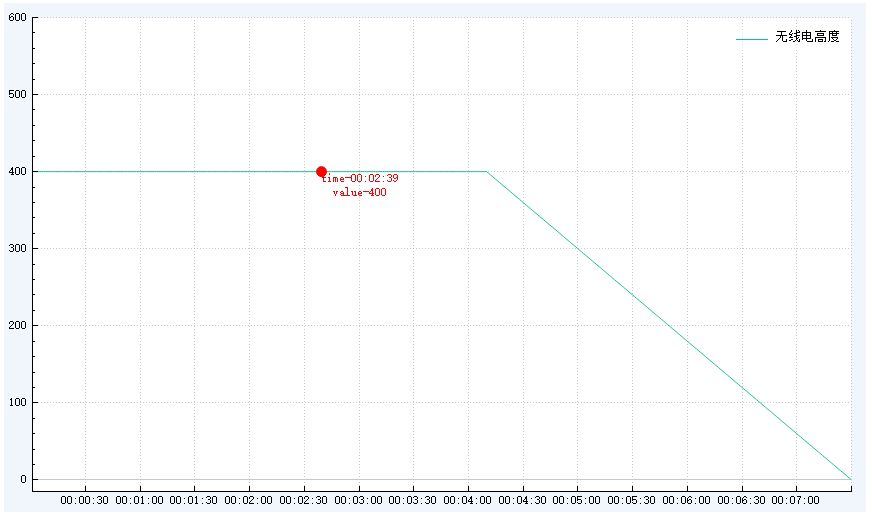
}
}鼠标跟踪自动显示效果图如下所示:
2、下面再提供在QCustomPlot上双击鼠标进行打标签的方法:
大致步骤和上面跟随鼠标移动打标签差不多,还是话不多说,直接上代码(代码只提供主要函数哦,有问题请私聊我哟)
cpp
QCPItemStraightLine *vline_start = nullptr, *vline_end = nullptr;
QCPItemText *m_currentLabel_start = nullptr,*m_currentLabel_end = nullptr;
QTime startTime, stopTime;
/***************************************************
* @brief: QCustomPlot初始化
* @param: customPlot-指定对象
* @return : 无
* @author :鬼魅
* @date :2025-7-29 9:48:38
***************************************************/
void QCustomPlotWidgetInit(QCustomPlot* customPlot)
{
//设置默认追踪鼠标,否则在触发鼠标移动时,必须先点一下才有效
this->setMouseTracking(true);
customPlot->setMouseTracking(true);
//信号-槽连接语句
bool ret1 = connect(customPlot, SIGNAL(mouseDoubleClick(QMouseEvent*)), this, SLOT(mouseDoubleClick(QMouseEvent*)));
//信号-槽连接语句
bool ret = connect(customPlot, SIGNAL(mouseMove(QMouseEvent*)), this, SLOT(mouseMoveEventSlot(QMouseEvent*)));
customPlot->clearGraphs();
QLinearGradient plotGradient;
plotGradient.setColorAt(0, QColor(241, 245, 252));
customPlot->setBackground(plotGradient); // 设置背景颜色
QList<QPen> str = { QPen(QColor(22,192,130)), QPen(QColor(50,90,208)), QPen(QColor(6,190,244)) ,QPen(QColor(136,122,242)), QPen(Qt::yellow) };
QList<QBrush> strColor = { QBrush(QColor(0, 0, 255, 150)), QBrush(QColor(255, 255, 0, 150)), QBrush(QColor(255, 150, 0, 150)) };
customPlot->addGraph();
customPlot->graph(0)->setPen(str[0]); // 第一个图的线条颜色为蓝色
customPlot->graph(0)->setSmooth(true);//添加平滑曲线
customPlot->legend->setVisible(true);//显示图标
customPlot->legend->setBorderPen(Qt::NoPen);//隐藏图标边框
customPlot->legend->setBrush(QColor(255, 255, 255, 150));//设置图标灰色透明
customPlot->legend->setTextColor(Qt::black);//设置图例文字颜色
customPlot->legend->setFont(QFont("Helvetica", 10));//设置图标字体
customPlot->legend->setMargins(QMargins(0, 0, 0, 0));//设置图标中图形与文字到边框距离
customPlot->axisRect(0)->insetLayout()->setInsetAlignment(0, Qt::AlignTop | Qt::AlignRight);//设置图列居中
customPlot->axisRect(0)->setBackground(QColor(255, 255, 255));//设置背景为黑色
customPlot->xAxis->setTickLabelColor(Qt::black);//设置x轴文本颜色
customPlot->xAxis->setBasePen(QPen(Qt::black));//设置x轴颜色
customPlot->xAxis->setTickPen(QPen(Qt::black));
customPlot->xAxis->setSubTickPen(QPen(Qt::black));
customPlot->xAxis->grid()->setVisible(true);
customPlot->xAxis->setSubTickLengthIn(0); // 轴线内子刻度的长度
customPlot->yAxis->setTickLabelColor(Qt::black);//设置y轴文本颜色
customPlot->yAxis->setBasePen(QPen(Qt::black));//设置y轴颜色
customPlot->yAxis->setTickPen(QPen(Qt::black));
customPlot->yAxis->setSubTickPen(QPen(Qt::black));
customPlot->yAxis->grid()->setVisible(true);
// 使左轴和底轴的范围始终转移到右轴和顶轴
connect(customPlot->xAxis, SIGNAL(rangeChanged(QCPRange)), customPlot->xAxis2, SLOT(setRange(QCPRange)));
connect(customPlot->yAxis, SIGNAL(rangeChanged(QCPRange)), customPlot->yAxis2, SLOT(setRange(QCPRange)));
//设置横坐标为时间格式
QSharedPointer<QCPAxisTickerTime> timeTicker(new QCPAxisTickerTime);
timeTicker->setTimeFormat("%h:%m:%s");
timeTicker->setTickCount(10);
customPlot->xAxis->setTicker(timeTicker);
customPlot->xAxis->setTickLabelRotation(0);//设置x轴时间旋转角度为30度
customPlot->xAxis->setVisible(true);
customPlot->graph(0)->rescaleAxes(true);
customPlot->setInteractions(QCP::iRangeDrag | QCP::iRangeZoom | QCP::iSelectPlottables);
customPlot->setStyleSheet("background:#f1f5fc;");
customPlot->replot();
customPlot->layout()->update();
customPlot->show();
}
/***************************************************
* @brief: QCustomPlotLabel初始化
* @param: customPlot-指定对象
* @return : 无
* @author :鬼魅
* @date :2025-7-29 9:48:38
***************************************************/
void QCustomPlotMarkLineInit(QCustomPlot* customPlot)
{
if (vline_start)
{
vline_start = nullptr;
}
// 设置游标垂直线
vline_start = new QCPItemStraightLine(customPlot);
vline_start->setLayer("overlay");
// 超出坐标轴范围则不显示游标线
vline_start->setClipToAxisRect(false);
// 颜色随机
vline_start->setPen(QPen(Qt::green, 1, Qt::DashLine));
vline_start->setVisible(false);
if (vline_end)
{
vline_end = nullptr;
}
// 设置游标垂直线
vline_end = new QCPItemStraightLine(customPlot);
vline_end->setLayer("overlay");
// 超出坐标轴范围则不显示游标线
vline_end->setClipToAxisRect(false);
// 颜色随机
vline_end->setPen(QPen(Qt::blue, 1, Qt::DashLine));
vline_end->setVisible(false);
if (m_currentLabel_start)
{
m_currentLabel_start = nullptr;
}
// 设置文本框
m_currentLabel_start = new QCPItemText(customPlot);
m_currentLabel_start->setLayer("overlay");
// 超出坐标轴范围则不显示标签
m_currentLabel_start->setClipToAxisRect(true);
m_currentLabel_start->setPadding(QMargins(3, 3, 3, 3));
m_currentLabel_start->setPen(QPen(QColor(130, 130, 130), 0, Qt::DotLine));
m_currentLabel_start->setBrush(Qt::NoBrush);
m_currentLabel_start->setFont(QFont("Arial", 8));
m_currentLabel_start->setColor(Qt::green);
m_currentLabel_start->setVisible(false);
if (m_currentLabel_end)
{
m_currentLabel_end = nullptr;
}
// 设置文本框
m_currentLabel_end = new QCPItemText(customPlot);
m_currentLabel_end->setLayer("overlay");
// 超出坐标轴范围则不显示标签
m_currentLabel_end->setClipToAxisRect(true);
m_currentLabel_end->setPadding(QMargins(3, 3, 3, 3));
m_currentLabel_end->setPen(QPen(QColor(130, 130, 130), 0, Qt::DotLine));
m_currentLabel_end->setBrush(Qt::NoBrush);
m_currentLabel_end->setFont(QFont("Arial", 8));
m_currentLabel_end->setColor(Qt::blue);
m_currentLabel_end->setVisible(false);
}
/***************************************************
* @brief: QCustomPlot绘制曲线
* @param: customPlot-指定对象;data-数据;key-关键字
* @return : 无
* @author :鬼魅
* @date :2025-7-29 9:48:38
***************************************************/
void QCustomPlotWidgetShow(QCustomPlot* customPlot, QMap<int, QStringList> data, QString key)
{
if (!customPlot || data.isEmpty()) return;
QVector<double> x1, y1;
double min = -10, max = 10;
int index = -1;
for (int i = 0; i < data.first().size(); i++)
{
if (data.first()[i] == key)
{
index = i; break;
}
}
if (index == -1) return; // 未找到key
for (int i = 1; i < data.size(); i++)
{
x1.push_back(i);
y1.push_back(data[i][index].toDouble());
max = qMax(max, y1.last());
min = qMin(min, y1.last());
}
if (min == 0) { min = -max; }
if (x1.isEmpty() || y1.isEmpty()) return;
customPlot->xAxis->setRange(x1.first(), x1.last());
customPlot->yAxis->setRange(min*1.5, max*1.5);
customPlot->graph(0)->setData(x1, y1);
customPlot->graph(0)->setName(key);
customPlot->replot();
}
/***************************************************
* @brief: 鼠标移动事件函数
* @param: event-鼠标对象
* @return : 无
* @author :鬼魅
* @date :2025-7-29 9:48:38
***************************************************/
void mouseDoubleClick(QMouseEvent *event)
{
if (ui.widget_alarmData->underMouse())
{
if (vline_start == nullptr || vline_end == nullptr || m_currentLabel_start == nullptr || m_currentLabel_end == nullptr)
{
return;
}
}
double x = ui.widget_alarmData->xAxis->pixelToCoord(event->pos().x());
double y = ui.widget_alarmData->yAxis->pixelToCoord(event->pos().y());
if (event->button() == Qt::RightButton)
{
// 画竖线,x为curtime,y只要0和1即可绘制直线了
vline_end->point1->setCoords(x, 0);
vline_end->point2->setCoords(x, 1);
vline_end->setVisible(true);
m_currentLabel_end->setVisible(false);
// 可以设置显示位置跟随锚点的位置,此次我设置的是绝对位置,添加TAG用的
m_currentLabel_end->position->setCoords(x, y);
m_currentLabel_end->setText(QStringLiteral("结束时间"));
stopTime = QTime(0, 0, 0).addSecs(quint64(x));
if (startTime > stopTime)
{
QMessageBox::information(this, tr("提示"), tr("结束时间必须大于开始时间!"));
return;
}
m_currentLabel_end->setVisible(true);
}
else
{
// 画竖线,x为curtime,y只要0和1即可绘制直线了
vline_start->point1->setCoords(x, 0);
vline_start->point2->setCoords(x, 1);
vline_start->setVisible(true);
m_currentLabel_start->setVisible(false);
// 可以设置显示位置跟随锚点的位置,此次我设置的是绝对位置,添加TAG用的
m_currentLabel_start->position->setCoords(x, y);
m_currentLabel_start->setText(QStringLiteral("开始时间"));
startTime = QTime(0, 0, 0).addSecs(quint64(x));
m_currentLabel_start->setVisible(true);
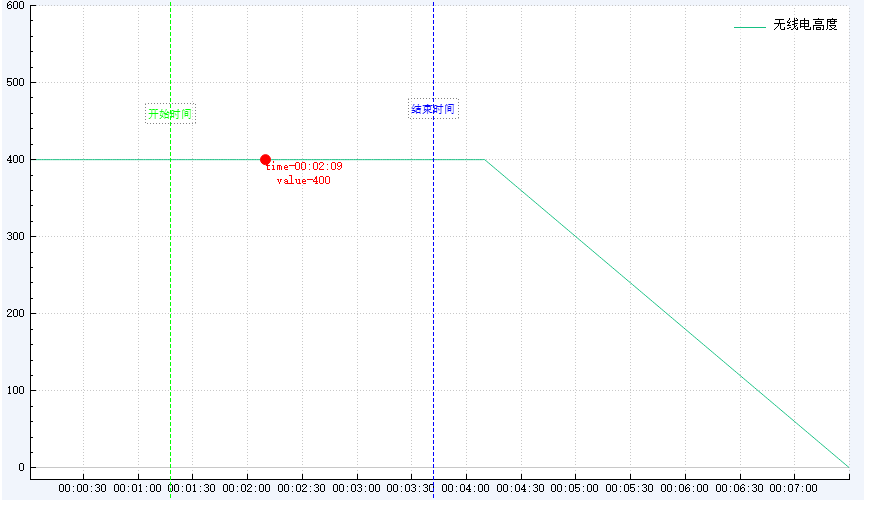
}
}鼠标双击打标签显示效果图如下所示:
注:如果本文章对您有所帮助,请点赞收藏支持一下,谢谢。^_^
版权声明:本文为博主原创文章,转载请附上博文链接。