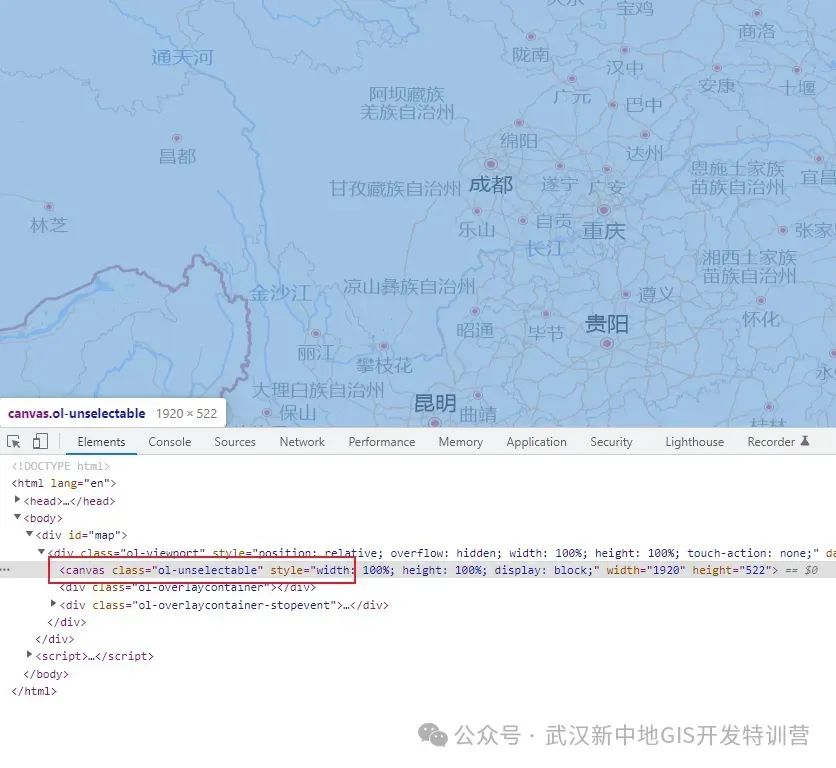
本章节讲解Canvas如何结合 Openlayer 使用,首先我们讲解Canvas的绘图基础。
我们初始化地图的时候可以看见,实际上Openlayer的地图就是用Canvas实现绘制的。
Canvas绘制基本概念
什么是canvas?HTML5 <canvas> 元素用于图形的绘制,区别于css,它的绘制通过 JavaScript 来完成绘制。
<canvas> 标签只是 图形容器 ,您必须使用脚本来绘制图形
Canvas API主要聚焦于2D图形。同样使用<canvas>元素的 WebGL API 则用于绘制硬件加速的2D和3D图形。
绘制矩形
2.1设置canvas元素
<!-- 1、设置canvas元素 --><canvas id="canvas" width="200" height="200"></canvas><script>2.2获取canvas
/* 2、获取canvas */ const canvas = document.getElementById("canvas");2.3获取上下文
返回一个对象,对象包含绘制图形的方法和属性
/* 3、getContext()返回一个对象,对象包含绘制图形的方法和属性 */ const ctx = canvas.getContext("2d");2.4执行绘制
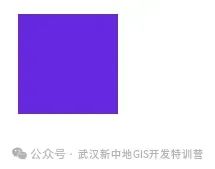
/* 4、执行绘制fillRect(x,y,width,height) x,y*/ ctx.fillRect(10,10,100,100); ctx.fillStyle= "#333"2.5完整代码示例:
<!DOCTYPE html><html lang="en"> <head> <meta charset="UTF-8"> <meta http-equiv="X-UA-Compatible" content="IE=edge"> <meta name="viewport" content="width=device-width, initial-scale=1.0"> <title>Document</title> </head> <body> <!-- 1、设置canvas元素 --> <canvas id="canvas" width="200" height="200"></canvas> <script> /* 2、获取canvas */ const canvas = document.getElementById("canvas"); /* 3、getContext()返回一个对象,对象包含绘制图形的方法和属性 */ const ctx = canvas.getContext("2d"); /* 4、执行绘制fillRect(x,y,width,height) x,y*/ ctx.fillRect(10, 10, 100, 100); ctx.fillStyle = "#333"; </script> </body></html>绘制线
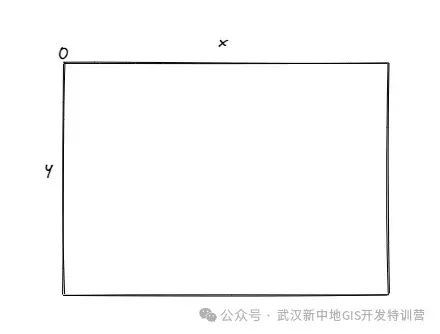
canvas 是一个二维网格
canvas 的左上角坐标为 (0,0)
上面的 fillRect 方法拥有参数 (0,0,100,,100)。
意思是:在左上角开始 (0,0)的位置,绘制100*100的图形
3.1路径
在Canvas上画线,我们将使用以下两种方法:
moveTo(x,y) 定义线条开始坐标
lineTo(x,y) 定义线条结束坐标
绘制线条我们必须使用到 "link" 的 stroke() 方法,执行绘制。
下面我们来试一下在canvas中实现线的绘制
3.2设置canvas元素
<!-- 1、设置canvas元素 --> <canvas id="canvas" width="200" height="200"></canvas> <script>3.3获取canvas元素
/* 2、获取canvas */const canvas = document.getElementById("canvas");3.4获取上下文
/* 3、获取上下文 */const ctx = canvas.getContext("2d");3.5设置起点和终点
起点
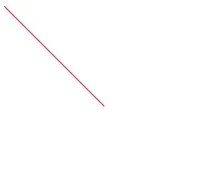
/* 4、moveTo设置起点坐标 */ctx.moveTo(10, 10);终点
/* 5、设置终点坐标 lineTo */ctx.lineTo(100, 100);3.6执行绘制
/* 6、执行绘制 */ctx.strokeStyle = "#ff2d51";ctx.stroke();完整代码:
<!DOCTYPE html><html lang="en"><head> <meta charset="UTF-8"> <meta http-equiv="X-UA-Compatible" content="IE=edge"> <meta name="viewport" content="width=device-width, initial-scale=1.0"> <title>Document</title></head><body> <!-- 1、设置canvas元素 --> <canvas id="canvas" width="200" height="200"></canvas> <script> /* 2、获取canvas */ const canvas = document.getElementById("canvas"); /* 3、获取上下文 */ const ctx = canvas.getContext("2d"); /* 4、moveTo设置起点坐标 */ ctx.moveTo(10, 10); /* 5、设置终点坐标 lineTo */ ctx.lineTo(100, 100); /* 6、执行绘制 */ ctx.strokeStyle = "#ff2d51"; ctx.stroke(); </script></body></html>