OpenLayers与Vue.js结合实现前端地图应用
下面我将为您展示如何将OpenLayers与Vue.js结合创建一个功能丰富的前端地图应用。这个教程包含了基础地图展示、标记点、地图控件以及交互功能。
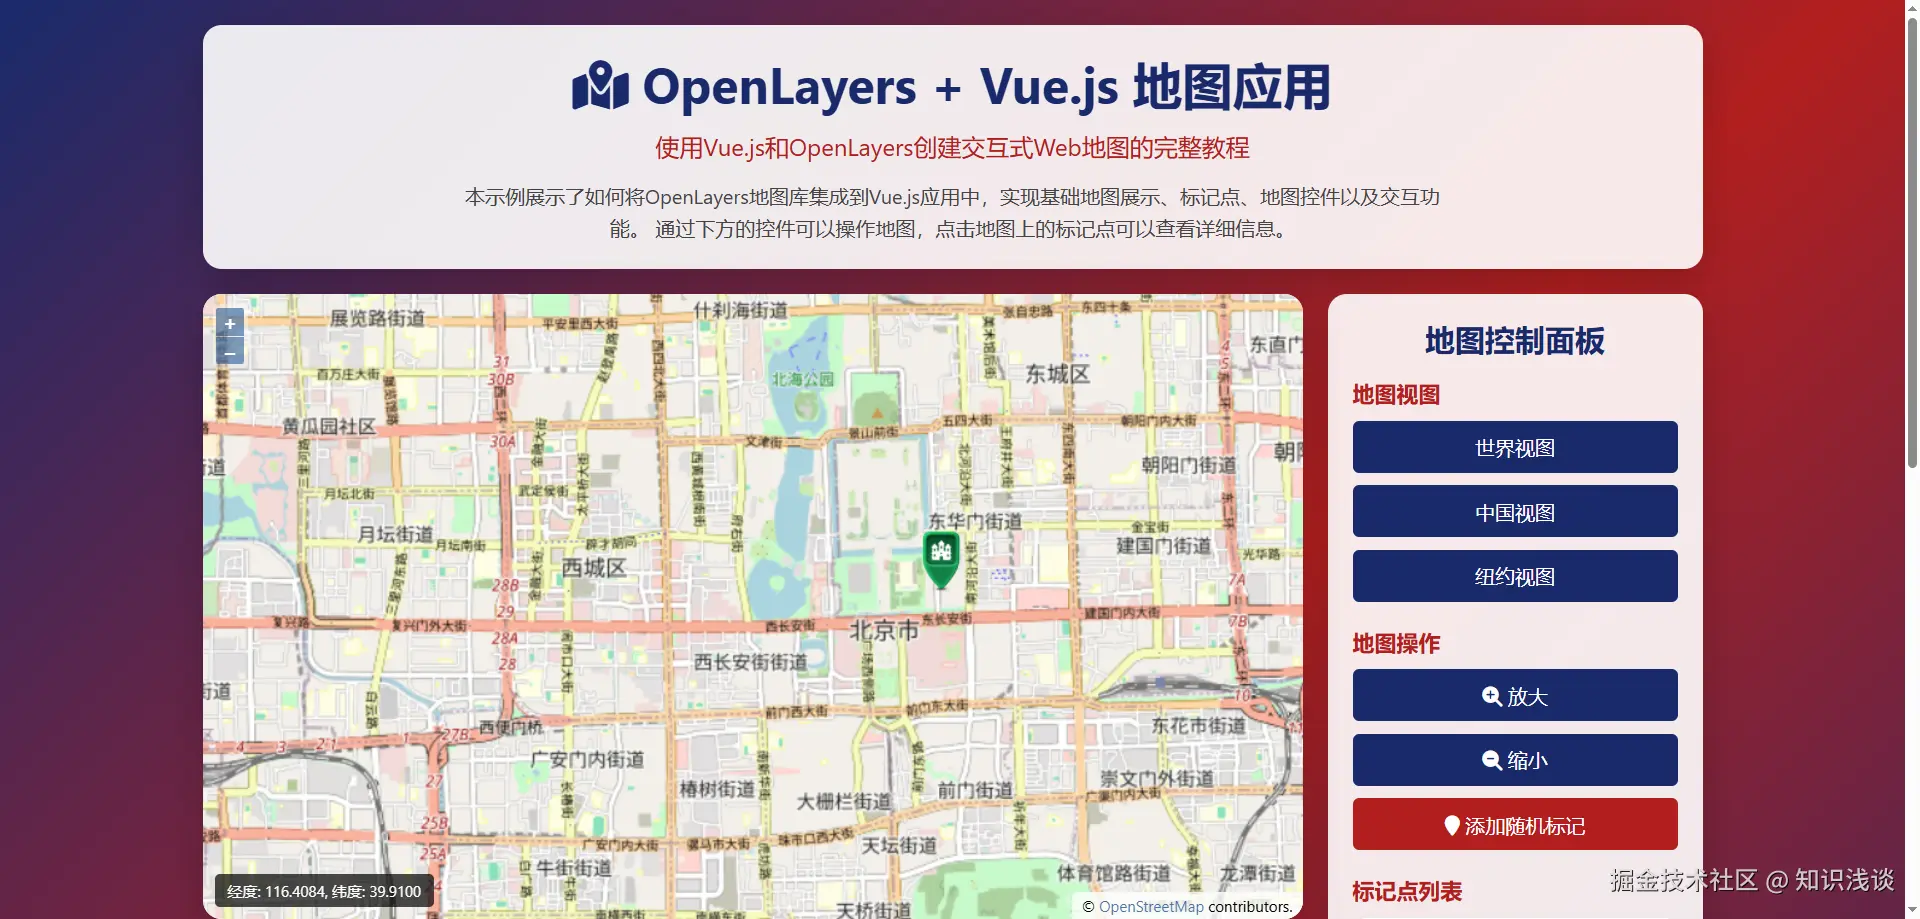
实现结果
实现思路
- 在Vue项目中集成OpenLayers库
- 创建基础地图视图和OSM图层
- 添加标记点和信息弹窗
- 实现地图控件(缩放、全屏、比例尺等)
- 添加地图交互功能(点击标记点显示信息)
完整代码实现
html
<!DOCTYPE html>
<html lang="zh-CN">
<head>
<meta charset="UTF-8">
<meta name="viewport" content="width=device-width, initial-scale=1.0">
<title>OpenLayers + Vue.js 地图应用</title>
<script src="https://cdn.jsdelivr.net/npm/vue@2.6.14/dist/vue.js"></script>
<link rel="stylesheet" href="https://cdn.jsdelivr.net/gh/openlayers/openlayers.github.io@master/en/v6.15.1/css/ol.css">
<script src="https://cdn.jsdelivr.net/gh/openlayers/openlayers.github.io@master/en/v6.15.1/build/ol.js"></script>
<link rel="stylesheet" href="https://cdnjs.cloudflare.com/ajax/libs/font-awesome/6.4.0/css/all.min.css">
<style>
* {
margin: 0;
padding: 0;
box-sizing: border-box;
font-family: 'Segoe UI', Tahoma, Geneva, Verdana, sans-serif;
}
body {
background: linear-gradient(135deg, #1a2a6c, #b21f1f, #1a2a6c);
min-height: 100vh;
padding: 20px;
color: #333;
}
.container {
max-width: 1200px;
margin: 0 auto;
display: flex;
flex-direction: column;
gap: 20px;
}
header {
text-align: center;
padding: 20px;
background: rgba(255, 255, 255, 0.9);
border-radius: 15px;
box-shadow: 0 10px 30px rgba(0, 0, 0, 0.2);
}
h1 {
color: #1a2a6c;
margin-bottom: 10px;
font-size: 2.5rem;
}
.subtitle {
color: #b21f1f;
font-size: 1.2rem;
margin-bottom: 15px;
}
.description {
max-width: 800px;
margin: 0 auto;
line-height: 1.6;
color: #444;
}
.content {
display: flex;
gap: 20px;
flex-wrap: wrap;
}
.map-container {
flex: 1;
min-width: 300px;
height: 500px;
background: white;
border-radius: 15px;
overflow: hidden;
box-shadow: 0 10px 30px rgba(0, 0, 0, 0.2);
position: relative;
}
#map {
width: 100%;
height: 100%;
}
.controls {
background: rgba(255, 255, 255, 0.9);
border-radius: 15px;
padding: 20px;
width: 300px;
box-shadow: 0 10px 30px rgba(0, 0, 0, 0.2);
}
.controls h2 {
color: #1a2a6c;
margin-bottom: 15px;
text-align: center;
}
.control-group {
margin-bottom: 20px;
}
.control-group h3 {
color: #b21f1f;
margin-bottom: 10px;
font-size: 1.1rem;
}
.info-box {
background: white;
padding: 15px;
border-radius: 10px;
margin-bottom: 15px;
box-shadow: 0 4px 8px rgba(0, 0, 0, 0.1);
}
.marker-list {
max-height: 200px;
overflow-y: auto;
}
.marker-item {
padding: 10px;
border-bottom: 1px solid #eee;
cursor: pointer;
transition: background 0.3s;
}
.marker-item:hover {
background: #f0f5ff;
}
.marker-item.active {
background: #e3eeff;
font-weight: bold;
}
.btn {
display: block;
width: 100%;
padding: 10px;
margin: 10px 0;
background: #1a2a6c;
color: white;
border: none;
border-radius: 5px;
cursor: pointer;
font-size: 1rem;
transition: background 0.3s;
}
.btn:hover {
background: #0d1a4a;
}
.btn.secondary {
background: #b21f1f;
}
.btn.secondary:hover {
background: #8a1818;
}
.coordinates {
background: rgba(0, 0, 0, 0.7);
color: white;
padding: 5px 10px;
border-radius: 4px;
position: absolute;
bottom: 10px;
left: 10px;
z-index: 1000;
font-size: 12px;
}
.popup {
position: absolute;
background: white;
border-radius: 8px;
padding: 15px;
box-shadow: 0 2px 10px rgba(0, 0, 0, 0.2);
min-width: 200px;
z-index: 1000;
display: none;
}
.popup h3 {
color: #1a2a6c;
margin-bottom: 8px;
}
.popup p {
margin-bottom: 5px;
}
.popup-close {
position: absolute;
top: 5px;
right: 10px;
cursor: pointer;
color: #b21f1f;
}
.features {
display: flex;
flex-wrap: wrap;
gap: 20px;
margin-top: 20px;
}
.feature-card {
background: rgba(255, 255, 255, 0.9);
border-radius: 15px;
padding: 20px;
flex: 1;
min-width: 250px;
box-shadow: 0 10px 30px rgba(0, 0, 0, 0.1);
}
.feature-card h3 {
color: #1a2a6c;
margin-bottom: 15px;
display: flex;
align-items: center;
gap: 10px;
}
.feature-card i {
color: #b21f1f;
font-size: 1.5rem;
}
.feature-card ul {
padding-left: 20px;
}
.feature-card li {
margin-bottom: 8px;
line-height: 1.5;
}
footer {
text-align: center;
padding: 20px;
color: white;
margin-top: 20px;
}
@media (max-width: 768px) {
.content {
flex-direction: column;
}
.controls {
width: 100%;
}
}
</style>
</head>
<body>
<div id="app" class="container">
<header>
<h1><i class="fas fa-map-marked-alt"></i> OpenLayers + Vue.js 地图应用</h1>
<p class="subtitle">使用Vue.js和OpenLayers创建交互式Web地图的完整教程</p>
<p class="description">
本示例展示了如何将OpenLayers地图库集成到Vue.js应用中,实现基础地图展示、标记点、地图控件以及交互功能。
通过下方的控件可以操作地图,点击地图上的标记点可以查看详细信息。
</p>
</header>
<div class="content">
<div class="map-container">
<div id="map"></div>
<div class="coordinates">经度: {{ currentLon.toFixed(4) }}, 纬度: {{ currentLat.toFixed(4) }}</div>
<div class="popup" id="popup">
<span class="popup-close" @click="closePopup">×</span>
<h3>{{ activeMarker.title }}</h3>
<p><i class="fas fa-info-circle"></i> {{ activeMarker.description }}</p>
<p><i class="fas fa-map-marker-alt"></i> 经度: {{ activeMarker.position[0].toFixed(4) }}</p>
<p><i class="fas fa-map-marker-alt"></i> 纬度: {{ activeMarker.position[1].toFixed(4) }}</p>
</div>
</div>
<div class="controls">
<h2>地图控制面板</h2>
<div class="control-group">
<h3>地图视图</h3>
<button class="btn" @click="setView([0, 0], 2)">世界视图</button>
<button class="btn" @click="setView([116.4, 39.9], 5)">中国视图</button>
<button class="btn" @click="setView([-74.006, 40.7128], 12)">纽约视图</button>
</div>
<div class="control-group">
<h3>地图操作</h3>
<button class="btn" @click="zoomIn"><i class="fas fa-search-plus"></i> 放大</button>
<button class="btn" @click="zoomOut"><i class="fas fa-search-minus"></i> 缩小</button>
<button class="btn secondary" @click="addRandomMarker"><i class="fas fa-map-marker"></i> 添加随机标记</button>
</div>
<div class="control-group">
<h3>标记点列表</h3>
<div class="info-box">
<p>当前标记数: {{ markers.length }}</p>
</div>
<div class="marker-list">
<div
v-for="(marker, index) in markers"
:key="index"
class="marker-item"
:class="{ active: activeMarkerIndex === index }"
@click="showMarkerInfo(index)"
>
{{ marker.title }}
</div>
</div>
</div>
</div>
</div>
<div class="features">
<div class="feature-card">
<h3><i class="fas fa-layer-group"></i> OpenLayers特性</h3>
<ul>
<li>支持多种地图源(OSM, Bing, Mapbox等)</li>
<li>高性能矢量图层渲染</li>
<li>丰富的地图控件(缩放、比例尺、全屏等)</li>
<li>强大的投影转换功能</li>
<li>支持GeoJSON、KML、GPX等地理数据格式</li>
</ul>
</div>
<div class="feature-card">
<h3><i class="fab fa-vuejs"></i> Vue.js集成优势</h3>
<ul>
<li>组件化开发,易于维护</li>
<li>响应式数据绑定,实时更新UI</li>
<li>生命周期钩子管理地图初始化与销毁</li>
<li>丰富的Vue生态插件支持</li>
<li>与Vue状态管理工具(Vuex)无缝集成</li>
</ul>
</div>
<div class="feature-card">
<h3><i class="fas fa-rocket"></i> 应用场景</h3>
<ul>
<li>位置服务与导航应用</li>
<li>地理信息系统(GIS)</li>
<li>实时位置追踪与监控</li>
<li>地理数据分析与可视化</li>
<li>基于位置的游戏与服务</li>
</ul>
</div>
</div>
<footer>
<p>© 2023 OpenLayers + Vue.js 地图教程 | 使用开源技术构建</p>
</footer>
</div>
<script>
new Vue({
el: '#app',
data: {
map: null,
vectorLayer: null,
markers: [
{
title: "北京天安门",
description: "中国首都的象征性建筑",
position: [116.3974, 39.9087]
},
{
title: "上海东方明珠",
description: "上海标志性文化景观之一",
position: [121.4997, 31.2397]
},
{
title: "广州塔",
description: "世界第三高塔",
position: [113.3246, 23.1064]
},
{
title: "深圳世界之窗",
description: "著名微缩景区",
position: [113.9734, 22.5362]
}
],
activeMarker: {
title: "",
description: "",
position: [0, 0]
},
activeMarkerIndex: -1,
currentLon: 0,
currentLat: 0
},
mounted() {
this.initMap();
},
methods: {
initMap() {
// 创建地图实例
this.map = new ol.Map({
target: 'map',
layers: [
new ol.layer.Tile({
source: new ol.source.OSM()
})
],
view: new ol.View({
center: ol.proj.fromLonLat([116.4, 39.9]),
zoom: 5
})
});
// 创建矢量图层用于标记点
this.vectorLayer = new ol.layer.Vector({
source: new ol.source.Vector(),
style: new ol.style.Style({
image: new ol.style.Icon({
anchor: [0.5, 1],
src: 'https://openlayers.org/en/latest/examples/data/icon.png'
})
})
});
this.map.addLayer(this.vectorLayer);
// 添加初始标记点
this.markers.forEach(marker => {
this.addMarker(marker.position, marker.title);
});
// 监听地图点击事件
this.map.on('click', (event) => {
this.map.forEachFeatureAtPixel(event.pixel, (feature) => {
const index = this.markers.findIndex(m =>
m.position[0] === feature.get('lon') &&
m.position[1] === feature.get('lat')
);
if (index !== -1) {
this.showMarkerInfo(index);
}
});
});
// 监听地图移动事件,更新坐标
this.map.on('pointermove', (event) => {
const coords = ol.proj.toLonLat(event.coordinate);
this.currentLon = coords[0];
this.currentLat = coords[1];
});
},
addMarker(coords, title) {
const feature = new ol.Feature({
geometry: new ol.geom.Point(ol.proj.fromLonLat(coords))
});
feature.set('lon', coords[0]);
feature.set('lat', coords[1]);
feature.set('title', title);
this.vectorLayer.getSource().addFeature(feature);
},
addRandomMarker() {
const lon = this.currentLon + (Math.random() - 0.5) * 10;
const lat = this.currentLat + (Math.random() - 0.5) * 10;
const title = `随机点 ${this.markers.length + 1}`;
this.markers.push({
title: title,
description: "这是一个随机添加的标记点",
position: [lon, lat]
});
this.addMarker([lon, lat], title);
},
showMarkerInfo(index) {
this.activeMarker = { ...this.markers[index] };
this.activeMarkerIndex = index;
const popup = document.getElementById('popup');
popup.style.display = 'block';
// 定位弹窗到标记位置
const markerCoords = ol.proj.fromLonLat(this.activeMarker.position);
const pixel = this.map.getPixelFromCoordinate(markerCoords);
popup.style.left = (pixel[0] - popup.offsetWidth / 2) + 'px';
popup.style.top = (pixel[1] - popup.offsetHeight - 40) + 'px';
// 平移到标记点
this.map.getView().animate({
center: markerCoords,
duration: 500
});
},
closePopup() {
document.getElementById('popup').style.display = 'none';
this.activeMarkerIndex = -1;
},
setView(coords, zoom) {
this.map.getView().animate({
center: ol.proj.fromLonLat(coords),
zoom: zoom,
duration: 1000
});
},
zoomIn() {
const view = this.map.getView();
view.animate({
zoom: view.getZoom() + 1,
duration: 300
});
},
zoomOut() {
const view = this.map.getView();
view.animate({
zoom: view.getZoom() - 1,
duration: 300
});
}
}
});
</script>
</body>
</html>教程说明
1. 集成OpenLayers到Vue项目
首先在HTML中引入OpenLayers的CSS和JS文件:
html
<link rel="stylesheet" href="https://cdn.jsdelivr.net/gh/openlayers/openlayers.github.io@master/en/v6.15.1/css/ol.css">
<script src="https://cdn.jsdelivr.net/gh/openlayers/openlayers.github.io@master/en/v6.15.1/build/ol.js"></script>2. 创建地图实例
在Vue的mounted生命周期钩子中初始化地图:
javascript
this.map = new ol.Map({
  target: 'map',
  layers: [
    new ol.layer.Tile({
      source: new ol.source.OSM()  // 使用OpenStreetMap作为底图
    })
  ],
  view: new ol.View({
    center: ol.proj.fromLonLat([116.4, 39.9]),  // 初始中心点(北京)
    zoom: 5  // 初始缩放级别
  })
});
3. 添加标记点
创建矢量图层来显示标记点:
javascript
this.vectorLayer = new ol.layer.Vector({
  source: new ol.source.Vector(),
  style: new ol.style.Style({
    image: new ol.style.Icon({
      anchor: [0.5, 1],  // 图标锚点
      src: 'https://openlayers.org/en/latest/examples/data/icon.png'
    })
  })
});
添加标记点的方法:
javascript
addMarker(coords, title) {
  const feature = new ol.Feature({
    geometry: new ol.geom.Point(ol.proj.fromLonLat(coords))
  });

  feature.set('lon', coords[0]);
  feature.set('lat', coords[1]);
  feature.set('title', title);

  this.vectorLayer.getSource().addFeature(feature);
}
4. 实现交互功能
显示标记点信息弹窗:
javascript
showMarkerInfo(index) {
  this.activeMarker = { ...this.markers[index] };
  const popup = document.getElementById('popup');

  // 定位弹窗到标记位置
  const markerCoords = ol.proj.fromLonLat(this.activeMarker.position);
  const pixel = this.map.getPixelFromCoordinate(markerCoords);

  popup.style.left = (pixel[0] - popup.offsetWidth / 2) + 'px';
  popup.style.top = (pixel[1] - popup.offsetHeight - 40) + 'px';
  popup.style.display = 'block';
}
地图视图控制:
javascript
setView(coords, zoom) {
  this.map.getView().animate({
    center: ol.proj.fromLonLat(coords),
    zoom: zoom,
    duration: 1000
  });
}
5. 响应式设计
使用CSS Flexbox和媒体查询确保应用在不同设备上都能良好显示:
css
@media (max-width: 768px) {
  .content {
    flex-direction: column;
  }

  .controls {
    width: 100%;
  }
}
总结
本教程展示了如何:
- 在Vue.js应用中集成OpenLayers地图库
- 创建基础地图和添加标记点
- 实现地图交互功能(点击标记点显示信息)
- 添加地图控件(视图切换、缩放等)
- 设计响应式界面适应不同设备
您可以根据需要进一步扩展功能,如添加不同类型的图层、实现路径规划、集成地理编码服务等。