Matplotlib最佳实践与技巧
学习目标
本课程将深入探讨Matplotlib的高级使用技巧,包括性能优化、代码组织和常见问题解决方法,旨在帮助学员提高绘图效率,使图表更加美观和专业。
相关知识点
- Matplotlib高级使用技巧
学习内容
1 Matplotlib高级使用技巧
1.1 性能优化
在使用Matplotlib进行大规模数据可视化时,性能优化是一个不可忽视的方面。优化不仅能够提高代码的执行效率,还能提升用户体验。以下是几种常见的性能优化方法:
1.1.1 使用向量化操作
Matplotlib在处理大量数据时,使用向量化操作可以显著提高性能。向量化操作是指利用NumPy等库提供的函数,直接对整个数组进行操作,而不是使用Python的循环。
示例代码:
%pip install matplotlib
%pip install --upgrade ipython
python
#下载对应的字体文件与大数据文件

!wget https://model-community-picture.obs.cn-north-4.myhuaweicloud.com/ascend-zone/notebook_datasets/ff910f90309d11f0bd07fa163edcddae/dingliesongtypeface20241217-2.ttf

!wget https://model-community-picture.obs.cn-north-4.myhuaweicloud.com/ascend-zone/notebook_datasets/ff910f90309d11f0bd07fa163edcddae/large_dataset.csv
bash
import numpy as np
import matplotlib.pyplot as plt

# 生成10000个随机数据点
x = np.random.rand(10000)
y = np.random.rand(10000)

# 使用向量化操作绘制散点图
plt.scatter(x, y, s=1)  # s参数控制点的大小
plt.show()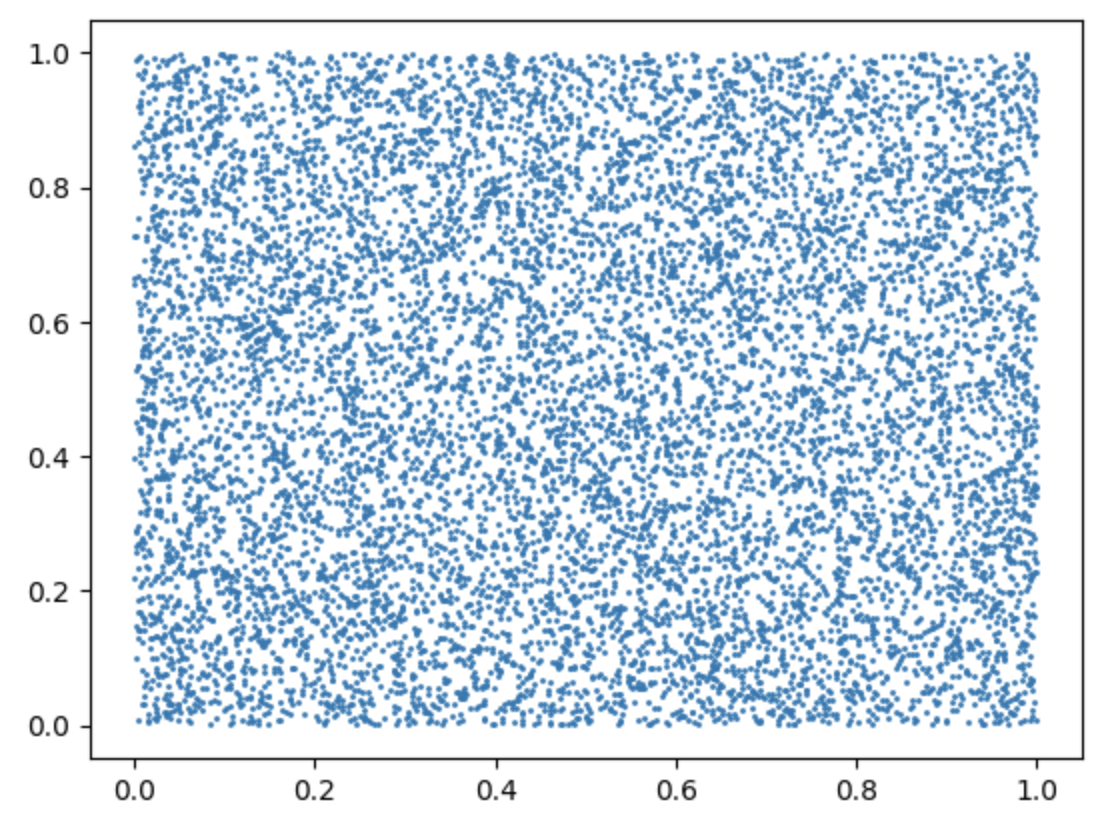
1.1.2 减少图元数量
在绘制复杂的图表时,减少图元(如线条、标记等)的数量可以显著提高性能。可以通过调整数据的采样率或使用更简单的图元来实现。
示例代码:
python
import numpy as np
import matplotlib.pyplot as plt

# 生成10000个数据点
x = np.linspace(0, 10, 10000)
y = np.sin(x)

# 减少数据点的数量
x_sampled = x[::100]
y_sampled = y[::100]

# 绘制减少后的数据点
plt.plot(x_sampled, y_sampled)
plt.show()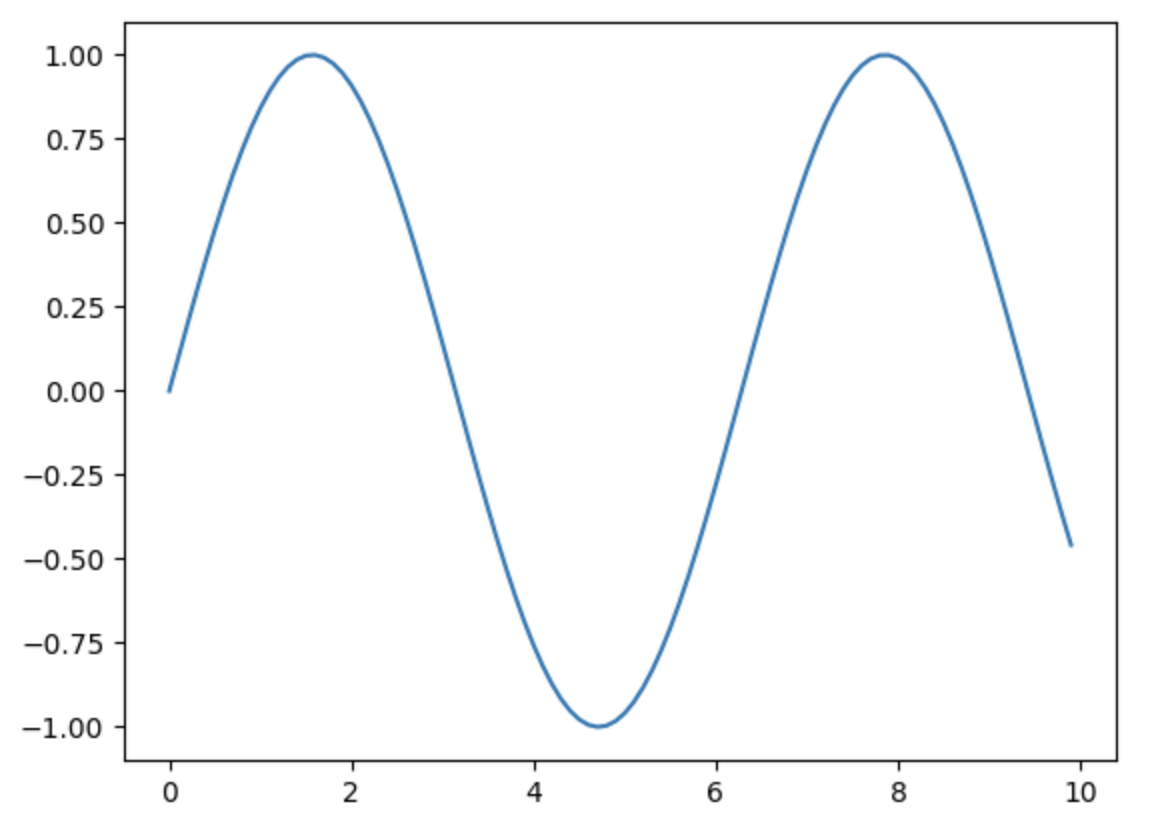
1.2 代码组织
良好的代码组织不仅有助于提高代码的可读性和可维护性,还能提高开发效率。以下是一些代码组织的最佳实践:
1.2.1 使用函数和类
将绘图代码封装在函数或类中,可以提高代码的复用性和可测试性。通过将不同的绘图任务分解为独立的函数或方法,可以更容易地管理和维护代码。
示例代码:
python
import matplotlib.pyplot as plt

def plot_line(x, y, title):
    plt.plot(x, y)
    plt.title(title)
    plt.xlabel('X-axis')
    plt.ylabel('Y-axis')
    plt.show()

# 生成数据
x = [1, 2, 3, 4, 5]
y = [1, 4, 9, 16, 25]

# 调用函数绘制图表
plot_line(x, y, 'Line Plot')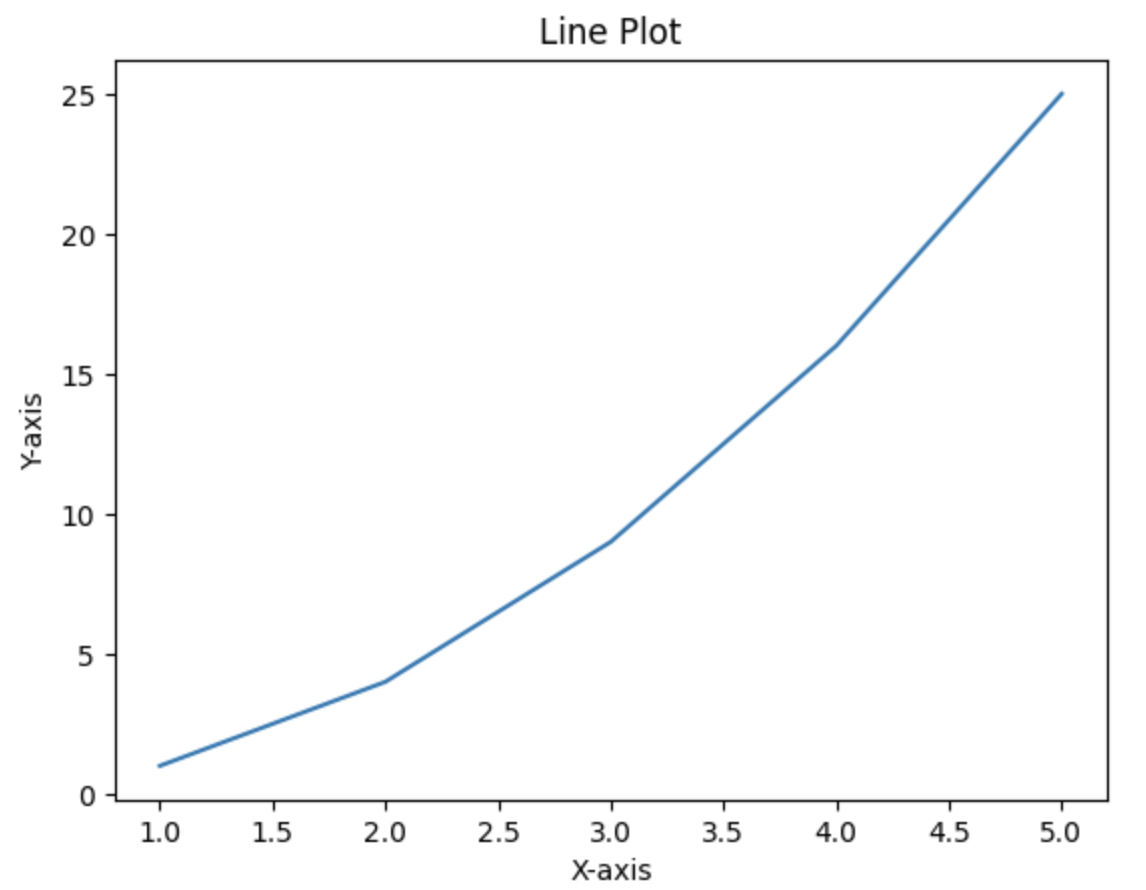
1.2.2 使用配置文件
对于复杂的图表,可以将绘图参数存储在配置文件中,通过读取配置文件来生成图表。这样可以更容易地调整图表的样式,而不需要修改代码。
示例代码:
python
import matplotlib.pyplot as plt
import json

def plot_from_config(config_file):
    with open(config_file, 'r') as f:
        config = json.load(f)

    x = config['x']
    y = config['y']
    title = config['title']
    xlabel = config['xlabel']
    ylabel = config['ylabel']

    plt.plot(x, y)
    plt.title(title)
    plt.xlabel(xlabel)
    plt.ylabel(ylabel)
    plt.show()

# 配置文件内容
config = {
    "x": [1, 2, 3, 4, 5],
    "y": [1, 4, 9, 16, 25],
    "title": "Line Plot",
    "xlabel": "X-axis",
    "ylabel": "Y-axis"
}

# 将配置文件保存到文件
with open('config.json', 'w') as f:
    json.dump(config, f)

# 调用函数绘制图表
plot_from_config('config.json')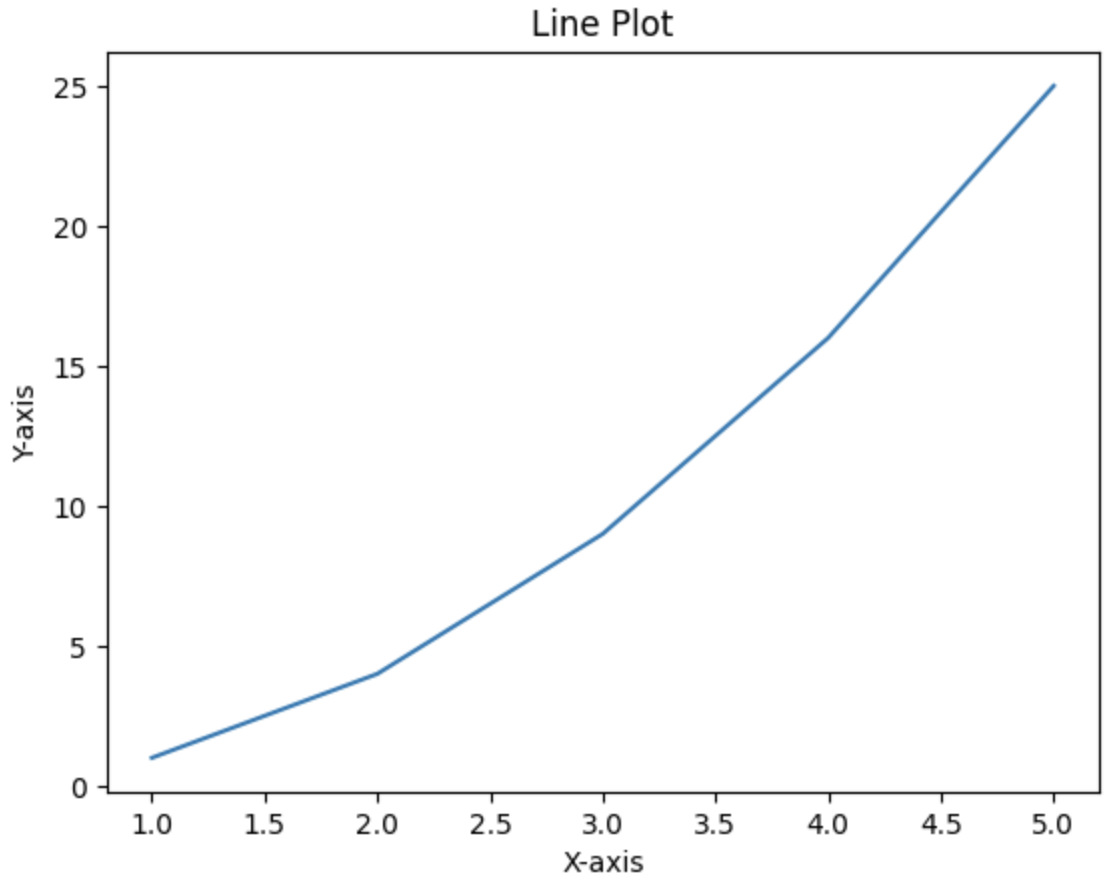
1.3 常见问题解决
在使用Matplotlib时,经常会遇到一些常见的问题。了解这些问题的解决方法,可以帮助学员更高效地使用Matplotlib。
1.3.1 解决中文显示问题
在Matplotlib中显示中文时,可能会遇到乱码或字体缺失的问题。通过设置Matplotlib的字体,可以解决这些问题。
示例代码:
python
import matplotlib.pyplot as plt
import matplotlib.font_manager as fm

# 设置中文字体
font_path = './dingliesongtypeface20241217-2.ttf'  # 替换为对应的字体文件路径
font_prop = fm.FontProperties(fname=font_path)

x = [1, 2, 3, 4, 5]
y = [1, 4, 9, 16, 25]

plt.plot(x, y)
plt.title('中文标题', fontproperties=font_prop)
plt.xlabel('X轴', fontproperties=font_prop)
plt.ylabel('Y轴', fontproperties=font_prop)
plt.show()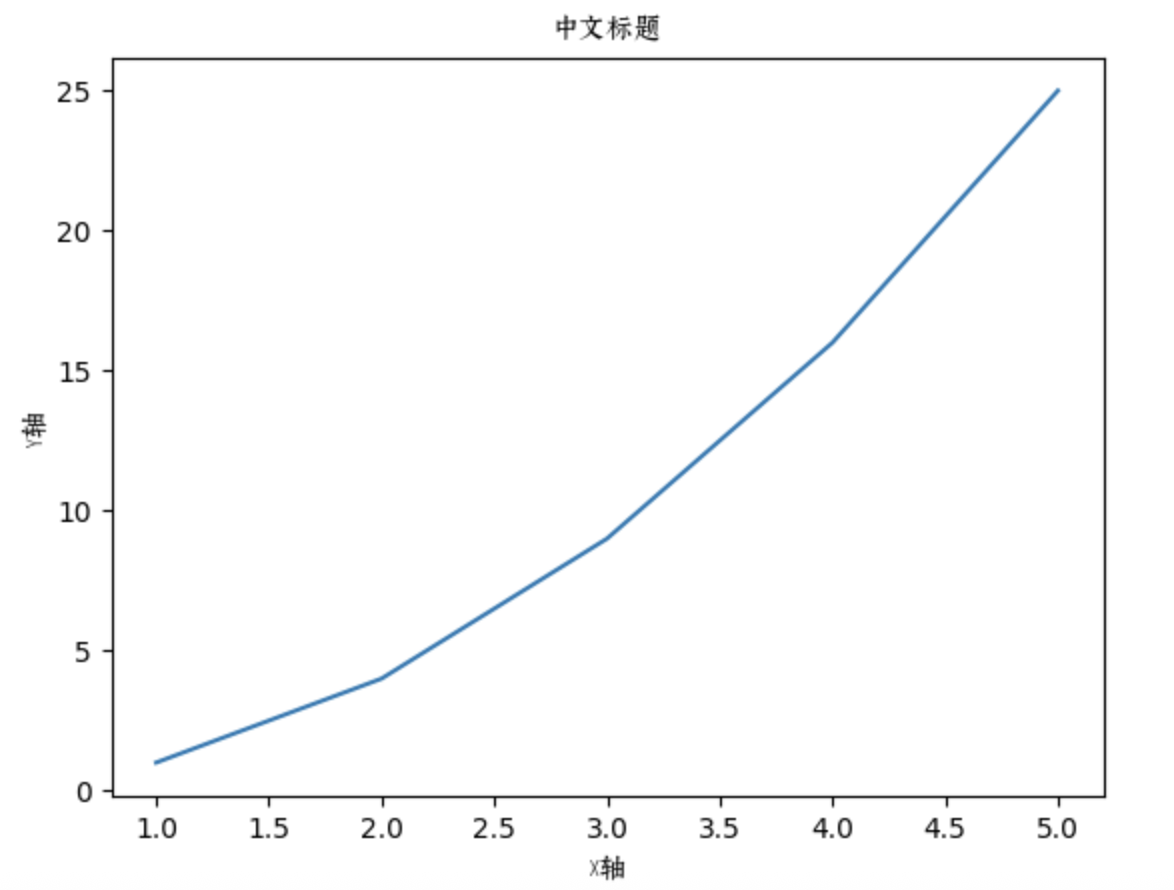
1.3.2 保存高质量图像
在保存图像时,选择合适的文件格式和分辨率可以提高图像的质量。Matplotlib支持多种文件格式,如PNG、PDF、SVG等。
示例代码:
python
import matplotlib.pyplot as plt

x = [1, 2, 3, 4, 5]
y = [1, 4, 9, 16, 25]

plt.plot(x, y)
plt.title('High Quality Image')
plt.xlabel('X-axis')
plt.ylabel('Y-axis')

# 保存高质量图像
plt.savefig('high_quality_image.png', dpi=300)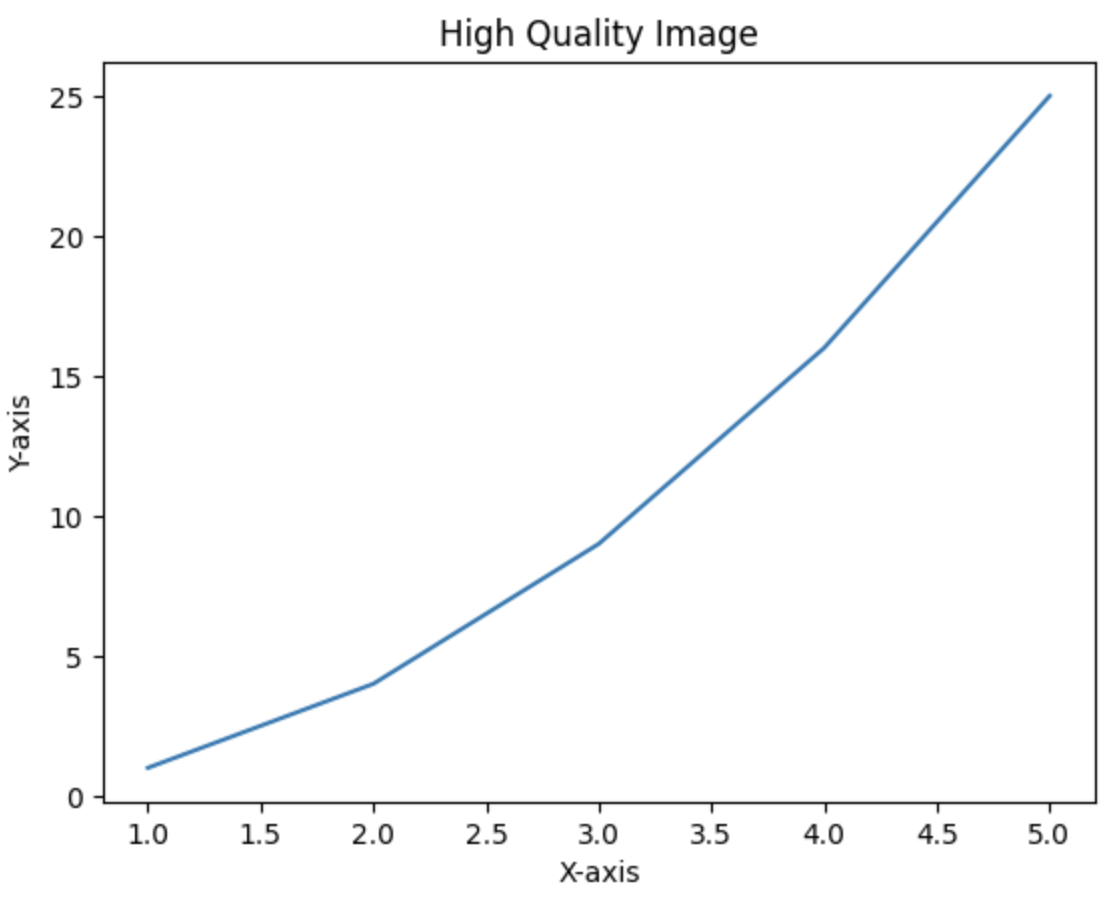
1.3.3 处理大数据集
在处理大数据集时,Matplotlib可能会变得非常慢。通过使用Pandas等库进行数据预处理,可以提高绘图的效率。
示例代码:
python
import pandas as pd
import matplotlib.pyplot as plt

# 读取大数据集
data = pd.read_csv('large_dataset.csv')

# 选择需要的列
x = data['x_column']
y = data['y_column']

# 绘制图表
plt.plot(x, y)
plt.title('Large Dataset Plot')
plt.xlabel('X-axis')
plt.ylabel('Y-axis')
plt.show()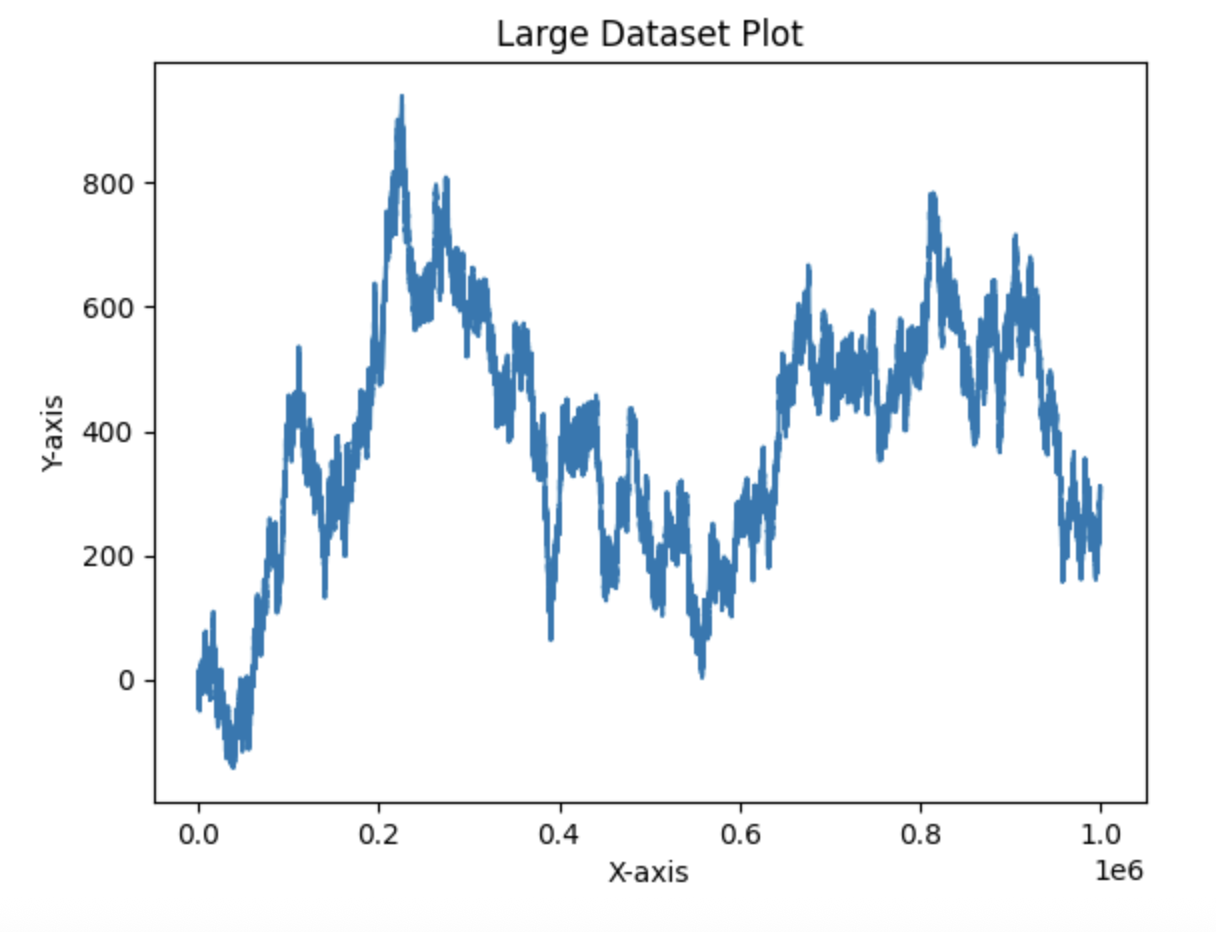
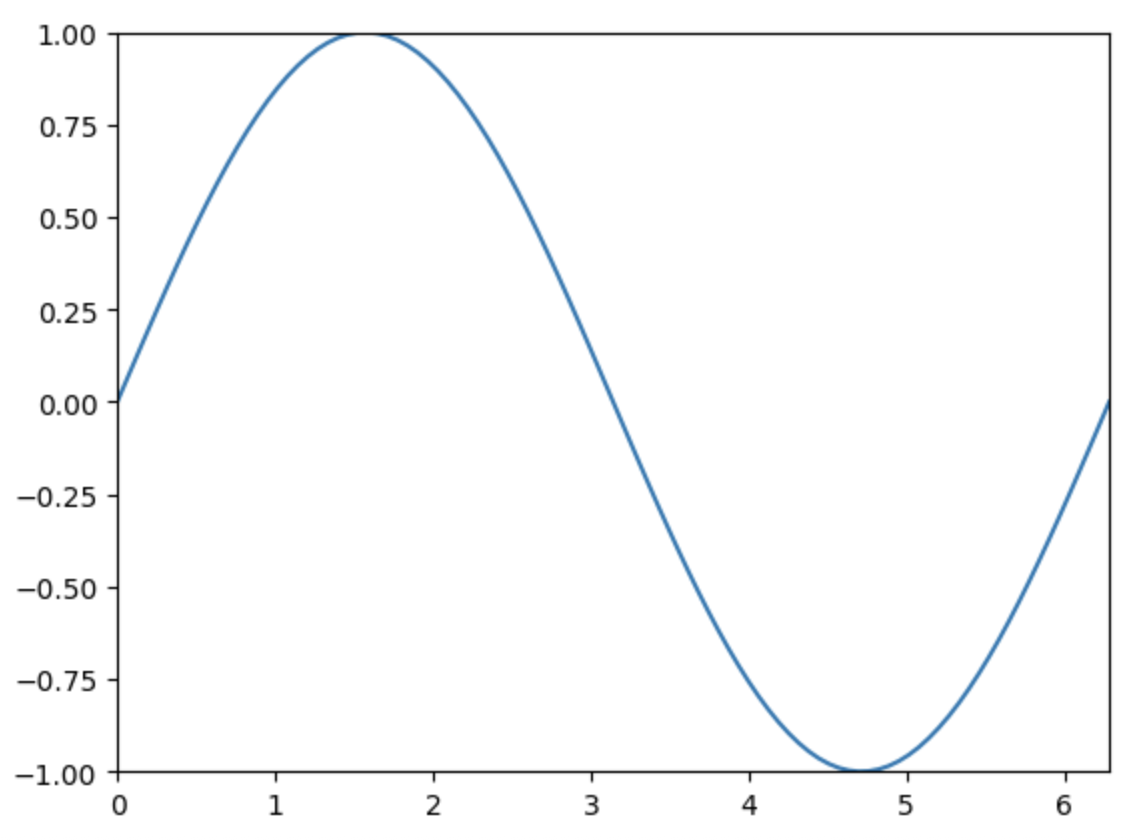
1.4 使用Blitting技术
Blitting技术是一种在Matplotlib中提高动画性能的方法。通过缓存背景图像,只更新变化的部分,可以显著减少重绘的时间。
示例代码:
python
from IPython import get_ipython
import numpy as np
import matplotlib.pyplot as plt
import matplotlib.animation as animation

fig, ax = plt.subplots()
x = np.linspace(0, 2 * np.pi, 100)
line, = ax.plot(x, np.sin(x))

def init():
    ax.set_xlim(0, 2 * np.pi)
    ax.set_ylim(-1, 1)
    return line,

def animate(i):
    line.set_ydata(np.sin(x + i / 50.0))
    return line,

ani = animation.FuncAnimation(fig, animate, init_func=init, frames=100, interval=20, blit=True)
plt.show()