在生产环境里,大家或多或少都遇到过这种场景:
某个 Spring Boot 应用突然 CPU 飙升,打满服务器资源;
监控报警狂响,业务接口开始超时;
登录服务器,top 一看,只能看到是 java 进程在耗 CPU;
再往下就蒙了 ------ 到底是哪段代码在吃 CPU?
如果你和我一样,不想每次都靠运维层面"重启大法",而是希望快速定位到 具体的类和方法,那你就需要一把更锋利的武器。
本文要介绍的就是:如何在 SpringBoot 程序里,自制一个 方法级采样火焰图工具,3 分钟锁定 CPU 热点。
一、痛点分析
常见的排查思路:
- •
top/htop:只能看到进程或线程 ID,定位不到代码。 - •
jstack:能 dump 出线程栈,但静态快照往往抓不到真正的热点方法(CPU 飙升的时候,线程可能在不停切换)。 - •
async-profiler、arthas:功能很强大,但对于一些没有安装权限的生产环境,落地成本比较高。
所以我的需求是:
轻量化:不用复杂部署,应用自身就能带。
方法级采样:不仅要看到类名,还要定位到具体的方法。
火焰图可视化:一眼看出热点,而不是一堆堆日志。
二、思路设计
核心思路其实很简单:
1、在应用运行时,定时对线程栈进行采样;
2、把每次采样到的「调用栈」进行统计和合并;
3、输出为 火焰图格式数据(一般是 Flame Graph 的 stack collapse 格式);
4、前端页面用现成的 JS 库(比如 d3-flame-graph)渲染成交互式图谱。
这样,我们就能在浏览器里看到:哪些方法被调用得最多,消耗了 CPU。
三、技术选型
采样方式 :基于 JDK 自带的 ThreadMXBean + getThreadInfo,周期性拉取栈帧;
数据存储 :用内存里的 ConcurrentHashMap 统计调用栈频次;
可视化输出 :提供一个 /flamegraph HTTP 接口,返回 collapse 格式数据;
前端展示 :引入 d3-flame-graph绘制火焰图。
四、关键实现
1. 采样器
java
@Component
public class CpuSampler {

    private final ScheduledExecutorService executor =
            Executors.newSingleThreadScheduledExecutor();

    private final Map<String, AtomicInteger> stackCount = new ConcurrentHashMap<>();

    @PostConstruct
    public void start() {
        executor.scheduleAtFixedRate(this::sample, 0, 50, TimeUnit.MILLISECONDS);
    }

    private void sample() {
        ThreadMXBean threadMXBean = ManagementFactory.getThreadMXBean();
        for (long tid : threadMXBean.getAllThreadIds()) {
            ThreadInfo info = threadMXBean.getThreadInfo(tid, Integer.MAX_VALUE);
            if (info == null) continue;

            StringBuilder sb = new StringBuilder();
            for (StackTraceElement frame : info.getStackTrace()) {
                sb.append(frame.getClassName())
                  .append(".")
                  .append(frame.getMethodName())
                  .append(";");
            }
            String stackLine = sb.toString();
            stackCount.computeIfAbsent(stackLine, k -> new AtomicInteger(0)).incrementAndGet();
        }
    }

    public Map<String, AtomicInteger> getStackCount() {
        return stackCount;
    }
}
2. 提供 HTTP 接口
scss
@RestController
public class FlameGraphController {

    @Autowired
    private CpuSampler sampler;

    @GetMapping("/flamegraph")
    public String getFlameGraphData() {
        StringBuilder sb = new StringBuilder();
        sampler.getStackCount().forEach((stack, count) -> {
            // flamegraph 的输入格式: method1;method2;method3 count
            sb.append(stack).append(" ").append(count.get()).append("\n");
        });
        return sb.toString();
    }
}
3. 前端展示
一个简单的 HTML 页面即可:
ini
<script>
let flameChart = null;
let flameGraphFactory = null; // 添加全局变量
let samplingEnabled = false;
// 初始化
document.addEventListener('DOMContentLoaded', function() {
// 等待一段时间确保库完全加载
setTimeout(function() {
console.log('检查库加载状态...');
console.log('d3:', typeof d3);
console.log('flamegraph:', typeof flamegraph);
console.log('d3.flamegraph:', typeof (d3 && d3.flamegraph));
console.log('window对象上的flame相关属性:', Object.keys(window).filter(key => key.toLowerCase().includes('flame')));
console.log('d3对象的属性:', d3 ? Object.keys(d3).filter(key => key.toLowerCase().includes('flame')) : 'd3未定义');
if (typeof d3 === 'undefined') {
showError('D3.js库未加载成功');
return;
}
// 尝试不同的API访问方式
if (typeof flamegraph !== 'undefined') {
console.log('使用全局flamegraph函数');
flameGraphFactory = flamegraph;
} else if (d3 && typeof d3.flamegraph !== 'undefined') {
console.log('使用d3.flamegraph函数');
flameGraphFactory = d3.flamegraph;
} else if (d3 && typeof d3.flameGraph !== 'undefined') {
console.log('使用d3.flameGraph函数');
flameGraphFactory = d3.flameGraph;
} else if (typeof window.flamegraph !== 'undefined') {
console.log('使用window.flamegraph函数');
flameGraphFactory = window.flamegraph;
} else if (window.flamegraph && window.flamegraph.flamegraph) {
console.log('使用window.flamegraph.flamegraph函数');
flameGraphFactory = window.flamegraph.flamegraph;
} else {
console.error('未找到flamegraph函数,可用的全局变量:', Object.keys(window).filter(k => k.includes('flame')));
showError('d3-flame-graph库加载成功但API不匹配');
return;
}
if (flameGraphFactory) {
try {
initFlameGraph(flameGraphFactory);
} catch (e) {
console.error('初始化火焰图失败:', e);
showError('火焰图初始化失败: ' + e.message);
}
}
updateStatus();
// 绑定事件
document.getElementById('refreshBtn').onclick = refreshFlameGraph;
document.getElementById('enableBtn').onclick = enableSampling;
document.getElementById('disableBtn').onclick = disableSampling;
document.getElementById('clearBtn').onclick = clearData;
document.getElementById('debugBtn').onclick = showDebugInfo;
document.getElementById('rawDataBtn').onclick = showRawData;
// 自动刷新状态
setInterval(updateStatus, 5000);
}, 1000);
});
function initFlameGraph(flameGraphFactory) {
console.log('开始初始化火焰图,工厂函数:', flameGraphFactory);
try {
// 使用d3-flame-graph v4的正确API
flameChart = flameGraphFactory()
.width(Math.max(960, window.innerWidth - 80))
.cellHeight(18)
.transitionDuration(750)
.minFrameSize(1)
.sort(true);
console.log('火焰图初始化成功,实例:', flameChart);
} catch (e) {
console.error('火焰图初始化过程中出错:', e);
throw e;
}
}
async function updateStatus() {
try {
const response = await fetch('/api/sampling/status');
const data = await response.json();
samplingEnabled = data.enabled;
const statusElement = document.getElementById('status');
const dataCountElement = document.getElementById('dataCount');
if (samplingEnabled) {
statusElement.textContent = '采样运行中';
statusElement.className = 'status enabled';
} else {
statusElement.textContent = '采样已停止';
statusElement.className = 'status disabled';
}
dataCountElement.textContent = `数据量: ${data.stackCountSize}`;
} catch (error) {
console.error('Error updating status:', error);
}
}
async function refreshFlameGraph() {
const loadingElement = document.getElementById('loading');
const noDataElement = document.getElementById('noData');
const chartElement = document.getElementById('chart');
loadingElement.style.display = 'block';
noDataElement.style.display = 'none';
chartElement.innerHTML = '';
try {
const response = await fetch('/api/flamegraph');
const data = await response.text();
loadingElement.style.display = 'none';
if (!data.trim() || data.trim().startsWith('#')) {
noDataElement.style.display = 'block';
return;
}
// 检查火焰图是否已经初始化
if (!flameChart) {
showError('火焰图未初始化,请刷新页面重试');
return;
}
try {
console.log('原始数据长度:', data.length);
console.log('原始数据前500字符:', data.substring(0, 500));
console.log('flameGraphFactory:', flameGraphFactory);
// 手动解析collapsed格式数据
const lines = data.trim().split('\n').filter(line => line.trim() && !line.startsWith('#'));
if (lines.length === 0) {
noDataElement.style.display = 'block';
showError('没有有效的采样数据');
return;
}
console.log('有效数据行数:', lines.length);
console.log('前5行数据:', lines.slice(0, 5));
// 构建火焰图数据结构 - 简化格式
const root = {
name: "all",
children: [],
value: 0
};
const pathMap = new Map();
pathMap.set("", root);
lines.forEach(line => {
const parts = line.trim().split(' ');
if (parts.length < 2) return;
const count = parseInt(parts[parts.length - 1]);
if (isNaN(count) || count <= 0) return;
const stackTrace = parts.slice(0, -1).join(' ');
const methods = stackTrace.split(';').filter(m => m.trim());
if (methods.length === 0) return;
let currentPath = "";
let currentNode = root;
methods.forEach((method) => {
const newPath = currentPath + (currentPath ? ";" : "") + method;
if (!pathMap.has(newPath)) {
const newNode = {
name: method,
children: [],
value: count
};
pathMap.set(newPath, newNode);
currentNode.children.push(newNode);
} else {
pathMap.get(newPath).value += count;
}
currentNode = pathMap.get(newPath);
currentPath = newPath;
});
});
// 计算总值
function calculateTotals(node) {
let total = node.value || 0;
if (node.children) {
for (const child of node.children) {
total += calculateTotals(child);
}
}
node.value = total;
return total;
}
calculateTotals(root);
console.log('构建的火焰图数据:', root);
console.log('根节点children数量:', root.children.length);
console.log('根节点value:', root.value);
console.log('子节点详情:', root.children.map(c => ({name: c.name, value: c.value, childrenCount: c.children.length})));
if (root.children.length === 0) {
noDataElement.style.display = 'block';
showError('没有找到有效的调用栈数据');
return;
}
// 清空并准备chart容器
const chartElement = document.getElementById('chart');
chartElement.innerHTML = '';
console.log('Chart容器已清空');
try {
// 直接渲染火焰图,不使用复杂的检查
console.log('开始渲染火焰图...');
d3.select("#chart")
.datum(root)
.call(flameChart);
console.log('火焰图渲染调用完成');
} catch (renderError) {
console.error('火焰图渲染时出错:', renderError);
showError('火焰图渲染失败: ' + renderError.message);
showTreeView(root);
}
console.log('火焰图渲染完成');
} catch (parseError) {
console.error('Error parsing flame graph data:', parseError);
showError('解析火焰图数据时出错: ' + parseError.message);
}
} catch (error) {
loadingElement.style.display = 'none';
showError('获取火焰图数据失败: ' + error.message);
console.error('Error refreshing flame graph:', error);
}
}
function showDataAsTable(data) {
const lines = data.trim().split('\n').filter(line => line.trim() && !line.startsWith('#'));
let tableHtml = `
<div style="max-height: 400px; overflow-y: auto;">
<h4>📊 CPU采样数据 (表格形式)</h4>
<table style="width: 100%; border-collapse: collapse; font-size: 12px;">
<thead>
<tr style="background: #f0f0f0;">
<th style="border: 1px solid #ddd; padding: 8px; text-align: left;">调用栈</th>
<th style="border: 1px solid #ddd; padding: 8px; text-align: right;">采样次数</th>
</tr>
</thead>
<tbody>
`;
lines.slice(0, 50).forEach(line => {
const parts = line.trim().split(' ');
if (parts.length < 2) return;
const count = parts[parts.length - 1];
const stack = parts.slice(0, -1).join(' ');
tableHtml += `
<tr>
<td style="border: 1px solid #ddd; padding: 4px; font-family: monospace;">${stack}</td>
<td style="border: 1px solid #ddd; padding: 4px; text-align: right;">${count}</td>
</tr>
`;
});
if (lines.length > 50) {
tableHtml += `<tr><td colspan="2" style="text-align: center; padding: 8px;">... 还有 ${lines.length - 50} 条数据</td></tr>`;
}
tableHtml += `
</tbody>
</table>
</div>
`;
document.getElementById('chart').innerHTML = tableHtml;
}
function showTreeView(root) {
console.log('显示树状视图');
function renderNode(node, depth = 0) {
const indent = ' '.repeat(depth);
const percentage = root.value > 0 ? ((node.value / root.value) * 100).toFixed(1) : '0.0';
let html = `<div style="margin-left: ${depth * 20}px; padding: 2px 0; font-family: monospace; font-size: 12px;">`;
html += `<span style="color: #666;">${percentage}%</span> `;
html += `<span style="color: #333;">${node.name}</span> `;
html += `<span style="color: #999;">(${node.value})</span>`;
html += `</div>`;
if (node.children && node.children.length > 0) {
// 按value排序,显示最重要的调用
const sortedChildren = [...node.children].sort((a, b) => b.value - a.value);
for (const child of sortedChildren.slice(0, 10)) { // 只显示前10个
html += renderNode(child, depth + 1);
}
if (sortedChildren.length > 10) {
html += `<div style="margin-left: ${(depth + 1) * 20}px; padding: 2px 0; color: #999; font-size: 11px;">... ${sortedChildren.length - 10} more</div>`;
}
}
return html;
}
let treeHtml = `
<div style="max-height: 600px; overflow-y: auto; border: 1px solid #ddd; padding: 15px; background: #f9f9f9;">
<h4 style="margin: 0 0 15px 0;">🌳 CPU调用栈树状视图</h4>
<div style="font-size: 11px; color: #666; margin-bottom: 10px;">
格式: 百分比 方法名 (采样次数) | 按CPU占用排序
</div>
`;
if (root.children && root.children.length > 0) {
const sortedChildren = [...root.children].sort((a, b) => b.value - a.value);
for (const child of sortedChildren) {
treeHtml += renderNode(child);
}
}
treeHtml += `</div>`;
document.getElementById('chart').innerHTML = treeHtml;
}
async function enableSampling() {
try {
const response = await fetch('/api/sampling/enable', { method: 'POST' });
const data = await response.json();
showSuccess(data.message);
await updateStatus();
} catch (error) {
showError('启用采样失败: ' + error.message);
}
}
async function disableSampling() {
try {
const response = await fetch('/api/sampling/disable', { method: 'POST' });
const data = await response.json();
showSuccess(data.message);
await updateStatus();
} catch (error) {
showError('停止采样失败: ' + error.message);
}
}
async function clearData() {
if (!confirm('确定要清空所有采样数据吗?')) {
return;
}
try {
const response = await fetch('/api/sampling/clear', { method: 'POST' });
const data = await response.json();
showSuccess(data.message);
await updateStatus();
document.getElementById('chart').innerHTML = '';
document.getElementById('noData').style.display = 'block';
} catch (error) {
showError('清空数据失败: ' + error.message);
}
}
async function showDebugInfo() {
try {
const response = await fetch('/api/sampling/debug');
const data = await response.json();
let debugHtml = `
<div class="info">
<strong>🔍 调试信息</strong><br>
采样状态: ${data.enabled ? '启用' : '禁用'}<br>
数据条目数: ${data.stackCountSize}<br>
<strong>示例数据:</strong><br>
`;
if (data.sampleData && Object.keys(data.sampleData).length > 0) {
for (const [stack, count] of Object.entries(data.sampleData)) {
debugHtml += `<small>${stack} (${count})</small><br>`;
}
} else {
debugHtml += '<small>暂无采样数据</small><br>';
}
debugHtml += '</div>';
const testResult = document.getElementById('testResult');
testResult.innerHTML = debugHtml;
setTimeout(() => {
testResult.innerHTML = '';
}, 15000);
} catch (error) {
showError('获取调试信息失败: ' + error.message);
}
}
async function showRawData() {
try {
const response = await fetch('/api/flamegraph');
const data = await response.text();
let rawHtml = `
<div class="info">
<strong>📄 原始火焰图数据</strong><br>
<small>格式: 调用栈 采样次数</small><br><br>
<pre style="font-size: 11px; max-height: 300px; overflow-y: auto; background: #f8f9fa; padding: 10px; border-radius: 4px;">`;
if (data && data.trim() && !data.startsWith('#')) {
const lines = data.trim().split('\n');
const displayLines = lines.slice(0, 50); // 只显示前50行
rawHtml += displayLines.join('\n');
if (lines.length > 50) {
rawHtml += '\n... (' + (lines.length - 50) + ' more lines)';
}
} else {
rawHtml += '暂无原始数据\n\n建议:\n1. 确保采样已启用\n2. 运行一些测试任务\n3. 等待几秒钟收集数据';
}
rawHtml += '</pre></div>';
const testResult = document.getElementById('testResult');
testResult.innerHTML = rawHtml;
setTimeout(() => {
testResult.innerHTML = '';
}, 20000);
} catch (error) {
showError('获取原始数据失败: ' + error.message);
}
}
// 测试函数
async function testCpuIntensive() {
showTestLoading('正在执行CPU密集型任务...');
// 执行前检查采样数据
console.log('=== 执行CPU密集型任务前的采样数据 ===');
await checkSamplingData();
try {
const response = await fetch('/test/cpu-intensive?iterations=2000');
if (!response.ok) {
throw new Error(`HTTP ${response.status}: ${response.statusText}`);
}
const data = await response.json();
console.log('CPU intensive test response:', data);
showTestResult('CPU密集型任务完成', data);
// 执行后等待一段时间让采样器收集数据
setTimeout(async () => {
console.log('=== 执行CPU密集型任务后的采样数据 ===');
await checkSamplingData();
}, 2000);
} catch (error) {
console.error('CPU intensive test error:', error);
showTestError('CPU密集型任务失败: ' + error.message);
}
}
async function testNestedCalls() {
showTestLoading('正在执行嵌套调用测试...');
console.log('=== 执行嵌套调用测试前的采样数据 ===');
await checkSamplingData();
try {
const response = await fetch('/test/nested-calls?depth=15');
if (!response.ok) {
throw new Error(`HTTP ${response.status}: ${response.statusText}`);
}
const data = await response.json();
console.log('Nested calls test response:', data);
showTestResult('嵌套调用测试完成', data);
setTimeout(async () => {
console.log('=== 执行嵌套调用测试后的采样数据 ===');
await checkSamplingData();
}, 2000);
} catch (error) {
console.error('Nested calls test error:', error);
showTestError('嵌套调用测试失败: ' + error.message);
}
}
async function testMixedWorkload() {
showTestLoading('正在执行混合工作负载...');
console.log('=== 执行混合工作负载前的采样数据 ===');
await checkSamplingData();
try {
const response = await fetch('/test/mixed-workload');
if (!response.ok) {
throw new Error(`HTTP ${response.status}: ${response.statusText}`);
}
const data = await response.json();
console.log('Mixed workload test response:', data);
showTestResult('混合工作负载完成', data);
setTimeout(async () => {
console.log('=== 执行混合工作负载后的采样数据 ===');
await checkSamplingData();
}, 2000);
} catch (error) {
console.error('Mixed workload test error:', error);
showTestError('混合工作负载失败: ' + error.message);
}
}
async function checkSamplingData() {
try {
const response = await fetch('/api/flamegraph');
const data = await response.text();
console.log('当前采样数据长度:', data.length);
console.log('当前采样数据前300字符:', data.substring(0, 300));
const lines = data.trim().split('\n').filter(line => line.trim() && !line.startsWith('#'));
console.log('有效数据行数:', lines.length);
const businessLines = lines.filter(line => line.includes('com.example'));
console.log('包含业务代码的行数:', businessLines.length);
if (businessLines.length > 0) {
console.log('业务代码示例:', businessLines.slice(0, 3));
}
} catch (error) {
console.error('检查采样数据失败:', error);
}
}
function showSuccess(message) {
showNotification(message, 'success');
}
function showError(message) {
showNotification(message, 'error');
}
function showNotification(message, type) {
const notification = document.createElement('div');
notification.className = type === 'success' ? 'info' : 'error';
notification.textContent = message;
const controls = document.querySelector('.controls');
controls.parentNode.insertBefore(notification, controls.nextSibling);
setTimeout(() => {
notification.remove();
}, 5000);
}
function showTestLoading(message) {
const testResult = document.getElementById('testResult');
testResult.innerHTML = `<div class="info">${message}</div>`;
}
function showTestResult(title, data) {
console.log('Test result data:', data); // 调试信息
const testResult = document.getElementById('testResult');
const executionTime = data.executionTimeMs || data.executionTime || 0;
const resultValue = data.result ? data.result.toFixed(2) : 'N/A';
testResult.innerHTML = `
<div class="info">
<strong>${title}</strong><br>
执行时间: ${executionTime}ms<br>
${data.result ? '结果: ' + resultValue : ''}
${data.iterations ? '<br>迭代次数: ' + data.iterations : ''}
${data.depth ? '<br>递归深度: ' + data.depth : ''}
${data.cpuResult ? '<br>CPU结果: ' + data.cpuResult.toFixed(2) : ''}
${data.ioResult ? '<br>IO结果: ' + data.ioResult.toFixed(2) : ''}
${data.finalResult ? '<br>最终结果: ' + data.finalResult.toFixed(2) : ''}
</div>
`;
setTimeout(() => {
testResult.innerHTML = '';
}, 10000);
}
function showTestError(message) {
const testResult = document.getElementById('testResult');
testResult.innerHTML = `<div class="error">${message}</div>`;
setTimeout(() => {
testResult.innerHTML = '';
}, 10000);
}
// 窗口大小改变时重新调整火焰图
window.addEventListener('resize', function() {
if (flameChart && document.getElementById('chart').hasChildNodes()) {
initFlameGraph();
refreshFlameGraph();
}
});
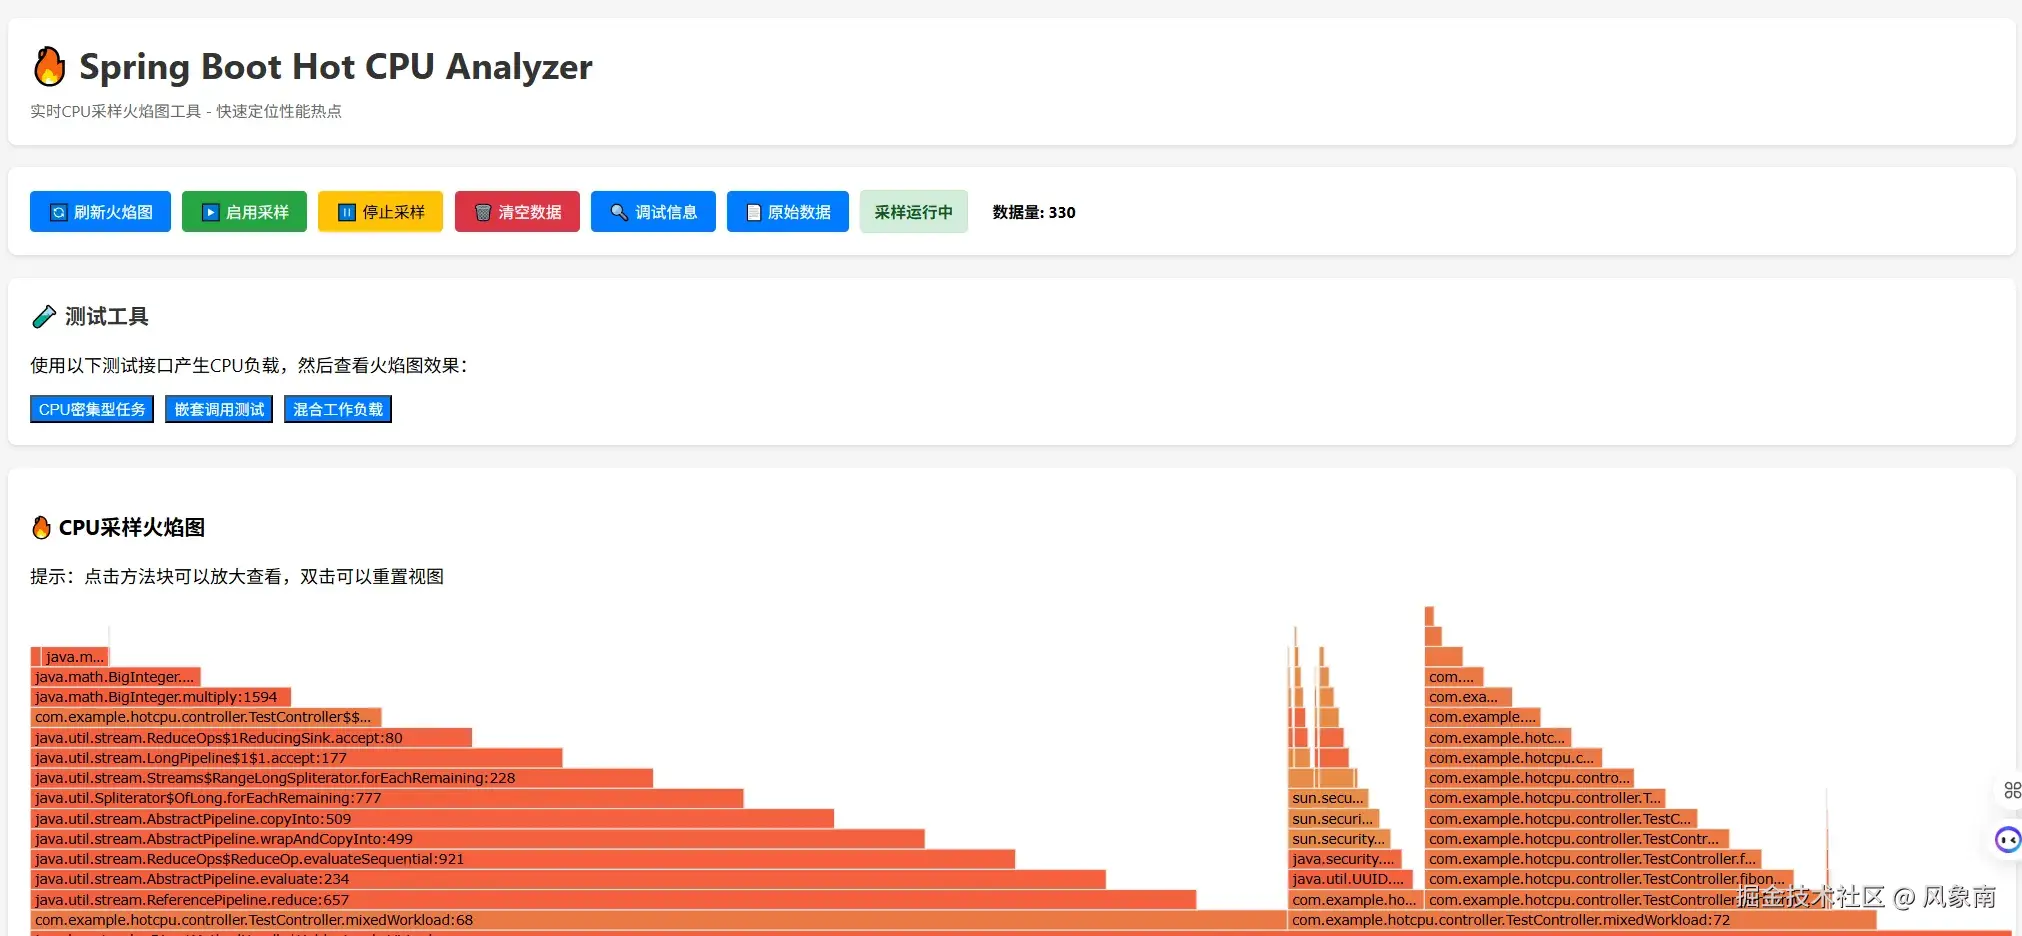
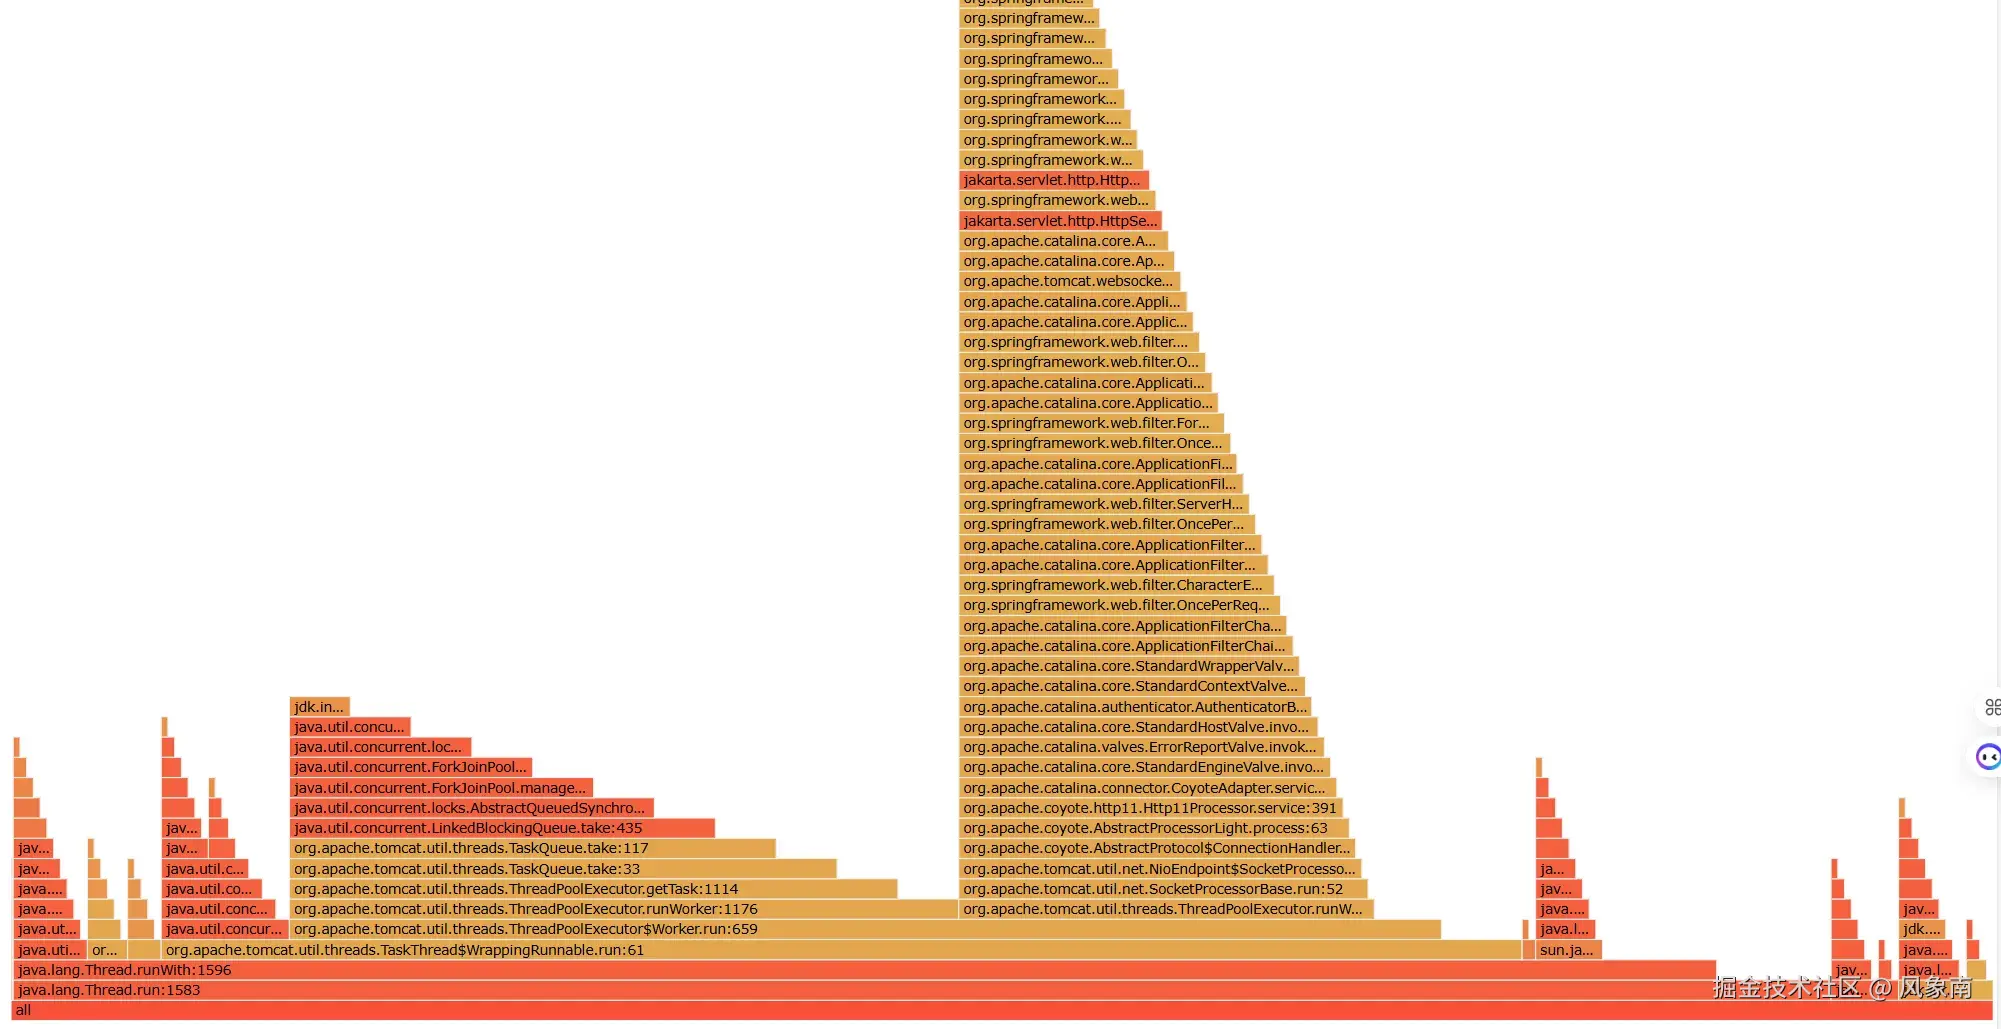
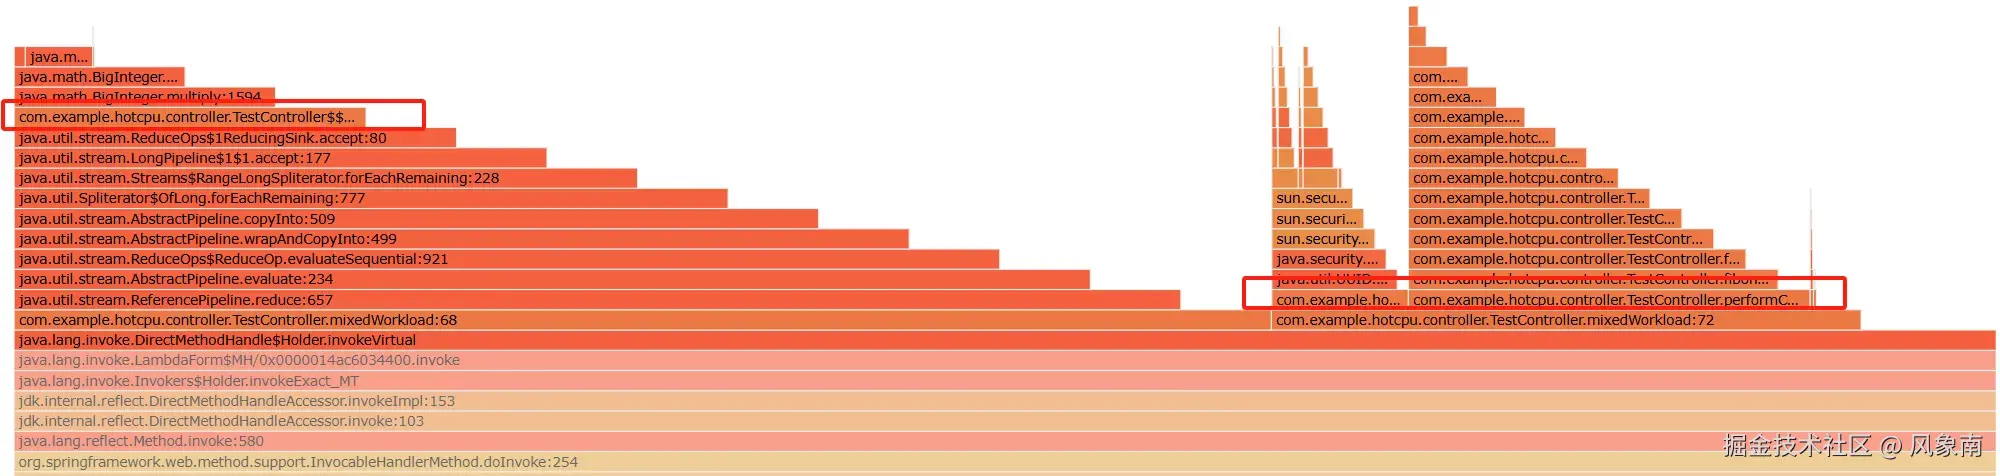
</script>这样,访问 /index.html 就能直接看到 交互式火焰图 了。
五、实战应用场景
1. CPU 突然飙高 :马上打开 flamegraph 页面,一眼就能看到是 XxxService.doQuery() 占比较高。
2. 定时任务异常:有些死循环、重试逻辑,传统日志难发现,但火焰图能直接看出占比最高的方法。
3. 性能优化前后对比:采集一段时间的火焰图,优化后再对比,能量化效果。
六、总结
通过上面的方式,我们用 极少的代码 在 SpringBoot 程序里实现了一个轻量级的 CPU 火焰图采样器。
1、不依赖第三方大工具,随项目自带
2、方法级别可视化,能快速定位 CPU 热点;
3、火焰图展示直观、体验好;
当然,这种方案有局限:
1、采样频率过高会带来一定开销
2、精度比不上专业的 async-profiler
3、火焰图数据需要定期清理,避免内存膨胀。