前言
你是否也好奇前端能不能实现地铁线路图的效果,答案是可以的。 本文将使用Trae帮我们实现地铁线路图的效果,并且通过SVG实现鼠标跟随效果。
为啥使用SVG?
SVG是可缩放矢量图形(Scalable Vector Graphics)的简称,SVG 使用 XML 格式定义图像。 SVG 图像在放大或改变尺寸的情况下其图形质量不会有所损失。 SVG 是万维网联盟的标准,SVG 与诸如 DOM 和 XSLF 等W3C标准是一个整体。
实现难度
地铁线路图本质上是一种复杂的数据可视化应用,它需要将抽象的地理位置、线路连接关系转化为直观的视觉表达。
Trae AI在这一过程中展现出了卓越的数据建模和可视化能力,它不仅能够理解地铁线路的数据结构,还能够将其转化为美观、易用的交互式图形。
还有可以使用Echart实现,但是Echart实现起来比较复杂,需要自己绘制地铁线路图,而Trae AI则可以直接使用现成的SVG文件,大大简化了开发过程。
SVG实现地铁线路图
SVG简介
SVG 是一种基于 XML 的图像格式,用于描述二维矢量图形。SVG 图像可以无限放大而不失真,并且可以与 CSS 和 JavaScript 一起使用,以实现交互性和动画效果。
对Trae进行提问
使用最简单高效的方法实现这个地铁线路图 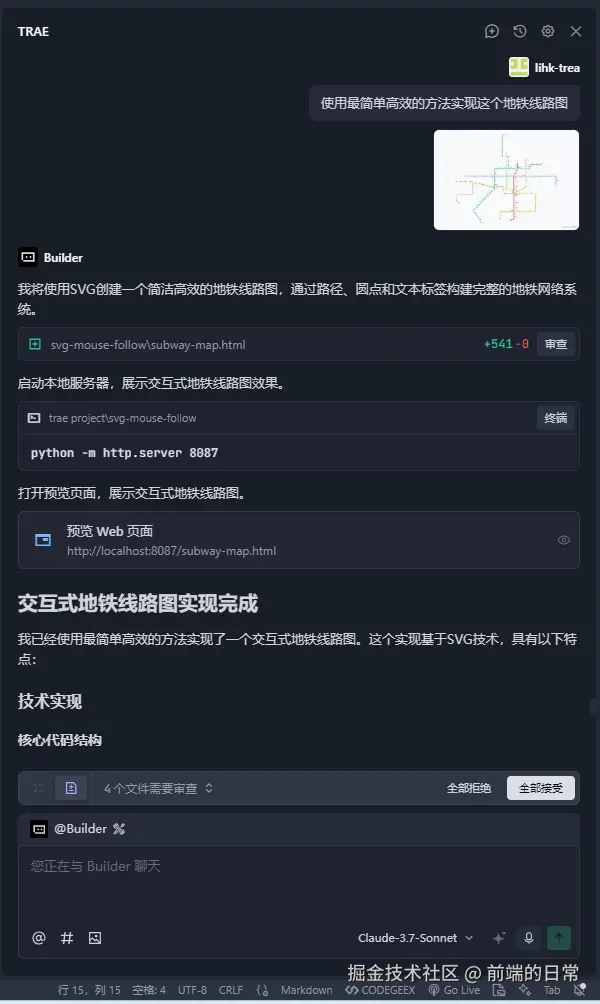
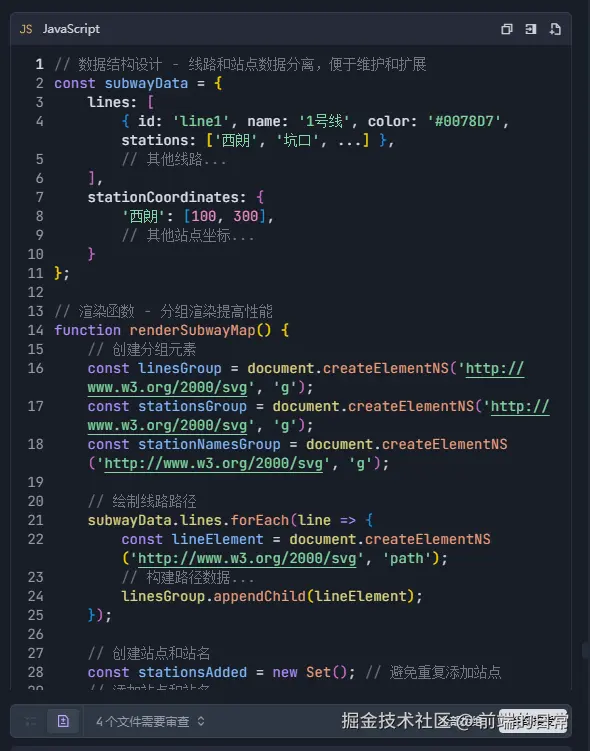
Trae的核心代码结构
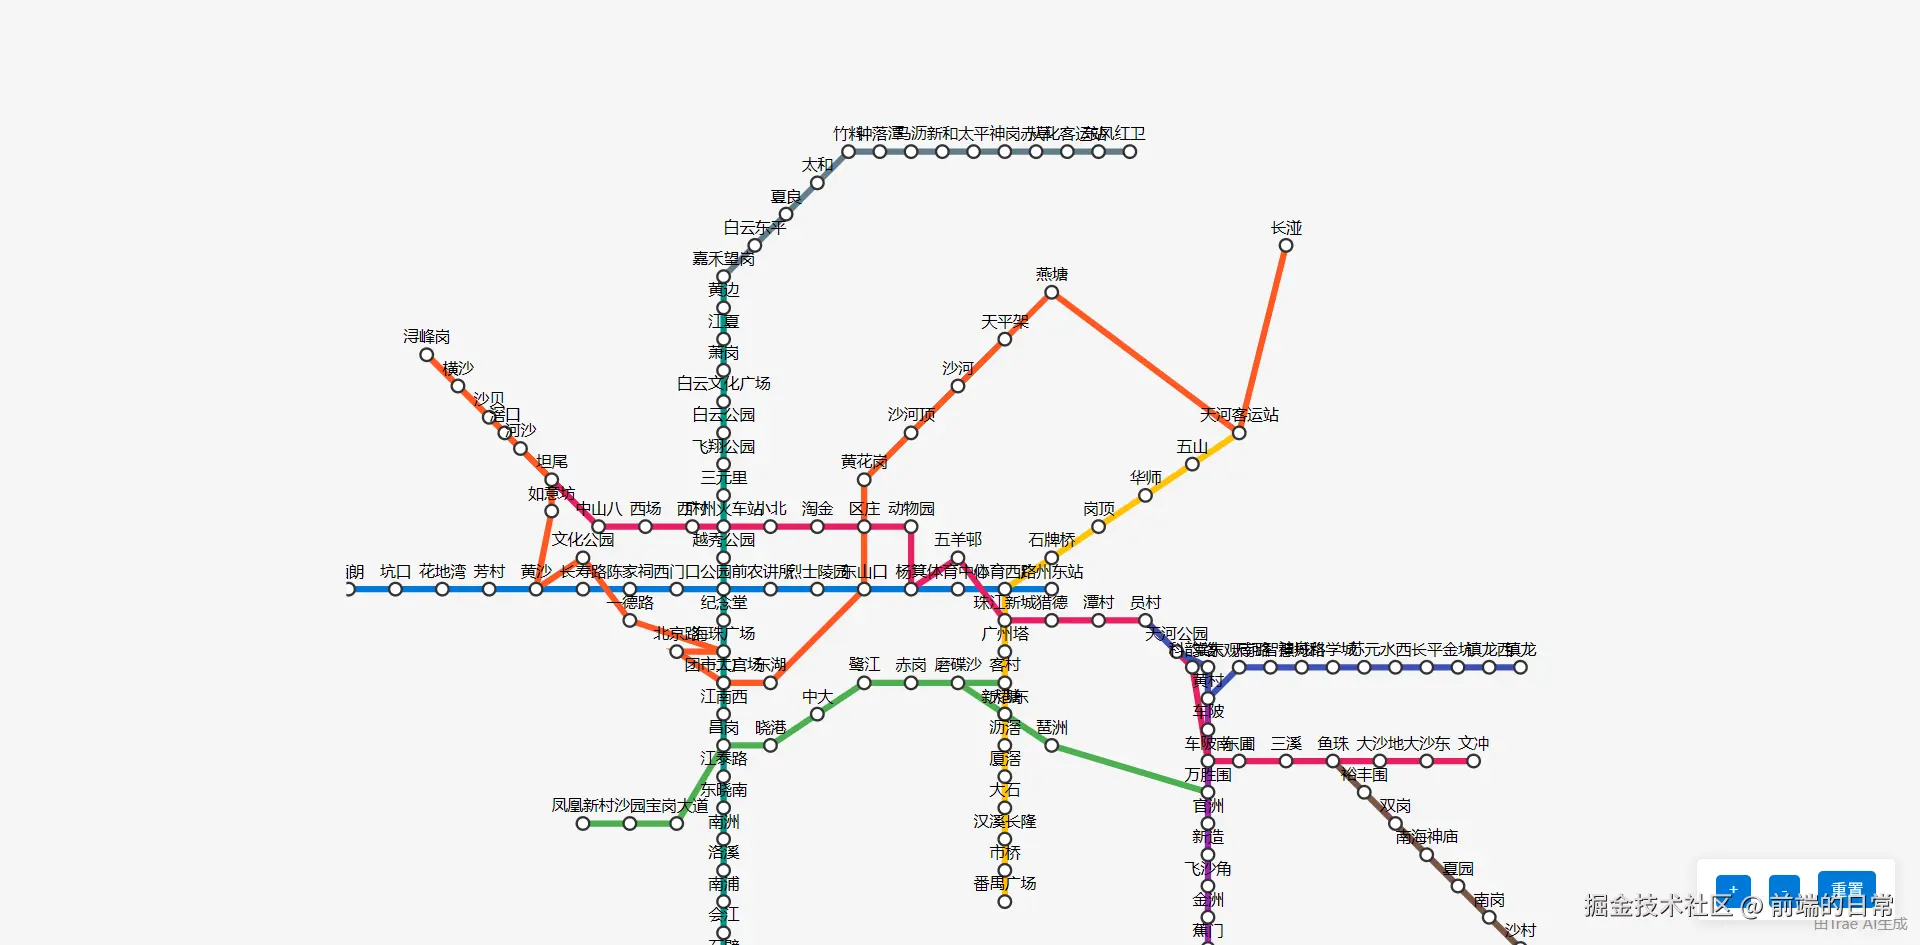
看看最终的效果
效果可能不是很好,但是已经实现了,并且可以无限放大,并且可以与 CSS 和 JavaScript 一起使用,以实现交互性和动画效果。
如果你有想法,可以让Trae将细节完善好,比如调整间距之类的。 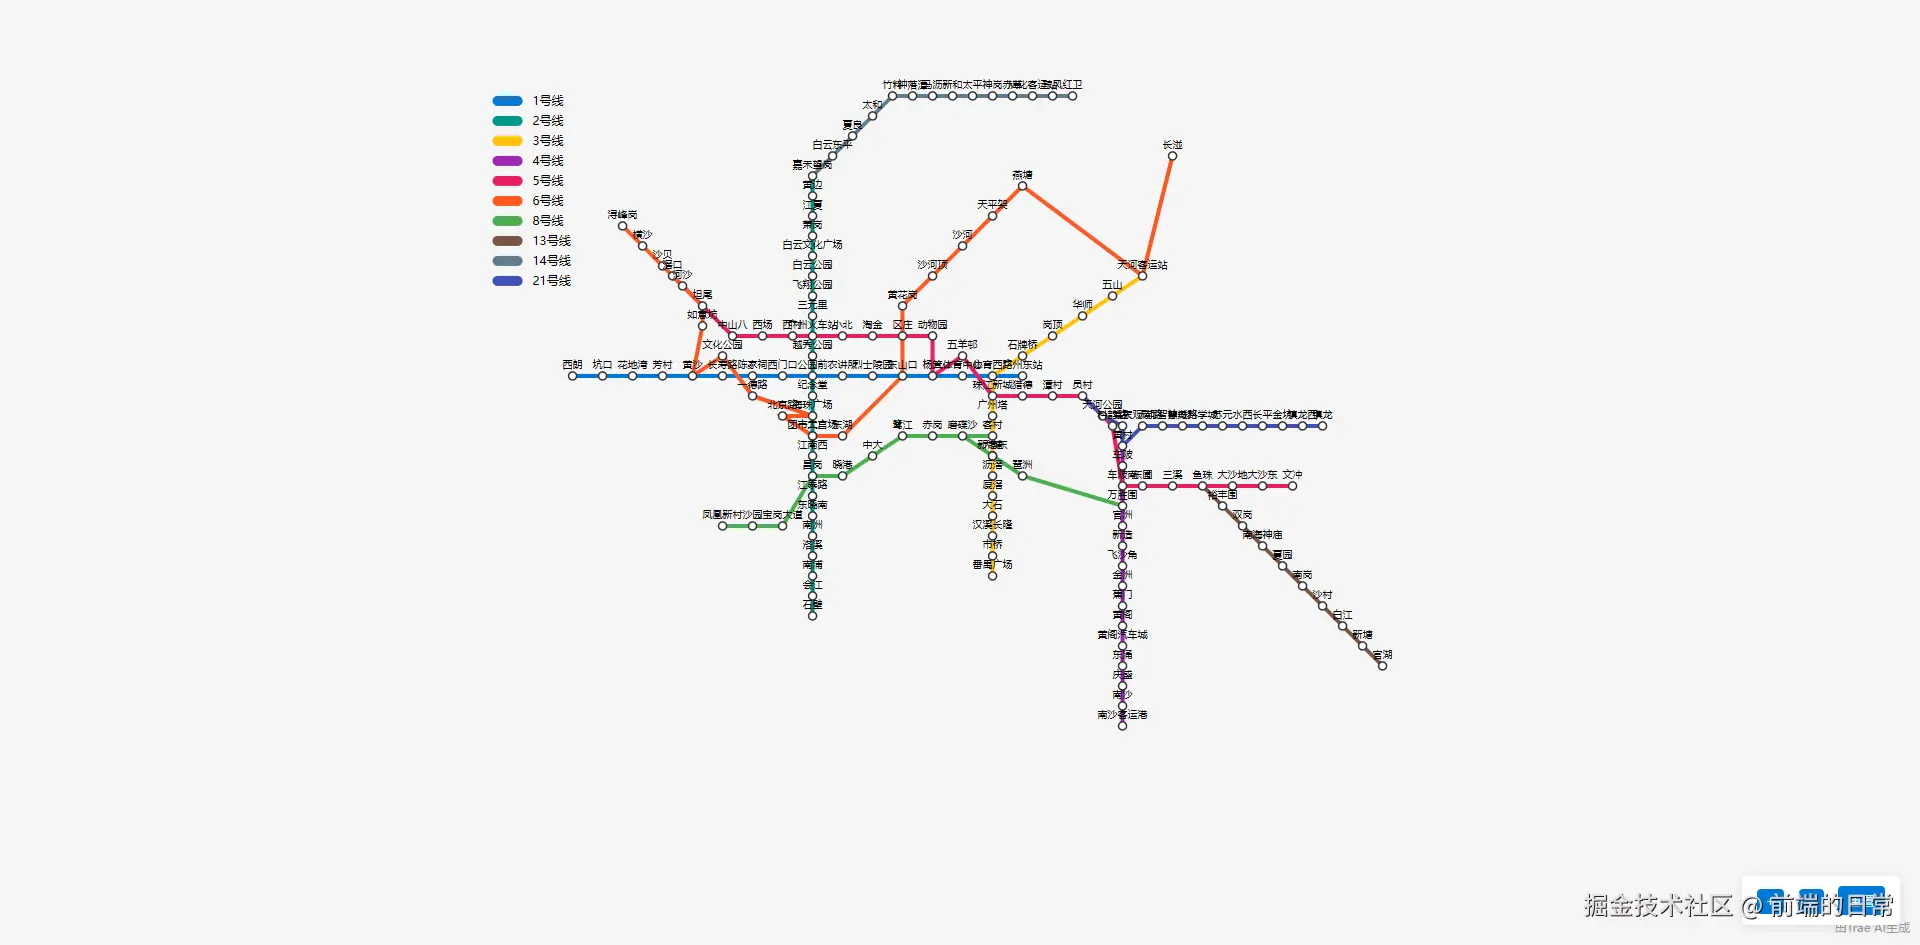
Trae代码解读
地铁线路数据 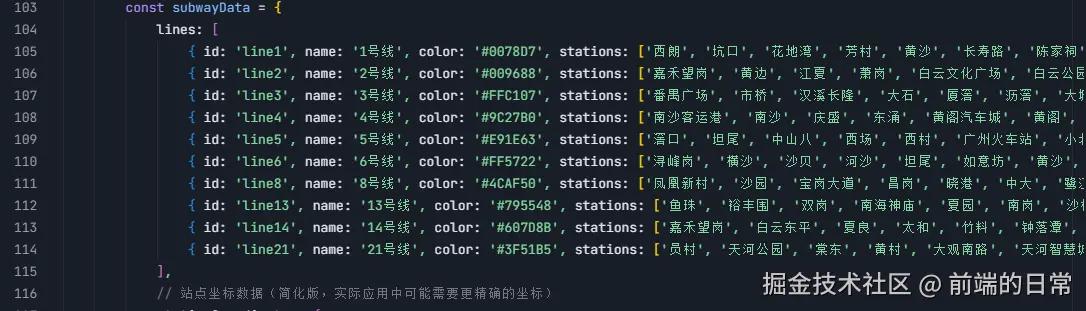 站点坐标数据(简化版,实际应用中可能需要更精确的坐标)
 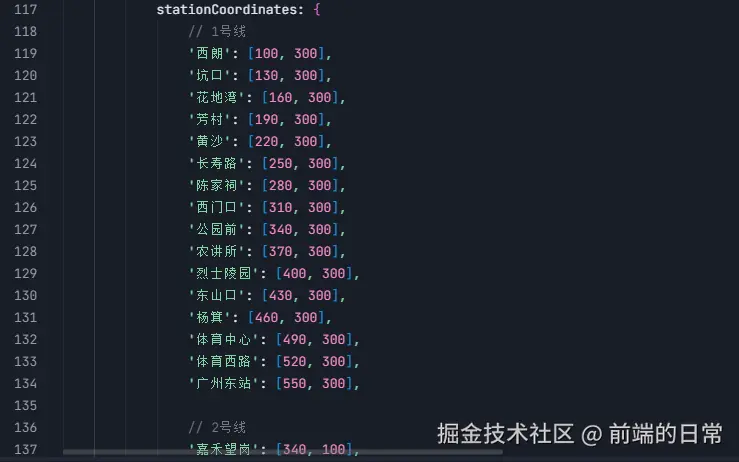 初始化SVG元素
ini
const svg = document.getElementById('subway-map');
const tooltip = document.querySelector('.tooltip');
let isDragging = false;
let startPoint = { x: 0, y: 0 };
let viewBox = { x: 0, y: 0, width: 1000, height: 800 };
let currentScale = 1;
绘制地铁线路和站点,创建线路组、创建站点组、绘制站点、绘制线路
ini
        function renderSubwayMap() {
            // 清空SVG
            svg.innerHTML = '';

            const linesGroup = document.createElementNS('http://www.w3.org/2000/svg', 'g');
            linesGroup.setAttribute('class', 'lines');
            svg.appendChild(linesGroup);

            const stationsGroup = document.createElementNS('http://www.w3.org/2000/svg', 'g');
            stationsGroup.setAttribute('class', 'stations');
            svg.appendChild(stationsGroup);

            const stationNamesGroup = document.createElementNS('http://www.w3.org/2000/svg', 'g');
            stationNamesGroup.setAttribute('class', 'station-names');
            svg.appendChild(stationNamesGroup);

            subwayData.lines.forEach(line => {
                const lineElement = document.createElementNS('http://www.w3.org/2000/svg', 'path');
                lineElement.setAttribute('class', 'line');
                lineElement.setAttribute('id', line.id);
                lineElement.setAttribute('stroke', line.color);

                let pathData = '';
                line.stations.forEach((station, index) => {
                    const coords = subwayData.stationCoordinates[station];
                    if (coords) {
                        if (index === 0) {
                            pathData += `M${coords[0]},${coords[1]}`;
                        } else {
                            pathData += ` L${coords[0]},${coords[1]}`;
                        }
                    }
                });

                lineElement.setAttribute('d', pathData);
                linesGroup.appendChild(lineElement);
            });
工具提示函数
ini
function showTooltip(e) {
    const station = e.target.getAttribute('data-station');
    const stationName = e.target.getAttribute('data-station-name');
    tooltip.textContent = `${stationName}(${station})`;
    tooltip.style.opacity = '1';
    moveTooltip(e);
}
拖拽和缩放功能
javascript
    svg.addEventListener('mousedown', startDrag);
    svg.addEventListener('mousemove', drag);
    document.addEventListener('mouseup', endDrag);
    svg.addEventListener('wheel', zoom);
总结
通过以上步骤,我们成功创建了一个简单的地铁线路图,并添加了拖拽和缩放功能。这些功能使得用户可以更方便地查看和操作地图。
这次主要是练习了svg的使用,后续会继续完善这个项目,添加更多的功能,比如点击站点显示站点信息,添加站点之间的距离等等。
非常感谢Trae的帮助,他的生成的代码和指导对我完成这个项目非常有帮助。