demo源码运行环境以及配置
运行环境:依赖Node安装环境,需要安装Node。 运行工具:vscode或者其他工具。
配置方式:下载demo源码,vscode打开,然后顺序执行以下命令: (1)下载demo环境依赖包命令:npm install -g
(2)yarn install (3)启动demo命令:yarn dev (4)打包demo命令: yarn build:prod
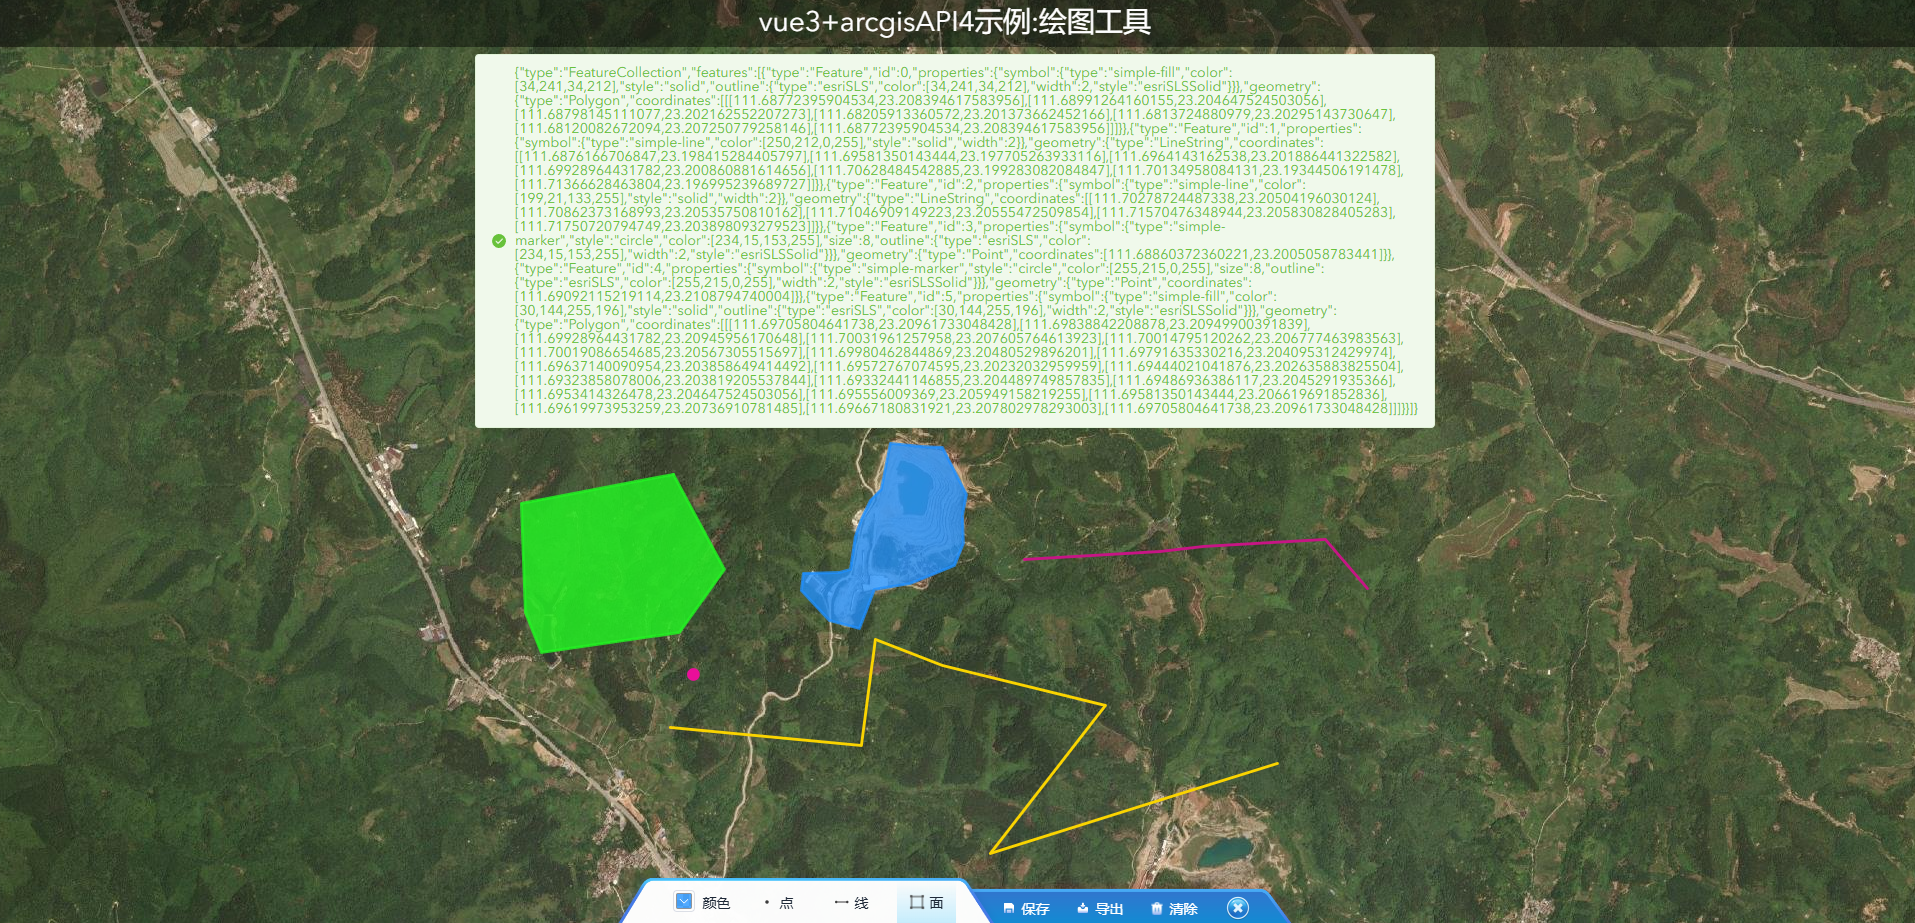
示例效果
核心部分代码
javascript
<template>
    <div v-if="isSHowPlotPanel" class="map-plot-panel">
        <div class="plot-img">
            <div class="plot-marginleft">
                <el-color-picker v-model="color" show-alpha :predefine="predefineColors" @change="handleColorChange" />
                <span class="plot-span ml8">颜色</span>
            </div>
            <div :class="['plot-marginleft-1', currentTool == 'point' && 'active']" @click="ceateActiveTool('point')">
                <img src="@/views/plotMap/assets/point.png" alt="" class="tool-icon">
                <span class="plot-span">点</span>
            </div>
            <div :class="['plot-marginleft-1', currentTool == 'polyline' && 'active']"
                @click="ceateActiveTool('polyline')">
                <img src="@/views/plotMap/assets/line.png" alt="" class="tool-icon">
                <span class="plot-span">线</span>
            </div>
            <div :class="['plot-marginleft-1', currentTool == 'polygon' && 'active']"
                @click="ceateActiveTool('polygon')">
                <img src="@/views/plotMap/assets/polygon.png" alt="" class="tool-icon">
                <span class="plot-span">面</span>
            </div>
            <div class="plot-marginleft-2" @click="savePlotData">
                <img src="@/views/plotMap/assets/save.png" alt="" class="tool-icon">
                <span class="plot-span-1">保存</span>
            </div>
            <div class="plot-marginleft-3" @click="exportPlotData">
                <img src="@/views/plotMap/assets/export.png" alt="" class="tool-icon">
                <span class="plot-span-1">导出</span>
            </div>
            <div class="plot-marginleft-3" @click="clearPlotData">
                <img src="@/views/plotMap/assets/delete.png" alt="" class="tool-icon">
                <span class="plot-span-1">清除</span>
            </div>
            <div class="plot-marginleft-3" title="关闭绘图工具" @click="closePlotPanel">
                <img src="@/views/plotMap/assets/close.png" alt="" class="tool-icon-1">
            </div>
        </div>
    </div>
    <div v-else class="map-plot-panel set-pointer-events" title="打开绘图工具" @click="openPlotPanel">
        <img src="@/views/plotMap/assets/side-collapse-up.png" alt="" class="tool-icon-2">
    </div>
</template>
<script setup>
import { onMounted, onUnmounted, ref, getCurrentInstance } from "vue";
import SketchViewModel from "@arcgis/core/widgets/Sketch/SketchViewModel.js";
import { xyToLngLat } from "@arcgis/core/geometry/support/webMercatorUtils.js";
import { ElMessage } from "element-plus";
const { proxy } = getCurrentInstance();
const currentTool = ref('');
const color = ref('rgba(72, 187, 250, 0.75)');
const predefineColors = ref([
    '#ff4500',
    '#ff8c00',
    '#ffd700',
    '#90ee90',
    '#00ced1',
    '#1e90ff',
    '#c71585',
    'rgba(255, 69, 0, 0.68)',
    'rgb(255, 120, 0)',
    'hsv(51, 100, 98)',
    'hsva(120, 40, 94, 0.5)',
    'hsl(181, 100%, 37%)',
    'hsla(209, 100%, 56%, 0.73)',
    '#c7158577',
])
const isSHowPlotPanel = ref(true);
let sketchViewModel = null;
let polygonSymbol = {
    type: "simple-fill",
    color: color.value,
    outline: {
        color: color.value,
        width: 2
    }
};
let polylineSymbol = {
    type: "simple-line",
    color: color.value,
    width: 2
};
let pointSymbol = {
    type: "simple-marker",
    style: "circle",
    color: color.value,
    size: 8,
    outline: {
        color: color.value,
        width: 2
    }
};
let view = null;
onMounted(() => {
    proxy.$Bus.on('init-PlotLayers', initPlotLayers);
});
onUnmounted(() => {
    proxy.$Bus.off('init-PlotLayers', initPlotLayers);
})
const initPlotLayers = (activeView) => {
    view = activeView;
    const plotLayer = view.map.findLayerById("plotLayer");
    if (plotLayer) {
        sketchViewModel = new SketchViewModel({
            view: view,
            layer: plotLayer,
            polygonSymbol: polygonSymbol,
            polylineSymbol: polylineSymbol,
            pointSymbol: pointSymbol,
            defaultCreateOptions: {
                hasZ: true  // default value
            },
            defaultUpdateOptions: {
                enableZ: true  // default value
            }
        });
        sketchViewModel.on("update", function (event) {
            if (event.state === "complete") {
                console.log("绘制完成");
                setGraphicsSymbol(event.graphics);
            }
        });
    }
}
//动态修改选中的绘制图形graphics
const setGraphicsSymbol = (graphics) => {
    if (graphics) {
        graphics.forEach((graphic) => {
            if (graphic.geometry.type === "point") {
                graphic.symbol = pointSymbol;
            } else if (graphic.geometry.type === "polyline") {
                graphic.symbol = polylineSymbol;
            } else if (graphic.geometry.type === "polygon") {
                graphic.symbol = polygonSymbol;
            }
        });
    }
}
const handleColorChange = (val) => {
    if (sketchViewModel) {
        // 更新符号颜色
        polygonSymbol.color = val;
        polygonSymbol.outline.color = val;
        polylineSymbol.color = val;
        pointSymbol.color = val;
        pointSymbol.outline.color = val;
        sketchViewModel.polygonSymbol = polygonSymbol;
        sketchViewModel.polylineSymbol = polylineSymbol;
        sketchViewModel.pointSymbol = pointSymbol;
        // 如果有需要可以在这里添加其他逻辑
        console.log('颜色已更新为:', val);
        sketchViewModel.cancel();
    }
};
// 绘制点线面
const ceateActiveTool = (activeTool) => {
    if (!sketchViewModel) return;
    if (sketchViewModel.activeTool === activeTool) {
        sketchViewModel.cancel();
        currentTool.value = '';
        return;
    }
    currentTool.value = activeTool;
    sketchViewModel.create(activeTool);
}
const openPlotPanel = () => {
    isSHowPlotPanel.value = true;
}
// 关闭绘制工具面板
const closePlotPanel = () => {
    // clearPlotData();
    isSHowPlotPanel.value = false;
}
const clearPlotData = () => {
    const plotLayer = view.map.findLayerById("plotLayer");
    if (plotLayer) {
        plotLayer.removeAll();
    }
    sketchViewModel.cancel();
}
const savePlotData = () => {
    const plotLayer = view.map.findLayerById("plotLayer");
    if (plotLayer) {
        const geoJSON = plotLayerToGeoJSON(plotLayer);
        // console.log('geoJSON', geoJSON);
        ElMessage.success(JSON.stringify(geoJSON));
    }
}
const exportPlotData = () => {
    const plotLayer = view.map.findLayerById("plotLayer");
    if (plotLayer) {
        const geoJSON = plotLayerToGeoJSON(plotLayer);
        // console.log('geoJSON', geoJSON);
        // ElMessage.success(JSON.stringify(geoJSON));
        const blob = new Blob([JSON.stringify(geoJSON)], { type: `application/json` });
        const blobUrl = URL.createObjectURL(blob);
        // 创建一个临时的<a>标签
        const downloadLink = document.createElement('a');
        downloadLink.href = blobUrl;
        // 指定下载文件名
        downloadLink.download = `geojson`;
        // 触发下载
        document.body.appendChild(downloadLink);
        downloadLink.click();
        // 清理临时创建的元素和URL对象
        document.body.removeChild(downloadLink);
        URL.revokeObjectURL(blobUrl);
    }
}
/**
 * 将plotLayer图层中的数据按照点线面分组转换为GeoJSON格式
 * @param {Object} plotLayer - 图层对象
 * @returns {Object} - 返回GeoJSON数据的对象
 */
const plotLayerToGeoJSON = (plotLayer) => {
    // 初始化结果对象
    const result = {
        type: "FeatureCollection",
        features: []
    };
    // 检查图层是否存在
    if (!plotLayer) {
        console.warn("plotLayer图层不存在");
        return result;
    }
    // 检查图层中是否有图形数据
    if (!plotLayer.graphics || plotLayer.graphics.length === 0) {
        console.warn("plotLayer图层中没有图形数据");
        return result;
    }
    // 遍历图层中的所有图形
    plotLayer.graphics.forEach((graphic, index) => {
        if (!graphic.geometry) return;
        // 根据几何类型分类
        const geometryType = graphic.geometry.type;
        let geoJSONType = "";
        let coordinates = [];
        let symbol = "";
        // 转换坐标和类型
        switch (geometryType) {
            case "point":
                geoJSONType = "Point";
                coordinates = [graphic.geometry.longitude, graphic.geometry.latitude];
                symbol = {
                    type: graphic.symbol?.type || "",
                    style: graphic.symbol?.style || "",
                    color: graphic.symbol?.color || "",
                    size: graphic.symbol?.size || "",
                    outline: graphic.symbol?.outline || ""
                };
                break;
            case "polyline":
                geoJSONType = "LineString";
                coordinates = graphic.geometry.paths[0].map(point => xyToLngLat(point[0], point[1]));
                symbol = {
                    type: graphic.symbol?.type || "",
                    color: graphic.symbol?.color || "",
                    style: graphic.symbol?.style || "",
                    width: graphic.symbol?.width || ""
                };
                break;
            case "polygon":
                geoJSONType = "Polygon";
                coordinates = [graphic.geometry.rings[0].map(point => xyToLngLat(point[0], point[1]))];
                symbol = {
                    type: graphic.symbol?.type || "",
                    color: graphic.symbol?.color || "",
                    style: graphic.symbol?.style || "",
                    outline: graphic.symbol?.outline || ""
                };
                break;
            default:
                return; // 跳过不支持的几何类型
        }
        // 创建GeoJSON特征对象
        const feature = {
            type: "Feature",
            id: index,
            properties: {
                // 添加属性信息,如果graphic有attributes则使用
                ...(graphic.attributes || {}),
                // 添加符号信息
                symbol: symbol
            },
            geometry: {
                type: geoJSONType,
                coordinates: coordinates
            }
        };
        result.features.push(feature);
    });
    return result;
}
</script>