文章的目的为了记录使用QT QML开发学习的经历。开发流程和要点有些记忆模糊,赶紧记录,防止忘记。
相关链接:
开源 C++ QT QML 开发(四)复杂控件--Listview
开源 C++ QT QML 开发(五)复杂控件--Gridview
推荐链接:
开源 C# 快速开发(十六)数据库--sqlserver增删改查
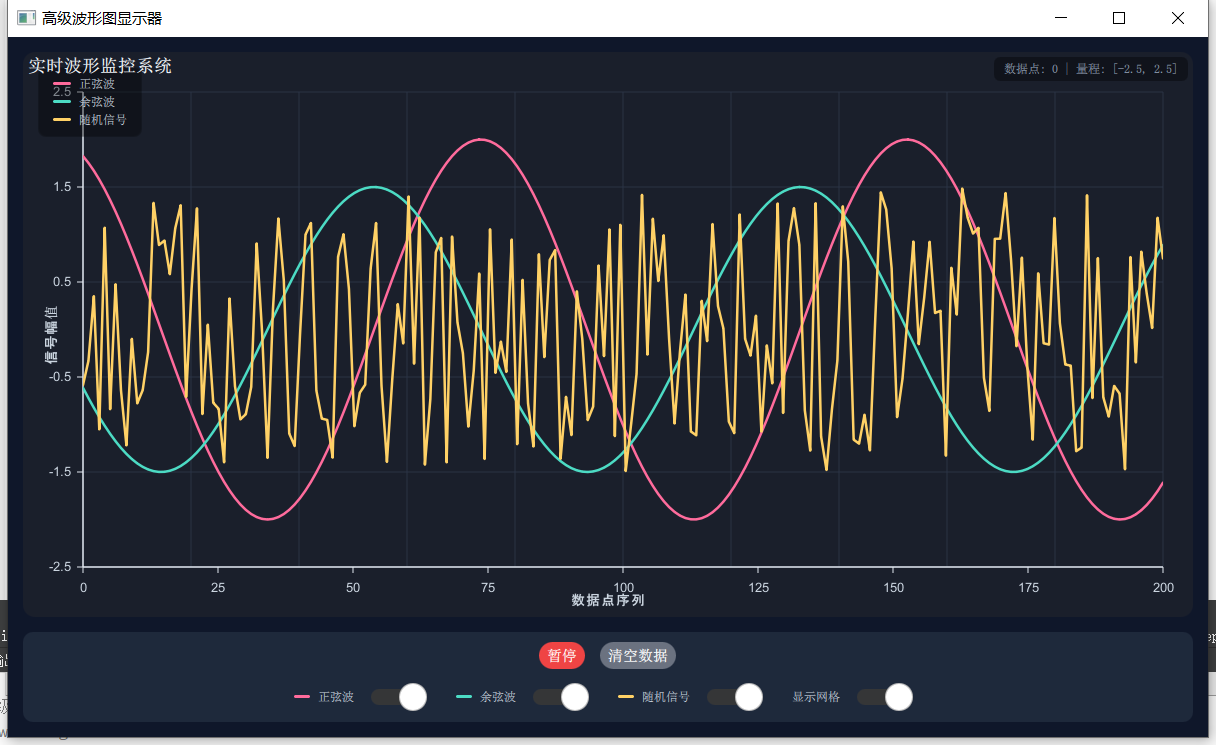
本章节主要内容是:介绍自定义控件的方法,自定义可设置参数的波形图为例,实现了可配置参数(数据点数量、Y轴范围)、支持多条曲线的波形显示功能,每1s对波形图控件进行数据更新。
1.代码分析
2.所有源码
3.效果演示
一、代码分析1. WaveformChart.qml 详细分析
1.1 属性定义部分
// 公共属性 - 可自定义
property int dataCount: 100  // 显示的数据点数量
property real yMin: -1.0     // Y轴最小值
property real yMax: 1.0      // Y轴最大值

// 三条曲线的配置
property var curves: [
    {
        name: "曲线1",
        color: "#FF6B9C",
        data: [],
        visible: true
    },
    // ... 其他曲线
]
功能分析:
dataCount: 控制显示的数据点数量,实现"到达显示数量后,只显示最近的数量的数据"
yMin/yMax: 定义Y轴量程,实现"量程可定义"
curves: 数组定义三条曲线,每条曲线包含名称、颜色、数据数组和可见性,实现"3条曲线,颜色可定义"
1.2 坐标系统属性
// 内边距 - 为坐标轴留出空间
property real paddingLeft: 60
property real paddingRight: 30
property real paddingTop: 40
property real paddingBottom: 50

// 计算实际绘图区域
property real plotWidth: width - paddingLeft - paddingRight
property real plotHeight: height - paddingTop - paddingBottom
property real xScale: plotWidth / Math.max(1, dataCount - 1)
功能分析:
内边距系统确保坐标轴标签不被裁剪
plotWidth/plotHeight: 计算实际可用于绘制波形的区域
xScale: 根据数据点数量计算X轴的缩放比例
1.3 数据管理函数
addDataPoint(index, value) 函数
function addDataPoint(index, value) {
    if (index < 0 || index >= curves.length) {
        console.warn("曲线索引超出范围")
        return
    }

    var curve = curves[index]
    curve.data.push(value)

    // 保持数据数量不超过设定值
    if (curve.data.length > dataCount) {
        curve.data.shift() // 移除最旧的数据
    }

    canvas.requestPaint()
}
详细分析:
参数验证: 检查曲线索引是否有效
数据添加: 使用 push() 将新数据添加到数组末尾
数据限制: 当数据量超过 dataCount 时,使用 shift() 移除数组开头的旧数据
重绘请求: 调用 requestPaint() 触发波形重绘
addDataPoints(index, values) 函数
function addDataPoints(index, values) {
    // ... 参数验证

    var curve = curves[index]
    curve.data = curve.data.concat(values)

    // 保持数据数量不超过设定值
    if (curve.data.length > dataCount) {
        curve.data = curve.data.slice(-dataCount)
    }

    canvas.requestPaint()
}
详细分析:
使用 concat() 批量添加数据
使用 slice(-dataCount) 保留最后 dataCount 个数据点
适用于需要一次性添加多个数据点的场景
clearData() 函数
function clearData() {
    for (var i = 0; i < curves.length; i++) {
        curves[i].data = []
    }
    canvas.requestPaint()
}
详细分析:
遍历所有曲线,清空数据数组
调用重绘以显示空白图表
setCurveVisibility(index, visible) 函数
function setCurveVisibility(index, visible) {
    if (index >= 0 && index < curves.length) {
        curves[index].visible = visible
        canvas.requestPaint()
    }
}
详细分析:
设置指定曲线的可见性
在重绘时根据 visible 属性决定是否绘制该曲线
1.4 绘图系统
网格绘制 (gridCanvas)
onPaint: {
    var ctx = getContext("2d")
    ctx.clearRect(0, 0, width, height)
    ctx.strokeStyle = gridColor
    ctx.lineWidth = 0.8
    ctx.beginPath()

    // 水平网格线
    var horizontalLines = 5
    for (var i = 0; i <= horizontalLines; i++) {
        var y = paddingTop + i * plotHeight / horizontalLines
        ctx.moveTo(paddingLeft, y)
        ctx.lineTo(width - paddingRight, y)
    }

    // ... 垂直网格线绘制
    ctx.stroke()
}
详细分析:
clearRect(): 清空画布
计算网格线位置基于内边距和绘图区域
使用循环绘制等间距的网格线
坐标轴绘制 (axisCanvas)
// Y轴刻度和标签
var ySteps = 5
ctx.textAlign = "right"
for (var i = 0; i <= ySteps; i++) {
    var yValue = yMax - (yMax - yMin) * i / ySteps
    var yPos = paddingTop + i * plotHeight / ySteps

    // 绘制刻度线
    ctx.strokeStyle = axisColor
    ctx.lineWidth = 1
    ctx.beginPath()
    ctx.moveTo(paddingLeft - 6, yPos)
    ctx.lineTo(paddingLeft, yPos)
    ctx.stroke()

    // 绘制刻度值
    ctx.fillText(yValue.toFixed(1), paddingLeft - 12, yPos)
}
详细分析:
计算刻度值:yMax - (yMax - yMin) * i / ySteps
计算刻度位置:paddingTop + i * plotHeight / ySteps
使用 fillText() 绘制刻度标签
toFixed(1) 控制数值显示精度
波形绘制 (canvas)
onPaint: {
    var ctx = getContext("2d")
    ctx.clearRect(0, 0, width, height)

    for (var i = 0; i < curves.length; i++) {
        var curve = curves[i]
        if (!curve.visible || curve.data.length === 0) continue

        ctx.strokeStyle = curve.color
        ctx.lineWidth = 2.5
        ctx.lineJoin = "round"
        ctx.lineCap = "round"
        ctx.beginPath()

        // 计算第一个点的位置
        var startX = 0
        var startY = plotHeight - ((curve.data[0] - yMin) / (yMax - yMin)) * plotHeight
        ctx.moveTo(startX, startY)

        // 绘制曲线
        for (var j = 1; j < curve.data.length; j++) {
            var x = j * xScale
            var y = plotHeight - ((curve.data[j] - yMin) / (yMax - yMin)) * plotHeight

            // 限制Y坐标在绘图区域内
            y = Math.max(0, Math.min(plotHeight, y))

            ctx.lineTo(x, y)
        }

        ctx.stroke()
    }
}
详细分析:
坐标计算:
y = plotHeight - ((dataValue - yMin) / (yMax - yMin)) * plotHeight
将数据值映射到画布坐标:(dataValue - yMin) / (yMax - yMin) 将数据归一化到 0,1 范围
plotHeight - ... 翻转Y轴(画布坐标系Y轴向下)
数据点处理:
ctx.moveTo(startX, startY): 移动到第一个数据点
ctx.lineTo(x, y): 连接到后续数据点
Math.max(0, Math.min(plotHeight, y)): 限制Y坐标在有效范围内
绘图样式:
lineJoin: "round": 线条连接处圆角
lineCap: "round": 线条端点圆角
lineWidth: 2.5: 线条粗细
- main.qml 详细分析
2.1 数据更新系统
定时器 (timer)
Timer {
    id: timer
    interval: 40  // 25Hz 更新,更流畅
    running: true
    repeat: true
    onTriggered: {
        updateWaveformData()
    }
}
详细分析:
interval: 40: 40毫秒间隔,实现25Hz刷新率
repeat: true: 重复执行
onTriggered: 每次触发时调用 updateWaveformData()
updateWaveformData() 函数
function updateWaveformData() {
    time += 0.08

    // 正弦波数据
    var sineValue = Math.sin(time) * 2.0
    waveformChart.addDataPoint(0, sineValue)

    // 余弦波数据
    var cosineValue = Math.cos(time) * 1.5
    waveformChart.addDataPoint(1, cosineValue)

    // 随机信号数据
    var randomValue = (Math.random() - 0.5) * 3
    waveformChart.addDataPoint(2, randomValue)
}
详细分析:
time += 0.08: 时间累加,控制波形变化速度
正弦波:Math.sin(time) * 2.0,幅度为2.0
余弦波:Math.cos(time) * 1.5,幅度为1.5
随机信号:(Math.random() - 0.5) * 3,范围-1.5, 1.5
2.2 布局系统
Column {
    anchors.fill: parent
    anchors.margins: 15
    spacing: 15

    WaveformChart {
        id: waveformChart
        width: parent.width
        height: parent.height - controlPanel.height - parent.spacing
        // ... 配置
    }

    Rectangle {
        id: controlPanel
        width: parent.width
        height: 90
        // ... 控制面板
    }
}
详细分析:
使用 Column 布局确保控制面板不会遮挡波形图
height: parent.height - controlPanel.height - parent.spacing: 动态计算波形图高度
这种布局方式解决了控制面板遮挡横坐标的问题
二、所有源码
WaveformChart.qml文件源码
// WaveformChart.qml
import QtQuick 2.12
import QtQuick.Shapes 1.12

Item {
    id: chartRoot

    // 公共属性 - 可自定义
    property int dataCount: 100  // 显示的数据点数量
    property real yMin: -1.0     // Y轴最小值
    property real yMax: 1.0      // Y轴最大值

    // 三条曲线的配置
    property var curves: [
        {
            name: "曲线1",
            color: "#FF6B9C",  // 柔和的粉色
            data: [],
            visible: true
        },
        {
            name: "曲线2",
            color: "#4CDBC4",  // 清新的青绿色
            data: [],
            visible: true
        },
        {
            name: "曲线3",
            color: "#FFD166",  // 明亮的黄色
            data: [],
            visible: true
        }
    ]

    // 背景属性 - 新的配色方案
    property color backgroundColor: "#1A1F2B"  // 深蓝灰色
    property color gridColor: "#2D3748"        // 中等蓝灰色
    property color axisColor: "#E2E8F0"        // 浅灰色
    property color textColor: "#CBD5E0"        // 中灰色
    property bool showGrid: true

    // 内边距 - 为坐标轴留出空间
    property real paddingLeft: 60
    property real paddingRight: 30
    property real paddingTop: 40
    property real paddingBottom: 50

    // 计算实际绘图区域
    property real plotWidth: width - paddingLeft - paddingRight
    property real plotHeight: height - paddingTop - paddingBottom
    property real xScale: plotWidth / Math.max(1, dataCount - 1)

    // 添加数据点
    function addDataPoint(index, value) {
        if (index < 0 || index >= curves.length) {
            console.warn("曲线索引超出范围")
            return
        }

        var curve = curves[index]
        curve.data.push(value)

        // 保持数据数量不超过设定值
        if (curve.data.length > dataCount) {
            curve.data.shift() // 移除最旧的数据
        }

        canvas.requestPaint()
    }

    // 批量添加数据
    function addDataPoints(index, values) {
        if (index < 0 || index >= curves.length) {
            console.warn("曲线索引超出范围")
            return
        }

        var curve = curves[index]
        curve.data = curve.data.concat(values)

        // 保持数据数量不超过设定值
        if (curve.data.length > dataCount) {
            curve.data = curve.data.slice(-dataCount)
        }

        canvas.requestPaint()
    }

    // 清空数据
    function clearData() {
        for (var i = 0; i < curves.length; i++) {
            curves[i].data = []
        }
        canvas.requestPaint()
    }

    // 设置曲线可见性
    function setCurveVisibility(index, visible) {
        if (index >= 0 && index < curves.length) {
            curves[index].visible = visible
            canvas.requestPaint()
        }
    }

    // 背景
    Rectangle {
        id: background
        anchors.fill: parent
        color: chartRoot.backgroundColor
        radius: 12

        // 网格线
        Canvas {
            id: gridCanvas
            anchors.fill: parent
            visible: showGrid

            onPaint: {
                var ctx = getContext("2d")
                ctx.clearRect(0, 0, width, height)
                ctx.strokeStyle = gridColor
                ctx.lineWidth = 0.8
                ctx.beginPath()

                // 水平网格线
                var horizontalLines = 5
                for (var i = 0; i <= horizontalLines; i++) {
                    var y = paddingTop + i * plotHeight / horizontalLines
                    ctx.moveTo(paddingLeft, y)
                    ctx.lineTo(width - paddingRight, y)
                }

                // 垂直网格线
                var verticalLines = 10
                for (var j = 0; j <= verticalLines; j++) {
                    var x = paddingLeft + j * plotWidth / verticalLines
                    ctx.moveTo(x, paddingTop)
                    ctx.lineTo(x, height - paddingBottom)
                }

                ctx.stroke()
            }
        }

        // 坐标轴和刻度
        Canvas {
            id: axisCanvas
            anchors.fill: parent

            onPaint: {
                var ctx = getContext("2d")
                ctx.clearRect(0, 0, width, height)

                // 设置文本样式
                ctx.fillStyle = textColor
                ctx.font = "13px Arial"
                ctx.textAlign = "center"
                ctx.textBaseline = "middle"

                // 绘制坐标轴线
                ctx.strokeStyle = axisColor
                ctx.lineWidth = 1.5
                ctx.beginPath()

                // X轴 (底部)
                ctx.moveTo(paddingLeft, height - paddingBottom)
                ctx.lineTo(width - paddingRight, height - paddingBottom)

                // Y轴 (左侧)
                ctx.moveTo(paddingLeft, paddingTop)
                ctx.lineTo(paddingLeft, height - paddingBottom)

                ctx.stroke()

                // Y轴刻度和标签
                var ySteps = 5
                ctx.textAlign = "right"
                for (var i = 0; i <= ySteps; i++) {
                    var yValue = yMax - (yMax - yMin) * i / ySteps
                    var yPos = paddingTop + i * plotHeight / ySteps

                    // 绘制刻度线
                    ctx.strokeStyle = axisColor
                    ctx.lineWidth = 1
                    ctx.beginPath()
                    ctx.moveTo(paddingLeft - 6, yPos)
                    ctx.lineTo(paddingLeft, yPos)
                    ctx.stroke()

                    // 绘制刻度值
                    ctx.fillText(yValue.toFixed(1), paddingLeft - 12, yPos)
                }

                // X轴刻度和标签
                var xSteps = 8
                ctx.textAlign = "center"
                ctx.textBaseline = "top"
                for (var j = 0; j <= xSteps; j++) {
                    var xPos = paddingLeft + j * plotWidth / xSteps

                    // 绘制刻度线
                    ctx.strokeStyle = axisColor
                    ctx.lineWidth = 1
                    ctx.beginPath()
                    ctx.moveTo(xPos, height - paddingBottom)
                    ctx.lineTo(xPos, height - paddingBottom + 6)
                    ctx.stroke()

                    // 绘制刻度值 (显示时间或数据点索引)
                    var labelValue = Math.round(j * dataCount / xSteps)
                    ctx.fillText(labelValue.toString(), xPos, height - paddingBottom + 12)
                }

                // 坐标轴标题
                ctx.textAlign = "center"
                ctx.font = "bold 14px Arial"

                // X轴标题 - 上移避免被遮挡
                ctx.fillText("数据点序列", width / 2, height - 25)

                // Y轴标题 - 垂直显示
                ctx.save()
                ctx.translate(20, height / 2)
                ctx.rotate(-Math.PI / 2)
                ctx.fillText("信号幅值", 0, 0)
                ctx.restore()
            }
        }

        // 波形绘制区域
        Canvas {
            id: canvas
            anchors {
                left: parent.left
                right: parent.right
                top: parent.top
                bottom: parent.bottom
                leftMargin: paddingLeft
                rightMargin: paddingRight
                topMargin: paddingTop
                bottomMargin: paddingBottom
            }

            onPaint: {
                var ctx = getContext("2d")
                ctx.clearRect(0, 0, width, height)

                // 绘制每条曲线
                for (var i = 0; i < curves.length; i++) {
                    var curve = curves[i]
                    if (!curve.visible || curve.data.length === 0) continue

                    ctx.strokeStyle = curve.color
                    ctx.lineWidth = 2.5
                    ctx.lineJoin = "round"
                    ctx.lineCap = "round"
                    ctx.beginPath()

                    // 计算第一个点的位置
                    var startX = 0
                    var startY = plotHeight - ((curve.data[0] - yMin) / (yMax - yMin)) * plotHeight
                    ctx.moveTo(startX, startY)

                    // 绘制曲线
                    for (var j = 1; j < curve.data.length; j++) {
                        var x = j * xScale
                        var y = plotHeight - ((curve.data[j] - yMin) / (yMax - yMin)) * plotHeight

                        // 限制Y坐标在绘图区域内
                        y = Math.max(0, Math.min(plotHeight, y))

                        ctx.lineTo(x, y)
                    }

                    ctx.stroke()
                }
            }
        }

        // 图例 - 移到左上角
        Rectangle {
            id: legendBackground
            anchors {
                top: parent.top
                left: parent.left
                margins: 15
            }
            width: legend.width + 20
            height: legend.height + 12
            color: "#60000000"
            radius: 8
            border {
                width: 1
                color: "#40000000"
            }

            Column {
                id: legend
                anchors.centerIn: parent
                spacing: 6
                padding: 5

                Repeater {
                    model: curves

                    Row {
                        spacing: 8

                        Rectangle {
                            width: 18
                            height: 3
                            color: modelData.color
                            radius: 1.5
                            anchors.verticalCenter: parent.verticalCenter
                        }

                        Text {
                            text: modelData.name
                            color: textColor
                            font {
                                pixelSize: 12
                            }
                            anchors.verticalCenter: parent.verticalCenter
                        }
                    }
                }
            }
        }
    }
}
main.qml文件源码
// main.qml
import QtQuick 2.12
import QtQuick.Window 2.12
import QtQuick.Controls 2.12

Window {
    width: 1200
    height: 700
    visible: true
    title: "高级波形图显示器"
    color: "#0F172A"  // 深蓝色背景

    // 主布局
    Column {
        anchors.fill: parent
        anchors.margins: 15
        spacing: 15

        // 波形图控件
        WaveformChart {
            id: waveformChart
            width: parent.width
            height: parent.height - controlPanel.height - parent.spacing
            dataCount: 200
            yMin: -2.5
            yMax: 2.5

            curves: [
                {
                    name: "正弦波",
                    color: "#FF6B9C",
                    data: [],
                    visible: true
                },
                {
                    name: "余弦波",
                    color: "#4CDBC4",
                    data: [],
                    visible: true
                },
                {
                    name: "随机信号",
                    color: "#FFD166",
                    data: [],
                    visible: true
                }
            ]
        }

        // 控制面板 - 现在不会遮挡图表
        Rectangle {
            id: controlPanel
            width: parent.width
            height: 90
            color: "#1E293B"
            radius: 10

            Column {
                anchors.fill: parent
                anchors.margins: 10
                spacing: 8

                // 第一行:主要控制按钮
                Row {
                    spacing: 15
                    anchors.horizontalCenter: parent.horizontalCenter

                    Button {
                        text: timer.running ? "暂停" : "开始"
                        background: Rectangle {
                            color: timer.running ? "#EF4444" : "#10B981"
                            radius: 18
                        }
                        contentItem: Text {
                            text: parent.text
                            color: "white"
                            font.bold: true
                            horizontalAlignment: Text.AlignHCenter
                            verticalAlignment: Text.AlignVCenter
                        }
                        onClicked: timer.running = !timer.running
                    }

                    Button {
                        text: "清空数据"
                        background: Rectangle {
                            color: "#6B7280"
                            radius: 18
                        }
                        contentItem: Text {
                            text: parent.text
                            color: "white"
                            font.bold: true
                            horizontalAlignment: Text.AlignHCenter
                            verticalAlignment: Text.AlignVCenter
                        }
                        onClicked: waveformChart.clearData()
                    }
                }

                // 第二行:曲线控制和设置
                Row {
                    spacing: 20
                    anchors.horizontalCenter: parent.horizontalCenter

                    Repeater {
                        model: waveformChart.curves.length

                        Row {
                            spacing: 8

                            Rectangle {
                                width: 16
                                height: 3
                                color: waveformChart.curves[index].color
                                radius: 1.5
                                anchors.verticalCenter: parent.verticalCenter
                            }

                            Text {
                                text: waveformChart.curves[index].name
                                color: "#CBD5E0"
                                font.pixelSize: 12
                                anchors.verticalCenter: parent.verticalCenter
                            }

                            Switch {
                                checked: waveformChart.curves[index].visible
                                onCheckedChanged: waveformChart.setCurveVisibility(index, checked)
                            }
                        }
                    }

                    // 网格开关
                    Row {
                        spacing: 8

                        Text {
                            text: "显示网格"
                            color: "#CBD5E0"
                            font.pixelSize: 12
                            anchors.verticalCenter: parent.verticalCenter
                        }

                        Switch {
                            checked: waveformChart.showGrid
                            onCheckedChanged: waveformChart.showGrid = checked
                        }
                    }
                }
            }
        }
    }

    // 状态信息 - 右上角
    Rectangle {
        anchors {
            top: parent.top
            right: parent.right
            margins: 20
        }
        width: statusText.width + 20
        height: statusText.height + 12
        color: "#60000000"
        radius: 6

        Text {
            id: statusText
            anchors.centerIn: parent
            text: "数据点: " + (waveformChart.curves[0].data ? waveformChart.curves[0].data.length : 0) +
                  " | 量程: [" + waveformChart.yMin + ", " + waveformChart.yMax + "]"
            color: "#94A3B8"
            font.pixelSize: 12
        }
    }

    // 标题
    Text {
        anchors {
            top: parent.top
            left: parent.left
            margins: 20
        }
        text: "实时波形监控系统"
        color: "#F1F5F9"
        font {
            pixelSize: 18
            bold: true
        }
    }

    // 数据更新定时器
    Timer {
        id: timer
        interval: 40  // 25Hz 更新,更流畅
        running: true
        repeat: true
        onTriggered: {
            updateWaveformData()
        }
    }

    // 时间计数器
    property real time: 0

    // 更新波形数据
    function updateWaveformData() {
        time += 0.08

        // 正弦波数据
        var sineValue = Math.sin(time) * 2.0
        waveformChart.addDataPoint(0, sineValue)

        // 余弦波数据
        var cosineValue = Math.cos(time) * 1.5
        waveformChart.addDataPoint(1, cosineValue)

        // 随机信号数据
        var randomValue = (Math.random() - 0.5) * 3
        waveformChart.addDataPoint(2, randomValue)
    }

    Component.onCompleted: {
        console.log("高级波形图系统初始化完成")
    }
}
三、效果演示