ArcGIS JSAPI 高级教程 - 添加大量北斗网格码几何数据 - 性能优化 - 10W 级(合并 Mesh)
在 arcgis js 中,一般不推荐在客户端创建、加载大量几何数据(Graphic 和 GraphicLayer)。
具体见:ArcGIS JSAPI 高级教程 - 异步(async - Promise)添加大量北斗网格码(Mesh - Graphic)
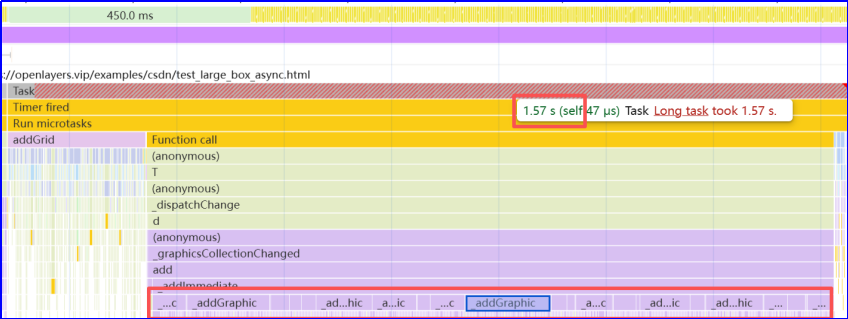
后经过尝试发现,以往在客户端创建大量数据时,主要由于创建大量 Mesh 和 Graphic(每个几何体对应一个 Mesh 和一个 Graphic),内存占用过多,导致浏览器内存溢出;


或者是数据解析时长时间占用主线程,导致页面卡顿;另外,由于加载机制的因素,也会导致帧率急剧下降。
对于这种情况,目前有两种优化方案:
1. 合并 Mesh 对象(维持正常帧率加载 10W 级数据)。
2. 合并顶点、索引(维持正常帧率加载 100W 级数据)。
本文介绍一下通过合并 Mesh 对象的方式添加大量几何数据。
本文包括 核心代码、完整代码以及在线示例。
核心代码
通过合并 Mesh 对象,可以避免大量创建 Graphic 对象,对于优化加载和渲染效果作用很明显。
不过也存在一些弊端,如:创建 Mesh 对象也占用较多内存(可通过合并顶点、索引进一步优化);另外,合并 Mesh 之后,无法点击 box。
javascript
// 解析数据
const {CenterPoint: centerWebMercator, BBox: bboxData} = data;
const totalLength = bboxData.length;

console.log('box 个数:', totalLength);

// 预计算总批次数用于进度跟踪
const totalBatches = Math.ceil(totalLength / batchSize);

// 中心点
const centerPoint = new Point({
    x: centerWebMercator.x,
    y: centerWebMercator.y,
    z: centerWebMercator.z,
    spatialReference
});

// 分批处理数据
for (let batchIndex = 0; batchIndex < totalBatches; batchIndex++) {

    // 计算当前批次的索引范围
    const startIndex = batchIndex * batchSize;
    const endIndex = Math.min(startIndex + batchSize, totalLength);
    const batch = bboxData.slice(startIndex, endIndex);

    // 转换为 Mesh 实例
    const boxes = batch.map(datum => {

        centerPoint.x = centerWebMercator.x + datum.posX;
        centerPoint.y = centerWebMercator.y + datum.posZ;
        centerPoint.z = centerWebMercator.z + datum.posY;

        return Mesh.createBox(
            centerPoint,
            {
                size: {
                    width: datum.lenX,
                    height: datum.lenY,
                    depth: datum.lenZ
                },
                vertexSpace: 'local',
            }
        );
    });

    // 批量添加图形
    layerGrid.add(new Graphic({
        // 每个批次合并网格, ${batchSize} 个 box 合并为一个 Mesh 对象
        geometry: meshUtils.merge(boxes),
        symbol: symbol
    }));

    const processedCount = Math.min(endIndex, totalLength);
    const progress = ((processedCount / totalLength) * 100).toFixed(1);
    console.log(`进度: ${processedCount}/${totalLength} (${progress}%)`);

    // 让出主线程,但避免过短的延迟
    if (batchIndex < totalBatches - 1) {
        // 1000/240 为帧率时间,这里暂停 8 帧用于加载数据
        await new Promise(resolve => setTimeout(resolve, 1000 / 240 * 8));
    }
}
完整代码
html
<!DOCTYPE html>
<html lang="en">

<head>
    <meta charset="utf-8">
    <meta http-equiv="X-UA-Compatible" content="IE=edge">
    <title>异步分批加载大量数据 - 合并 mesh</title>

    <link rel="stylesheet" href="https://openlayers.vip/arcgis_api/4.33/esri/themes/light/main.css"/>
    <script src="https://openlayers.vip/arcgis_api/4.33/init.js"></script>

    <script src="https://openlayers.vip/examples/resources/stats.min.js"></script>
    <script src="./data_.js"></script>

    <style>
        html,
        body,
        #viewDiv {
            padding: 0;
            margin: 0;
            height: 100%;
            width: 100%;
        }

        #loadingDiv {
            background-color: white;
            padding: 5px;
            margin-bottom: 50px;
            position: absolute;
            z-index: 2;
            bottom: 0;
            left: 48%;
            width: 100px;
            font-weight: bolder;
        }


        /* 去掉地图点击蓝色边框 */
        .esri-view .esri-view-surface--inset-outline:focus::after {
            outline: auto 0px Highlight !important;
            outline: auto 0px -webkit-focus-ring-color !important;
        }

    </style>
    <script>


        require([
            "esri/config",
            "esri/views/SceneView",
            "esri/layers/GraphicsLayer",
            "esri/Graphic",
            "esri/geometry/Mesh",
            "esri/widgets/LayerList",
            "esri/Map",

            "esri/geometry/Point",
            "esri/geometry/SpatialReference",
            "esri/symbols/FillSymbol3DLayer",
            "esri/symbols/MeshSymbol3D",
            "esri/symbols/edges/SolidEdges3D",
            "esri/geometry/support/MeshTexture",
            "esri/geometry/support/meshUtils",


        ], function (
            esriConfig, SceneView,
            GraphicsLayer, Graphic, Mesh, LayerList, Map,
            Point, SpatialReference, FillSymbol3DLayer, MeshSymbol3D, SolidEdges3D, MeshTexture,
            meshUtils,
        ) {

            // ${batchSize} 个 box 合并为一个 Mesh 对象
            let batchSize = 500;

            activeState('left');

            const spatialReference = SpatialReference.WebMercator;

            // Add graphic when GraphicsLayer is constructed
            const layerGrid = new GraphicsLayer({
                title: '网格图层',
            });

            const scene = new Map({
                layers: [layerGrid]
            })

            const view = new SceneView({
                map: scene,
                container: "viewDiv",
                camera: {
                    position: {
                        x: 12957235.377120316,
                        y: 4863943.339089994,
                        z: 540.7203787067715,
                        spatialReference
                    },
                    tilt: 60
                }
            });

            // 隐藏载入中动图
            const loadingDiv = document.getElementById("loadingDiv");

            // 默认边框颜色
            const colorOutline = {
                value: [255, 255, 255, 1]
            }
            // 默认填充颜色
            const colorFill = {
                value: [0, 0, 255, 0]
            }

            // 获取网格样式
            function getMeshSymbol3D(materialColor, edgesColor) {
                return new MeshSymbol3D({
                    symbolLayers: [
                        new FillSymbol3DLayer({
                            material: {color: materialColor || colorFill.value},
                            edges: new SolidEdges3D({
                                // type: "solid", // autocasts as new SolidEdges3D()
                                color: edgesColor || colorOutline.value,
                                size: '2px'
                            })
                        })
                    ]
                })
            }

            // @todo 定义全局变量,用于控制
            // 网格数组
            // 网格图层
            // 过滤对象,用于隐藏显示单个建筑
            // 网格样式
            let symbol = getMeshSymbol3D();

            // 异步分批添加网格
            async function addGridAsync(data, batchSize = 500) {

                // 验证输入参数
                if (!data || !data.BBox || !data.CenterPoint) {
                    throw new Error('无效的数据格式:缺少BBox或CenterPoint');
                }

                if (batchSize <= 0) {
                    throw new Error('batchSize必须大于0');
                }

                try {

                    loadingDiv && (loadingDiv.style.display = 'block')

                    // 清除现有图层
                    layerGrid.removeAll();

                    // 解析数据
                    const {CenterPoint: centerWebMercator, BBox: bboxData} = data;
                    const totalLength = bboxData.length;

                    console.log('box 个数:', totalLength);

                    // 预计算总批次数用于进度跟踪
                    const totalBatches = Math.ceil(totalLength / batchSize);

                    // 中心点
                    const centerPoint = new Point({
                        x: centerWebMercator.x,
                        y: centerWebMercator.y,
                        z: centerWebMercator.z,
                        spatialReference
                    });

                    // 分批处理数据
                    for (let batchIndex = 0; batchIndex < totalBatches; batchIndex++) {

                        // 计算当前批次的索引范围
                        const startIndex = batchIndex * batchSize;
                        const endIndex = Math.min(startIndex + batchSize, totalLength);
                        const batch = bboxData.slice(startIndex, endIndex);

                        // 转换为 Mesh 实例
                        const boxes = batch.map(datum => {

                            centerPoint.x = centerWebMercator.x + datum.posX;
                            centerPoint.y = centerWebMercator.y + datum.posZ;
                            centerPoint.z = centerWebMercator.z + datum.posY;

                            return Mesh.createBox(
                                centerPoint,
                                {
                                    size: {
                                        width: datum.lenX,
                                        height: datum.lenY,
                                        depth: datum.lenZ
                                    },
                                    vertexSpace: 'local',
                                }
                            );
                        });

                        // 批量添加图形
                        layerGrid.add(new Graphic({
                            // 每个批次合并网格, ${batchSize} 个 box 合并为一个 Mesh 对象
                            geometry: meshUtils.merge(boxes),
                            symbol: symbol
                        }));

                        const processedCount = Math.min(endIndex, totalLength);
                        const progress = ((processedCount / totalLength) * 100).toFixed(1);
                        console.log(`进度: ${processedCount}/${totalLength} (${progress}%)`);

                        // 让出主线程,但避免过短的延迟
                        if (batchIndex < totalBatches - 1) {
                            // 1000/240 为帧率时间,这里暂停 8 帧用于加载数据
                            await new Promise(resolve => setTimeout(resolve, 1000 / 240 * 8));
                        }
                    }

                    console.log('所有网格添加完成');

                    return {success: true, count: totalLength};

                } catch (error) {
                    console.error("添加网格时出错:", error);
                    // 可以根据错误类型提供更具体的错误信息
                    if (error.message.includes('Invalid')) {
                        throw new Error('数据格式无效,请检查输入数据');
                    }
                    throw error; // 重新抛出错误让调用者处理
                } finally {
                    loadingDiv && (loadingDiv.style.display = 'none')
                }
            }

            // 开启显示帧率
            function activeState(left = 'right', bottom = 'top') {

                let stats = initState();

                function initState(type) {
                    let panelType = (typeof type != 'undefined' && type) && (!isNaN(type)) ? parseInt(type) : 0;
                    let stats = new Stats();
                    stats.domElement.style.position = 'absolute'; //绝对坐标
                    stats.domElement.style.left = 'auto';
                    stats.domElement.style[left] = '30px';//
                    stats.domElement.style[bottom] = '20px';
                    stats.showPanel(panelType);
                    document.body.appendChild(stats.domElement);
                    return stats;
                }

                function renderer() {
                    stats.update();
                    requestAnimationFrame(renderer);
                }

                renderer();
            }

            var layerList = new LayerList({
                view: view
            });
            // Add widget to the top right corner of the view
            view.ui.add(layerList, "top-right");

            addGridAsync(data_, batchSize)
        });
    </script>
</head>
<body>
<div id="viewDiv">
    <calcite-loader id="loadingDiv" style="display: none" label="loading..." text="载入中..."></calcite-loader>
</div>
</body>
</html>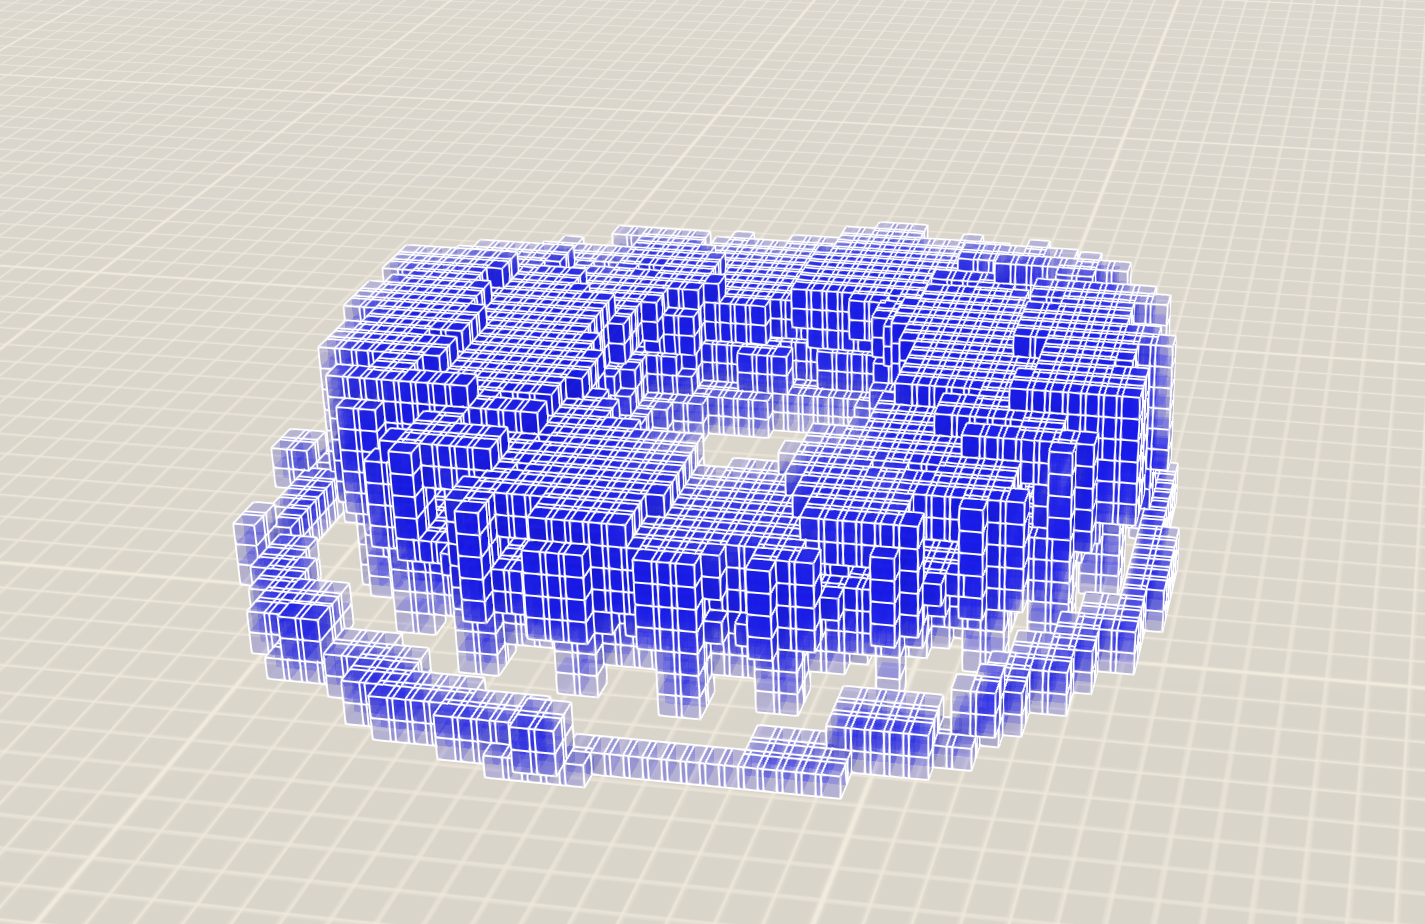
在线示例
ArcGIS Maps SDK for JavaScript 在线示例:BOX 性能优化 - 10W 级(合并 Mesh)