
文章目录
一、背景
XNMS(Extended Network Management System,增强型网络管理系统)是一款远程监控和管理常规中转台的软件。中转台是系统的核心设备,所有业务都通过其进行中转。因此,只要对中转台进行监控,就能全面掌握系统的运行状况。而中转台通常部署室外,容易受到日晒雨淋等自然条件影响,造成设备损坏。为保证通讯系统正常运行,工作人员需要对中转台进行实时监控,发现中转台的异常问题,从而采取相关措施进行补救。
通过XNMS软件,工作人员可实时监控常规中转台的各项参数和告警情况,对异常问题进行排查;还可以查询或统计某时间段内中转台或终端的业务,从而全面了解常规系统的运行状况。
项目采用:Arco Design+java+mysql+springboot+vue3+nginx
JsPDF 是一个流行的、纯 JavaScript 编写的开源库,用于在浏览器中生成 PDF 文档。
核心特性:
- 纯前端生成
- 无需后端服务器参与
- 完全在浏览器中运行
- 减少服务器压力和网络传输
- 主要功能
java
// 创建PDF实例
const pdf = new jsPDF();

// 添加文本
pdf.text('Hello World!', 10, 10);

// 添加图片(支持base64、DataURL)
pdf.addImage(imageData, 'JPEG', 15, 40, 180, 160);

// 添加页面
pdf.addPage();

// 设置字体和样式
pdf.setFont("helvetica", "bold");
pdf.setTextColor(255, 0, 0);

// 保存文件
pdf.save('document.pdf');-
常见使用场景
- 报表导出:将数据表格、图表导出为PDF
- 文档生成:发票、合同、证书等
- 内容存档:保存网页内容、文章、报告
- 打印优化:生成适合打印的格式
-
与其他库配合使用
- html2canvas + jsPDF:将HTML转换为PDF(你正在用的方案)
- AutoTable插件:专门处理表格导出
- 各种字体插件:支持中文字体等
-
优点
✅ 轻量级(核心库约100KB)
✅ API简单易用
✅ 支持自定义字体
✅ 丰富的插件生态系统
✅ 良好的浏览器兼容性
-
局限性
❌ 复杂布局处理有限
❌ 大量内容时性能可能受影响
❌ 某些CSS样式不支持
❌ 中文字体需要额外配置
-
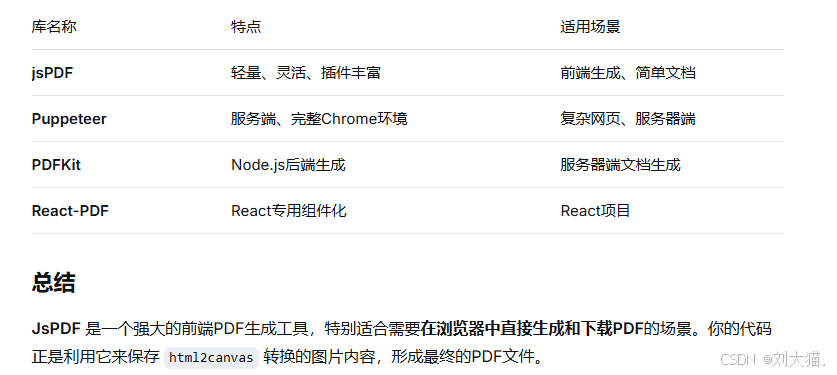
替代方案对比
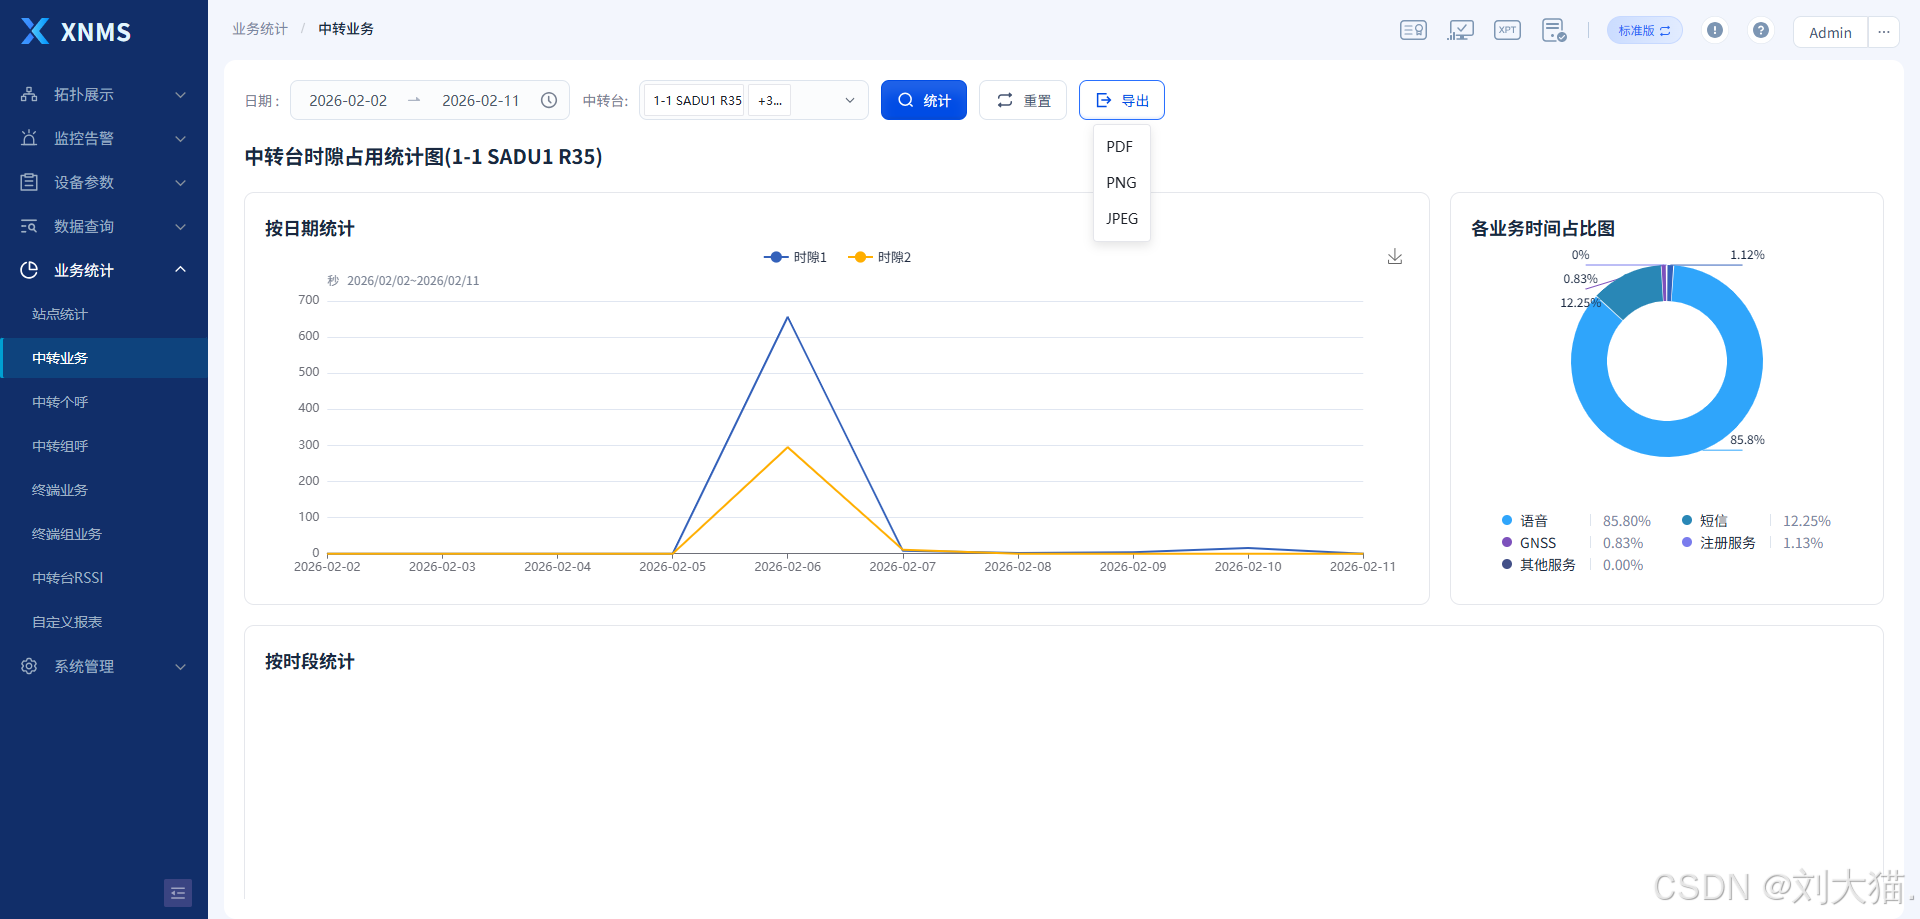
二、页面
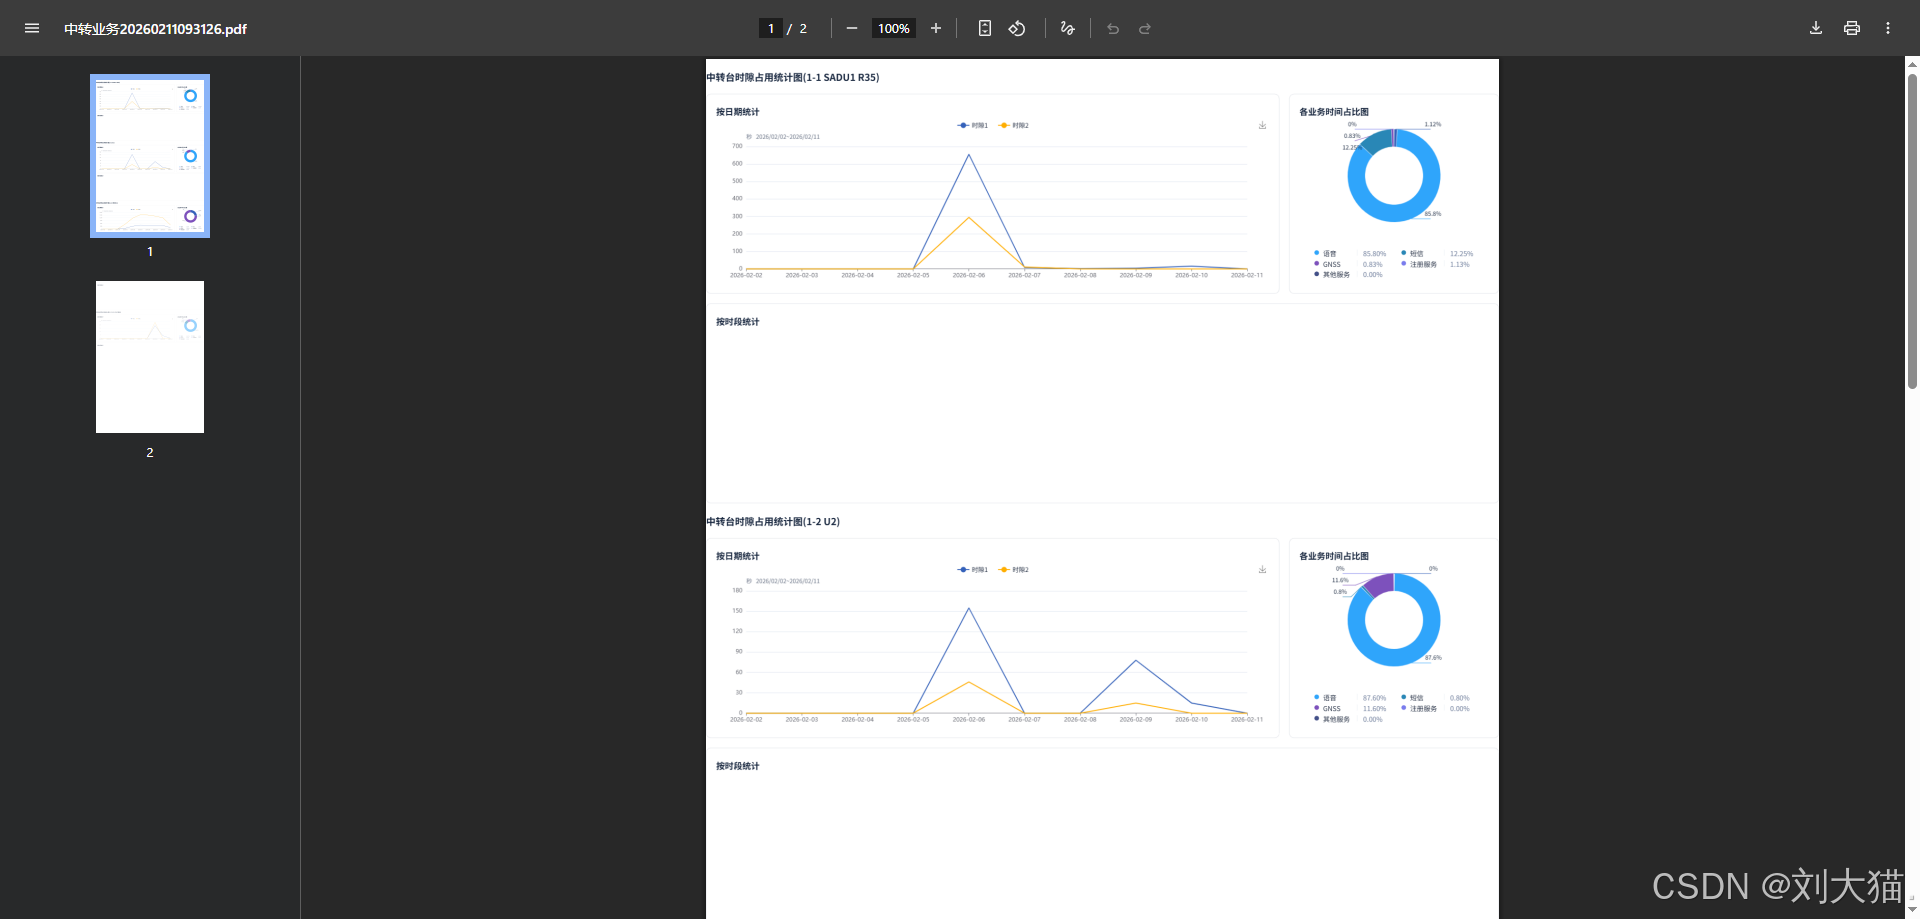
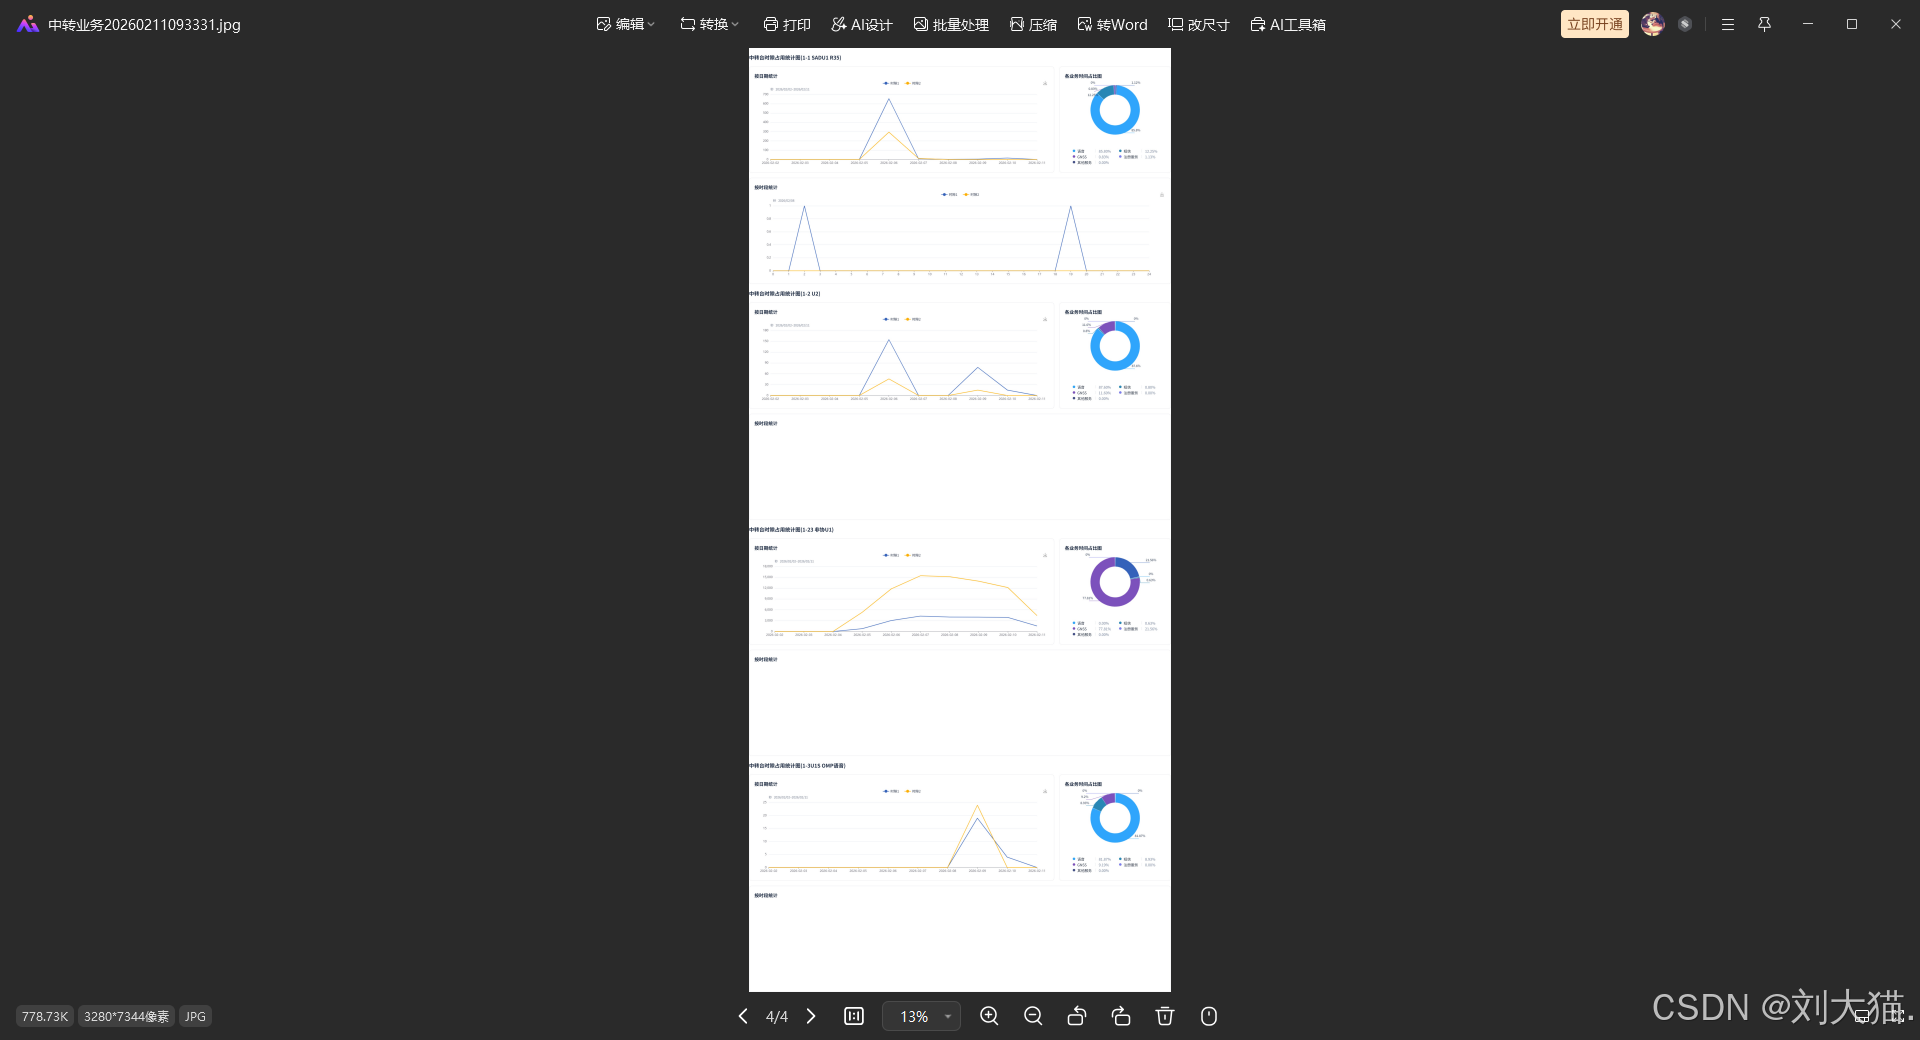
图表导出PDF/JPG/PNG
图表导出PDF
图表导出JPG
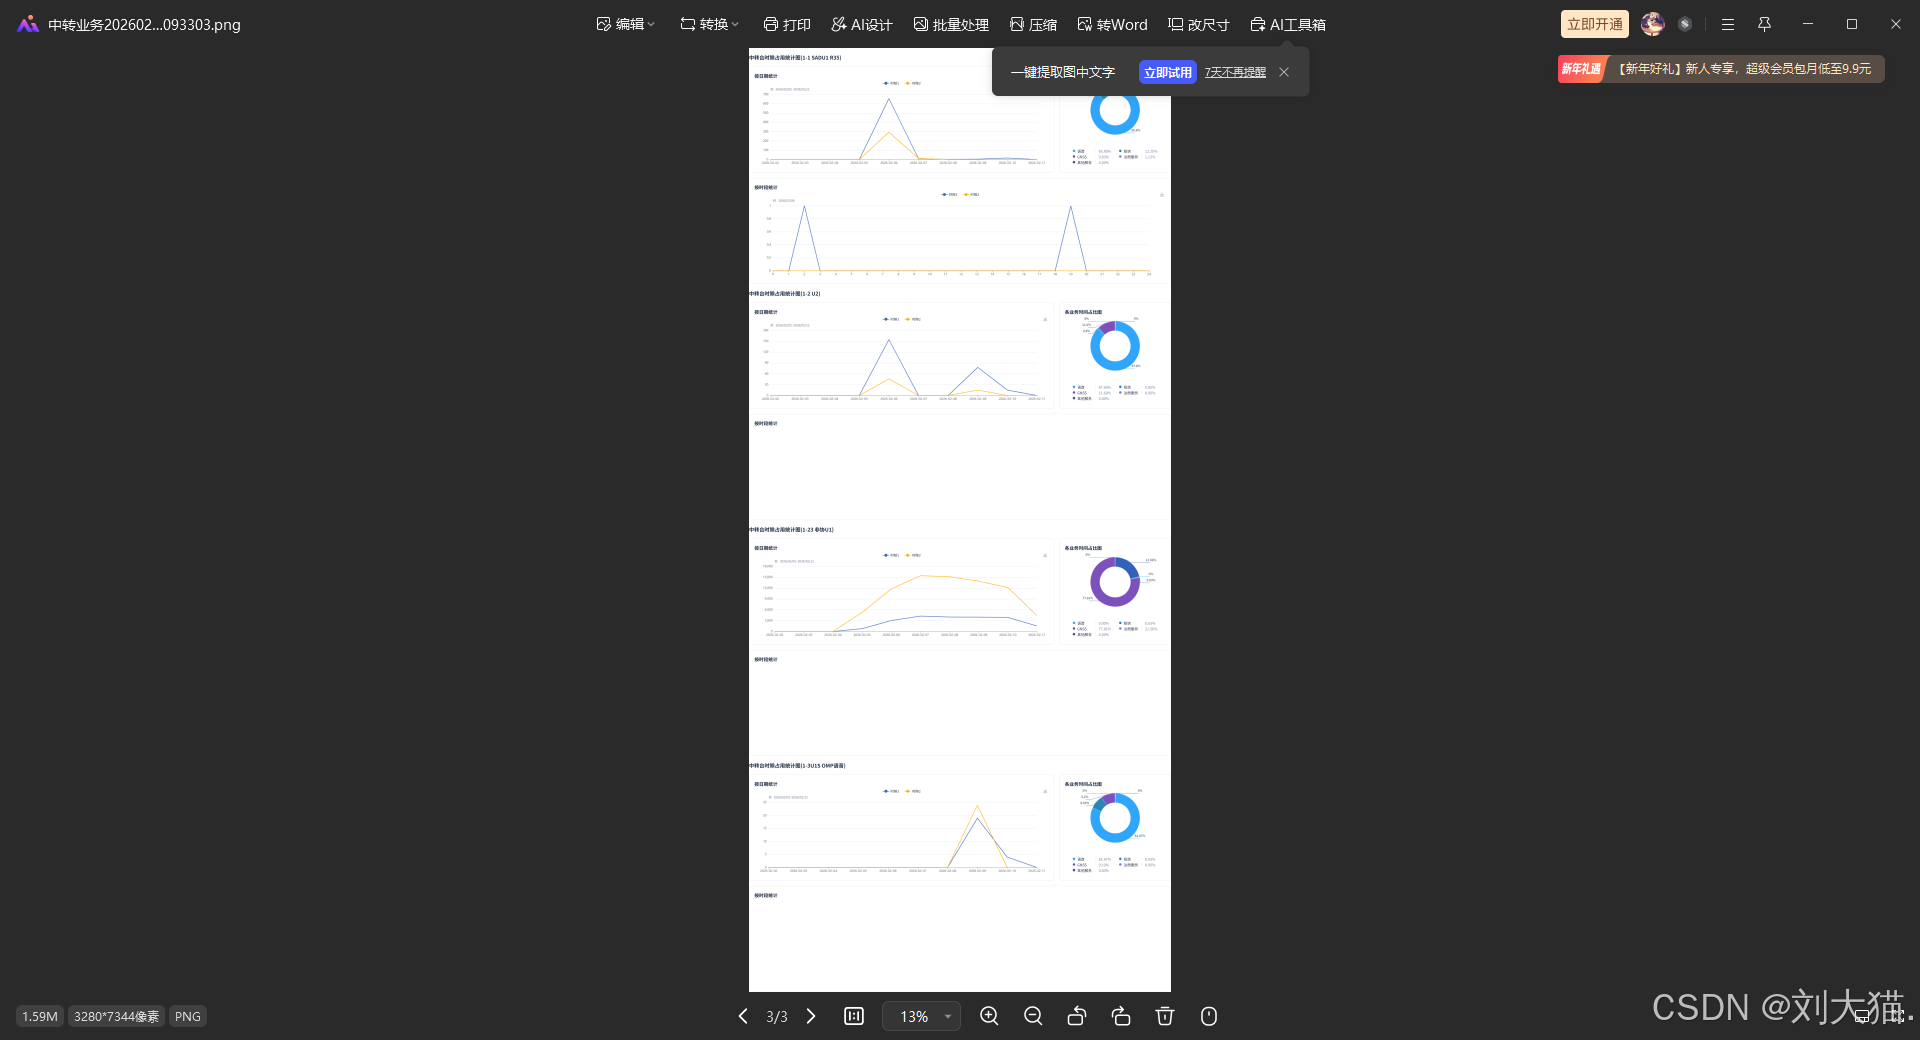
图表导出PNG
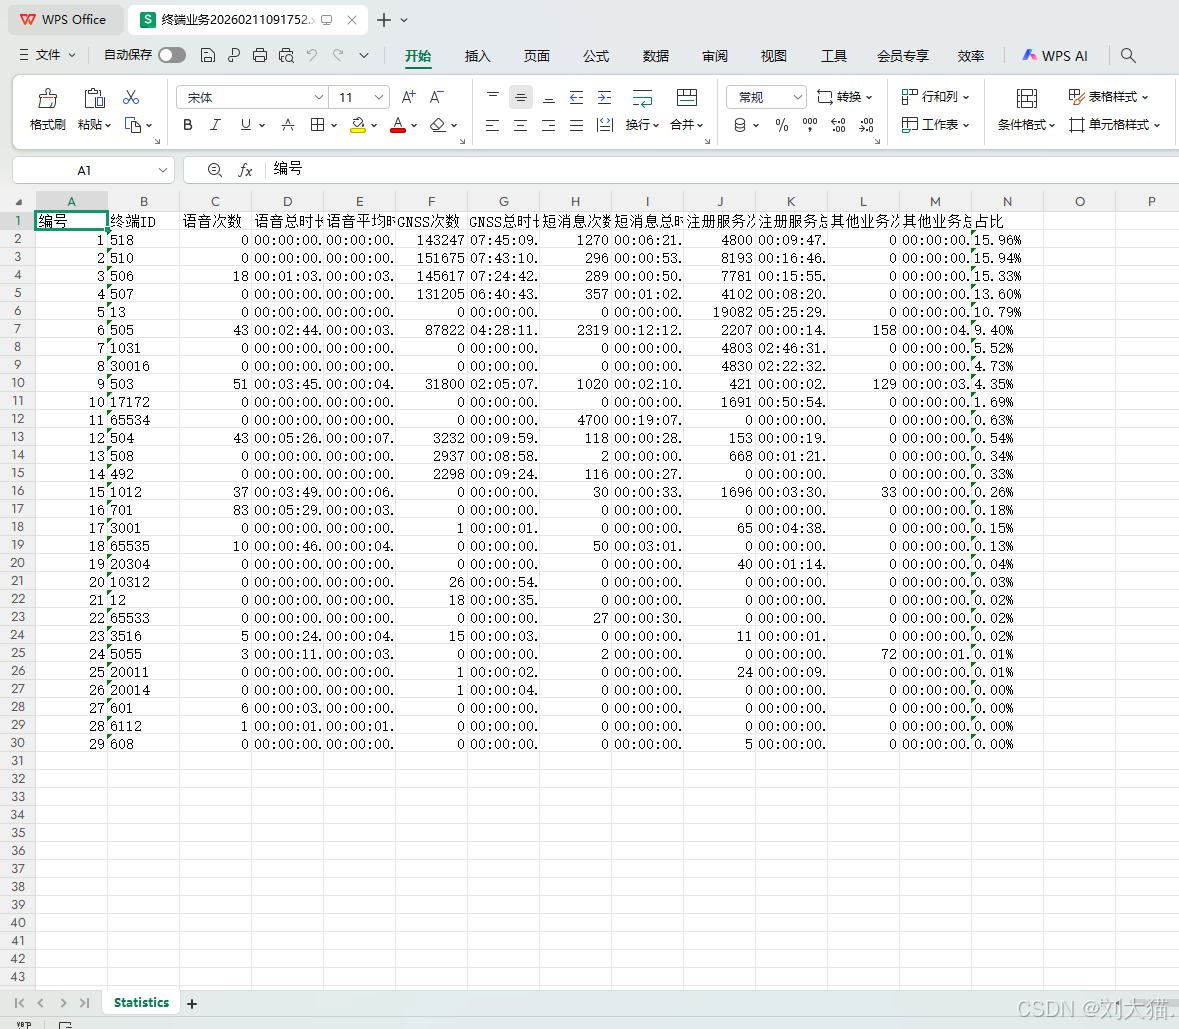
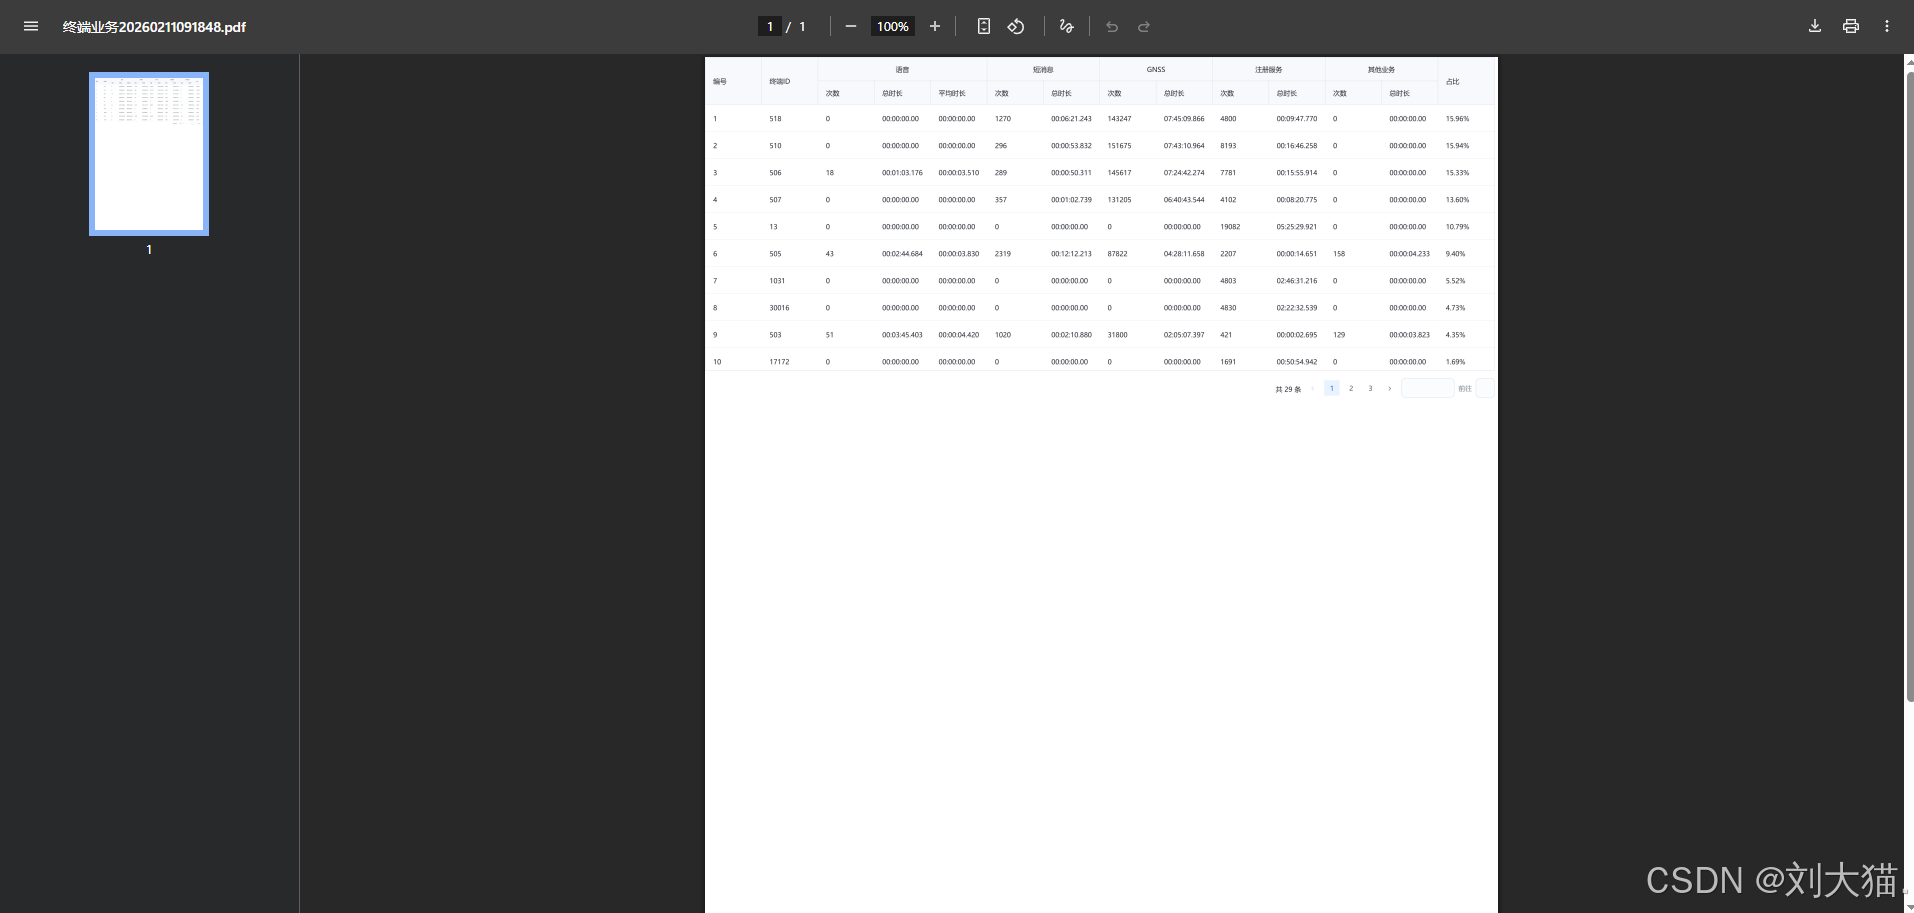
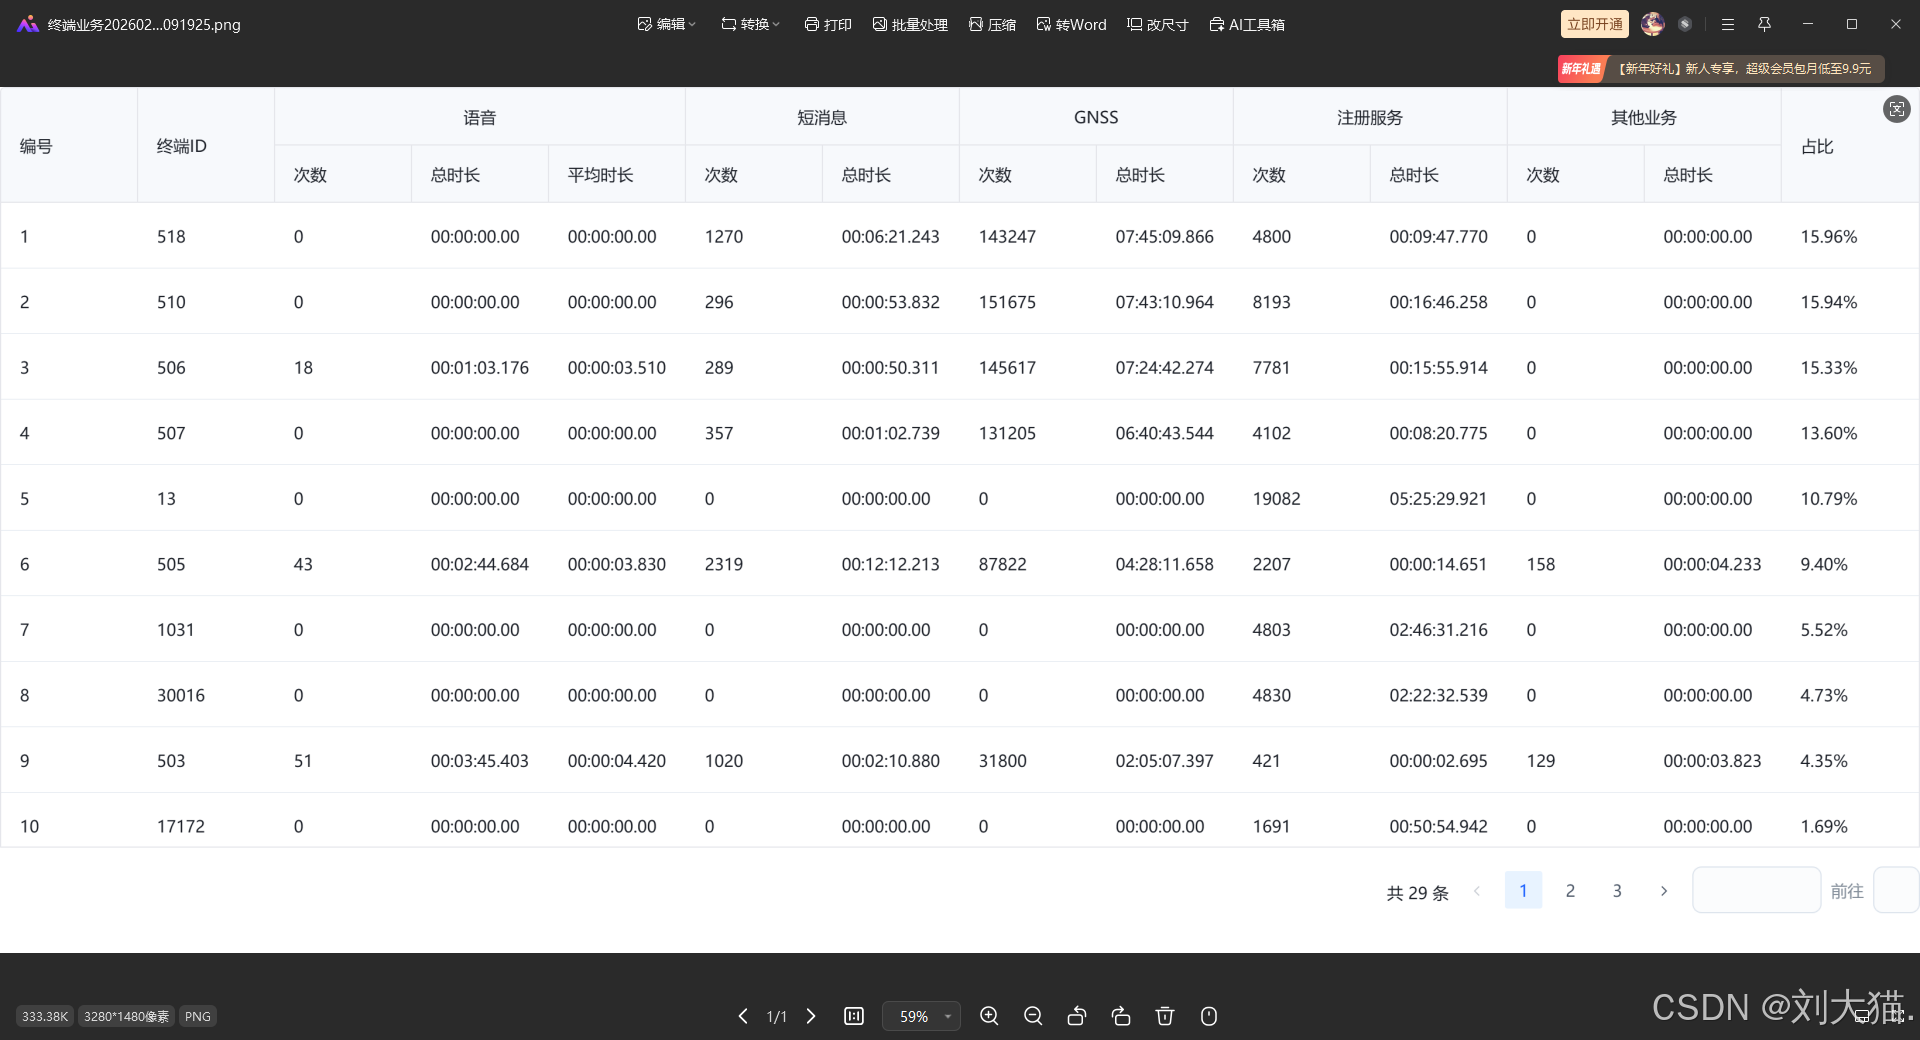
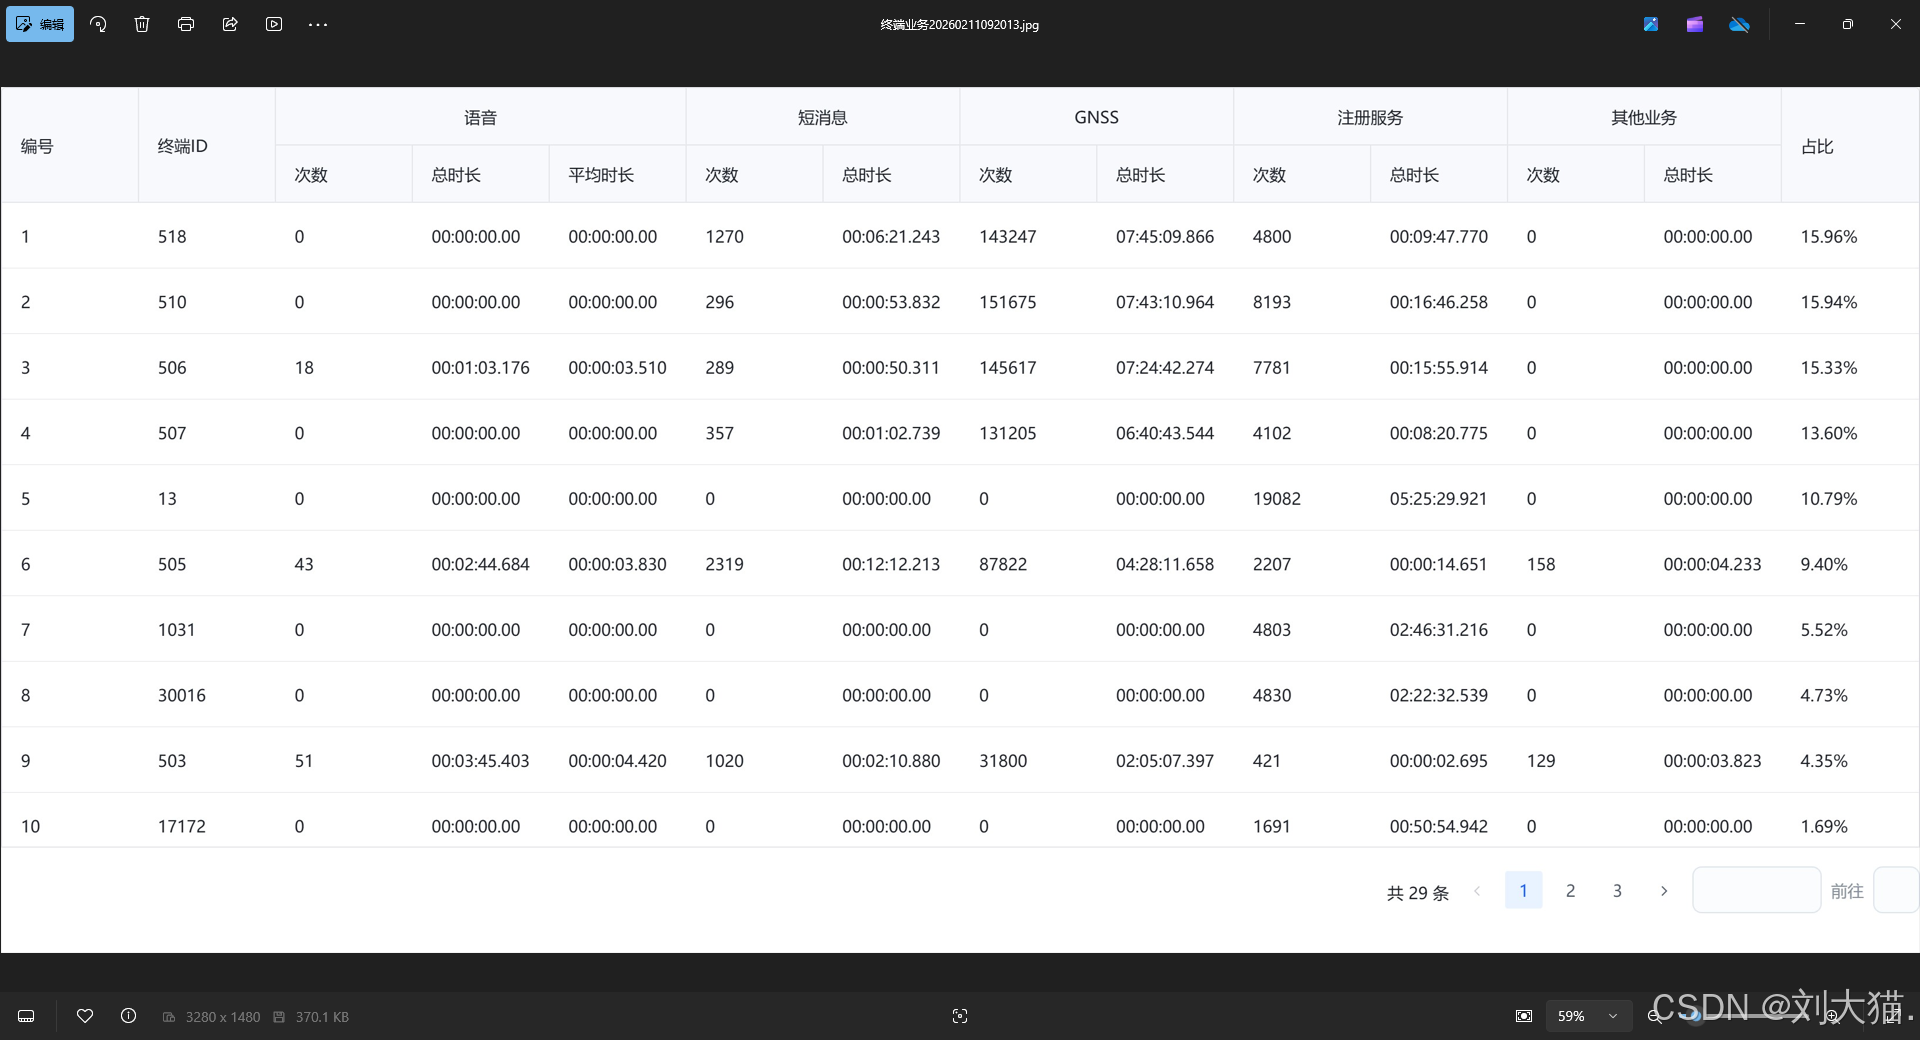
列表数据生成Excel/PDF/JPG/PNG
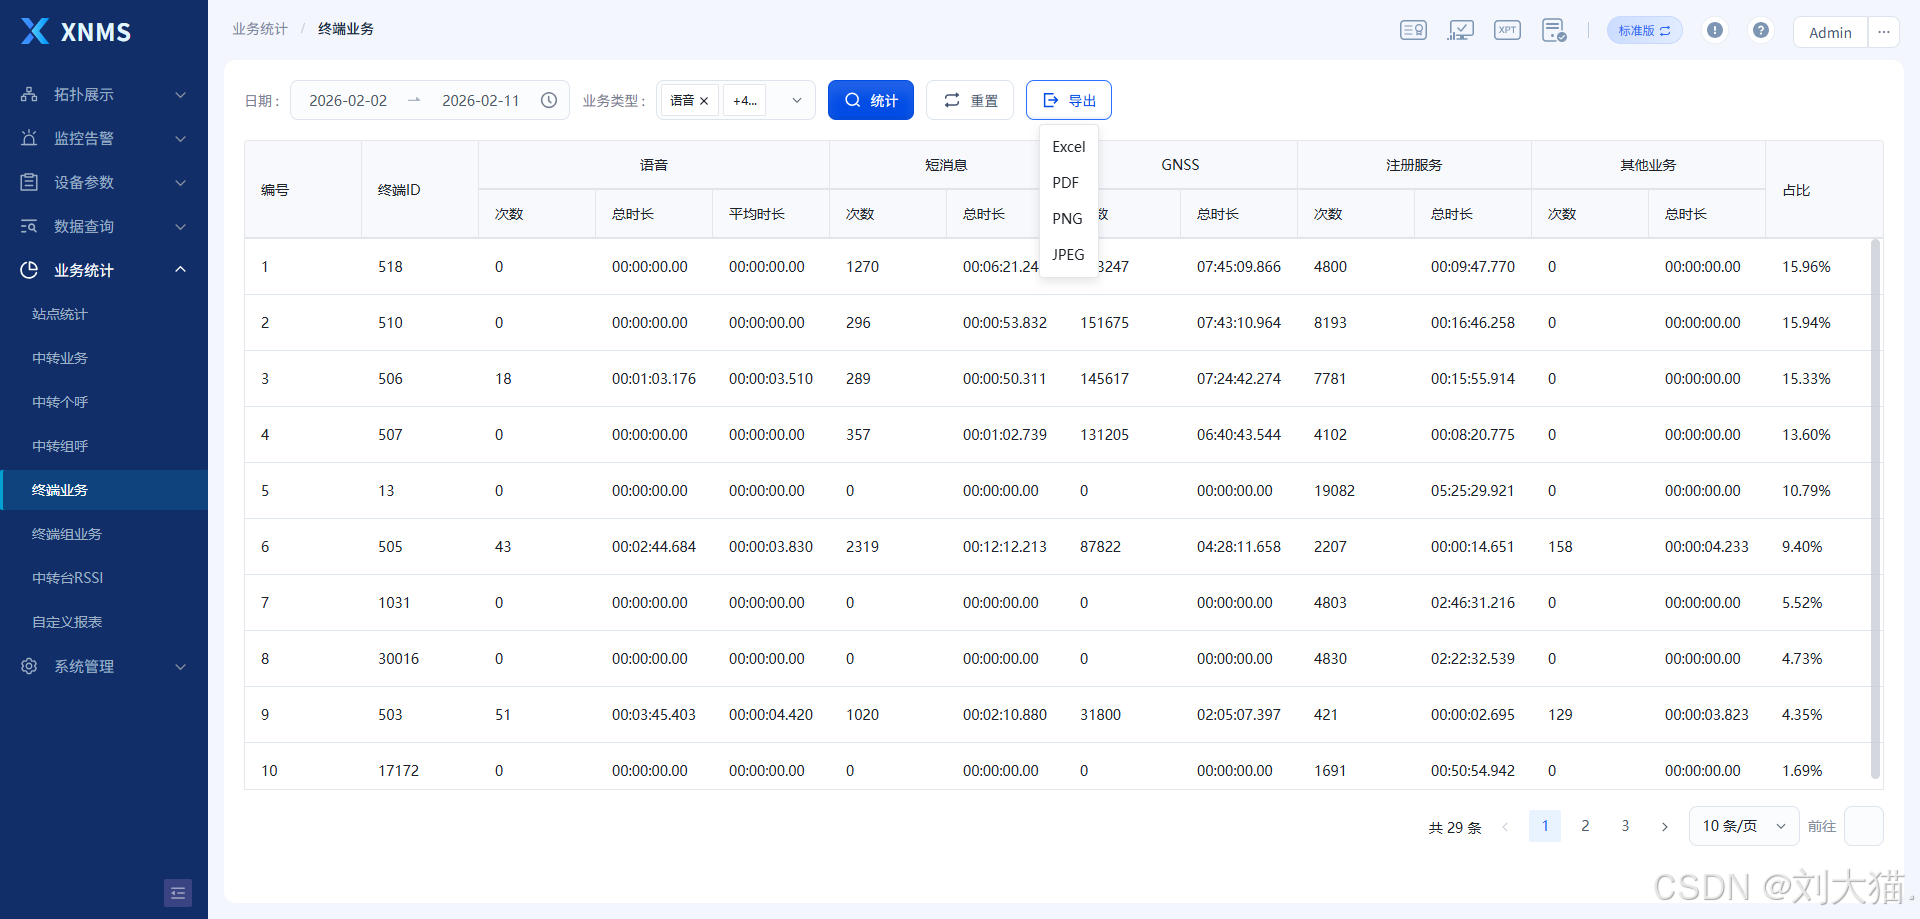
列表数据生成Excel
列表数据生成PDF
列表数据生成JPG
列表数据生成PNG
三、代码
列表数据生成Excel/PDF/JPG/PNG
java
<template>
<a-spin
:size="80"
:loading="uploadeLoading"
:tip="loadingTip"
style="width: 100%; height: 100%"
>
<layout_1>
<a-scrollbar style="height: 800px; overflow: auto">
<div class="--search-line">
<div>
<div class="key">{{ $t(queryButtonValue[7]) }} </div>
<div class="val">
<a-range-picker
style="width: 280px"
:allow-clear="false"
v-model="param.timeRange"
:disabled-date="disabledDate"
>
<template #suffix-icon>
<svg-loader :width="20" :height="20" name="clock"></svg-loader>
</template>
<template #separator>
<svg-loader
:width="16"
:height="16"
name="arrow-right"
></svg-loader>
</template>
</a-range-picker>
</div>
</div>
<div>
<div class="key">{{ $t(queryButtonValue[10]) }} </div>
<div class="val select-input">
<!-- <a-select v-model="param.businessTypes" :multiple="true" :max-tag-count="1">
<a-option v-for="(val, key) in statBusinessType" :label="val" :value="key" :key="key"></a-option>
</a-select> -->
<a-tree-select
class="arco-tree-select --arco-select"
:data="treeData"
v-model="param.businessTypes"
:tree-checkable="true"
:tree-check-strictly="false"
tree-checked-strategy="child"
:max-tag-count="1"
/>
</div>
</div>
<a-button class="huge" @click="search" type="primary">
<template #icon> <icon-search size="18" /> </template
>{{ $t(queryButtonValue[1]) }}
</a-button>
<a-button class="huge" @click="resetSearch">
<template #icon>
<svg-loader
:width="20"
:height="20"
name="reset"
></svg-loader> </template
>{{ $t(queryButtonValue[21]) }}</a-button
>
<a-dropdown @select="handleSelect">
<a-button class="huge" :disabled="!tableData?.length">
<template #icon> <icon-export size="18" /> </template>
{{ $t(queryButtonValue[3]) }}
</a-button>
<template #content>
<a-doption value="excel">Excel</a-doption>
<a-doption value="pdf">PDF</a-doption>
<a-doption value="png">PNG</a-doption>
<a-doption value="jpeg">JPEG</a-doption>
</template>
</a-dropdown>
</div>
<div class="table-line" ref="exportContentRef">
<a-table
:data="tableData"
:loading="tableLoading"
:bordered="{ headerCell: true }"
:pagination="false"
:scroll="{ x: '100%', y: 550 }"
@row-click="handleRowClick"
>
<template #empty>
<div style="text-align: center">{{ $t("NoData") }}</div>
</template>
<template #columns>
<a-table-column
:title="$t(queryColumnValue[1])"
dataIndex="index"
:tooltip="true"
></a-table-column>
<a-table-column
:title="$t(queryColumnValue[79])"
dataIndex="terminalID"
:tooltip="true"
></a-table-column>
<a-table-column
:title="$t(queryColumnValue[61])"
v-if="param.businessTypes.includes(1)"
>
<a-table-column
:title="$t(queryColumnValue[66])"
dataIndex="radioTotalCount"
/>
<a-table-column
:title="$t(queryColumnValue[67])"
dataIndex="radioTotalTime"
>
<template #cell="{ record }">
{{ formatTime(record.radioTotalTime) }}
</template>
</a-table-column>
<a-table-column
:title="$t(queryColumnValue[68])"
dataIndex="radioAverageTime"
>
<template #cell="{ record }">
{{ formatTime(record.radioAverageTime) }}
</template>
</a-table-column>
</a-table-column>
<a-table-column
:title="$t(queryColumnValue[62])"
v-if="param.businessTypes.includes(2)"
>
<a-table-column
:title="$t(queryColumnValue[80])"
dataIndex="messageTotalCount"
/>
<a-table-column
:title="$t(queryColumnValue[81])"
dataIndex="messageTotalTime"
>
<template #cell="{ record }">
{{ formatTime(record.messageTotalTime) }}
</template>
</a-table-column>
</a-table-column>
<a-table-column
:title="$t(queryColumnValue[63])"
v-if="param.businessTypes.includes(3)"
>
<a-table-column
:title="$t(queryColumnValue[69])"
dataIndex="gpsTotalCount"
/>
<a-table-column
:title="$t(queryColumnValue[70])"
dataIndex="gpsTotalTime"
>
<template #cell="{ record }">
{{ formatTime(record.gpsTotalTime) }}
</template>
</a-table-column>
</a-table-column>
<a-table-column
:title="$t(queryColumnValue[64])"
v-if="param.businessTypes.includes(4)"
>
<a-table-column
:title="$t(queryColumnValue[71])"
dataIndex="registTotalCount"
/>
<a-table-column
:title="$t(queryColumnValue[72])"
dataIndex="registTotalTime"
>
<template #cell="{ record }">
{{ formatTime(record.registTotalTime) }}
</template>
</a-table-column>
</a-table-column>
<a-table-column
:title="$t(queryColumnValue[65])"
v-if="param.businessTypes.includes(5)"
>
<a-table-column
:title="$t(queryColumnValue[73])"
dataIndex="otherTotalCount"
/>
<a-table-column
:title="$t(queryColumnValue[74])"
dataIndex="otherTotalTime"
>
<template #cell="{ record }">
{{ formatTime(record.otherTotalTime) }}
</template>
</a-table-column>
</a-table-column>
<a-table-column
:title="$t(queryColumnValue[78])"
dataIndex="proportion"
:tooltip="true"
>
<template #cell="{ record }">
{{ `${(record.proportion * 100).toFixed(2)}%` }}
</template>
</a-table-column>
</template>
</a-table>
<div class="--table-pager">
<a-config-provider :locale="arcoLang">
<a-pagination
:total="page.total"
v-model:current="page.currentPage"
v-model:page-size="page.pageSize"
@change="getTableData"
@page-size-change="getTableData"
show-total
show-page-size
show-jumper
/></a-config-provider>
</div>
<div v-if="showRecordChart" class="chart_box">
<div class="title">{{ detailTitle }}</div>
<div class="content" id="terminal_business_content_box">
<div class="content-item box-1 inline">
<div class="content-item-title">
{{ $t(queryColumnValue[116]) }}
</div>
<div
:id="`voice_business_by_date_${recordInfo.terminalID}`"
class="chart-1"
></div>
</div>
<div class="content-item box-2 inline">
<div class="content-item-title">
{{ $t(queryColumnValue[117]) }}
</div>
<div
:id="`data_business_by_date_${recordInfo.terminalID}`"
class="chart-2"
></div>
<div class="content-item-icon">
<div
v-for="(item, index) in filteredbizTypesTitlesItems"
:key="index"
:id="`content-item-icon-container${index}`"
:class="{
'content-item-icon-container': true,
'content-item-icon-greyed-out-0': index === 0 && g0,
'content-item-icon-greyed-out-1': index === 1 && g1,
'content-item-icon-greyed-out-2': index === 2 && g2,
'content-item-icon-greyed-out-3': index === 3 && g3,
}"
@click="
toggleLine($t(queryColumnValue[item.enumValueIndex]), index)
"
>
<div
class="content-item-icon-container-inline"
:style="{ backgroundColor: item.color }"
></div>
<div class="content-item-icon-container-text">
{{ $t(queryColumnValue[item.enumValueIndex]) }}
</div>
</div>
</div>
</div>
</div>
</div>
</div>
</a-scrollbar>
</layout_1>
</a-spin>
</template>
<script setup>
import {
commonResponse,
formatDateToYyyyMMddHHmmss,
formatTime,
} from "@/views/pages/_common";
import {
queryButtonValue,
queryColumnValue,
queryName,
statBusinessType,
} from "@/views/pages/_common/enum";
import Layout_1 from "@/views/pages/_common/layout_1.vue";
import {
exportTerminalBusinessDetailCountByDayBizType,
exportTerminalBusinessStat,
getTerminalBusinessStatList,
} from "@/views/pages/business/_request";
import * as echarts from "echarts";
import html2canvas from "html2canvas";
import JsPDF from "jspdf";
import * as moment from "moment";
import { computed, inject, reactive, ref, watch } from "vue";
const arcoLang = inject("arcoLang");
const t = inject("t");
const exportType = ref('');
const uploadeLoading = ref(false);
const param = reactive({
timeRange: [null, null],
businessTypes: [],
});
let reqParam = {
startTime: null,
endTime: null,
businessTypes: [],
};
const page = reactive({
currentPage: 1,
pageSize: 10,
total: 0,
});
const treeData = [
{
title: t(statBusinessType[0]), // 根节点 (全选项)
value: 0,
key: 0,
children: Object.keys(statBusinessType)
.slice(1)
.map((key) => ({
title: t(statBusinessType[key]),
value: Number(key),
key: Number(key),
})),
},
];
// 监听 param.businessTypes 的变化
watch(
() => param.businessTypes,
(newValue) => {
if (newValue.includes(0)) {
// 如果用户选择了全选(即选择了 0),将其转换为 1, 2, 3, 4, 5 的数组
param.businessTypes = [1, 2, 3, 4, 5];
}
}
);
const showRecordChart = ref(false);
const tableLoading = ref(false);
const exportContentRef = ref(null);
const tableData = ref([]);
const getTableData = () => {
tableLoading.value = true;
getTerminalBusinessStatList({
...reqParam,
currentPage: page.currentPage,
pageSize: page.pageSize,
})
.then((response) => {
tableLoading.value = false;
commonResponse({
response,
onSuccess: () => {
tableData.value = response.data;
page.total = response.pagination.totalRecords;
},
});
})
.catch((e) => (tableLoading.value = true));
};
const disabledDate = (date) => {
return date.getTime() > moment().format("x");
};
const search = () => {
reqParam = {
...reqParam,
...param,
};
reqParam.startTime = moment(reqParam.timeRange[0]).format(
"YYYY-MM-DDT00:00:00.000"
);
reqParam.endTime = moment(reqParam.timeRange[1]).format(
"YYYY-MM-DDT23:59:59.999"
);
delete reqParam.timeRange;
getTableData();
};
const resetSearch = () => {
param.timeRange = [moment().add(-9, "days"), moment()];
param.businessTypes = [];
page.currentPage = 1;
page.total = 0;
tableData.value = [];
showRecordChart.value = false;
};
const loadingTip = computed(() => {
if (!exportType.value) return t('ExportStatus_Exporting');
return `${exportType.value} ${t('Outputting')}`;
});
const handleSelect = (t) => {
exportType.value = t;
uploadeLoading.value = true;
exportFormat(t);
};
// 导出功能
const exportTable = async () => {
tableLoading.value = true;
try {
const response = await exportTerminalBusinessStat({
...reqParam,
});
tableLoading.value = false;
// 创建 Blob 对象
const blob = new Blob([response], {
type: "application/vnd.openxmlformats-officedocument.spreadsheetml.sheet",
});
const url = window.URL.createObjectURL(blob);
// 创建一个临时的 <a> 标签来触发下载
const link = document.createElement("a");
link.href = url;
link.download =
t(queryName["RadioService"]) + formatDateToYyyyMMddHHmmss(new Date()); // 设置文件保存名称
link.click();
// 清理 URL 对象
window.URL.revokeObjectURL(url);
} catch (error) {
tableLoading.value = true;
console.error("导出.excel图片失败:", error);
} finally {
setTimeout(() => uploadeLoading.value = false, 3000);
}
};
// 处理不同格式的导出请求
const exportFormat = (format) => {
const title =
t(queryName["RadioService"]) + formatDateToYyyyMMddHHmmss(new Date());
if (format === "excel") {
exportTable();
} else if (format === "pdf") {
exportPdf(exportContentRef.value, title);
} else if (format === "png") {
exportPng(exportContentRef.value, title);
} else if (format === "jpeg") {
exportJpeg(exportContentRef.value, title);
}
};
// 导出 PDF
const exportPdf = async (el, title) => {
// 获取元素的实际高度
const contentHeight = el.scrollHeight;
const contentWidth = el.scrollWidth;
const getDynamicScale = (element) => {
try {
if (!element || !element.getBoundingClientRect) {
console.warn('getDynamicScale: 元素无效或不存在');
return 1;
}
const rect = element.getBoundingClientRect();
const area = rect.width * rect.height;
if (isNaN(area) || area <= 0) {
console.warn('getDynamicScale: 计算出的面积无效', { width: rect.width, height: rect.height, area });
return 1;
}
console.log('area', area, 'width:', rect.width, 'height:', rect.height);
const areaMB = area / 1000000;
if (!isFinite(areaMB)) {
console.warn('getDynamicScale: areaMB无效', areaMB);
return 1;
}
if (areaMB > 20) {
return 0.5;
} else if (areaMB > 15) {
return 0.75;
} else if (areaMB > 13) {
return 0.8;
} else if (areaMB > 10) {
return 0.9;
} else if (areaMB > 5) {
return 0.95;
} else if (areaMB > 4) {
return 1;
} else if (areaMB > 3) {
return 1.25;
} else if (areaMB > 2.5) {
return 1.5;
} else if (areaMB > 2) {
return 1.5;
} else {
return 2;
}
} catch (error) {
console.error('getDynamicScale 发生错误:', error);
return 1;
}
};
const scale = getDynamicScale(el);
try {
const canvas = await html2canvas(el, {
allowTaint: true,
taintTest: false,
useCORS: true,
logging: false,
imageTimeout: 0,
scale: scale,
scrollX: 0,
scrollY: 0,
width: contentWidth,
height: contentHeight,
});
let pageHeight = (contentWidth / 592.28) * 841.89;
let leftHeight = contentHeight;
let position = 0;
let imgWidth = 592.28;
let imgHeight = (592.28 / contentWidth) * contentHeight;
let pageData = canvas.toDataURL("image/jpeg", 1.0);
let PDF = new JsPDF("", "pt", "a4");
if (leftHeight < pageHeight) {
PDF.addImage(pageData, "JPEG", 0, 0, imgWidth, imgHeight);
} else {
while (leftHeight > 0) {
PDF.addImage(pageData, "JPEG", 0, position, imgWidth, imgHeight);
leftHeight -= pageHeight;
position -= imgHeight;
if (leftHeight > 0) {
PDF.addPage();
}
}
}
PDF.save(title + ".pdf");
} catch (error) {
console.error("导出.pdf图片失败:", error);
} finally {
setTimeout(() => uploadeLoading.value = false, 3000);
}
};
// 导出 PNG
const exportPng = async (el, title) => {
const contentHeight = el.scrollHeight;
const contentWidth = el.scrollWidth;
try {
const canvas = await html2canvas(el, {
allowTaint: true,
taintTest: false,
useCORS: true,
logging: false,
imageTimeout: 0,
scale: 2,
scrollX: 0,
scrollY: 0,
width: contentWidth,
height: contentHeight,
});
let url = canvas.toDataURL("image/png");
let a = document.createElement("a");
a.href = url;
a.download = title + ".png";
a.click();
setTimeout(() => URL.revokeObjectURL(url), 1000);
} catch (error) {
console.error("导出.png图片失败:", error);
} finally {
setTimeout(() => uploadeLoading.value = false, 3000);
}
};
// 导出 JPEG
const exportJpeg = async (el, title) => {
const contentHeight = el.scrollHeight;
const contentWidth = el.scrollWidth;
try {
const canvas = await html2canvas(el, {
allowTaint: true,
taintTest: false,
useCORS: true,
logging: false,
imageTimeout: 0,
scale: 2,
scrollX: 0,
scrollY: 0,
width: contentWidth,
height: contentHeight,
});
let url = canvas.toDataURL("image/jpeg", 0.9);
let a = document.createElement("a");
a.href = url;
a.download = title + ".jpg";
a.click();
setTimeout(() => URL.revokeObjectURL(url), 1000);
} catch (error) {
console.error("导出.jpg图片失败:", error);
} finally {
setTimeout(() => uploadeLoading.value = false, 3000);
}
};
let detailCountParam = {
businessTypes: [],
startTime: null,
endTime: null,
radioIDs: [],
};
let detailCountData = {};
const getDetailCountByDayBizType = (record) => {
exportTerminalBusinessDetailCountByDayBizType({
...detailCountParam,
currentPage: page.currentPage,
pageSize: page.pageSize,
}).then((response) => {
commonResponse({
response,
onSuccess: () => {
detailCountData = response.data;
renderChartVoice(detailCountData, record);
renderChartOtherData(detailCountData, record);
},
});
});
};
const detailTitle = ref("");
const recordInfo = ref({});
//终端业务列标题枚举的索引
const bizTypesTitles = [
{ bizTypeValue: 1, enumValueIndex: 61, color: "#2FA5FB" },
{ bizTypeValue: 3, enumValueIndex: 63, color: "#7D51BC" },
{ bizTypeValue: 2, enumValueIndex: 62, color: "#2987B6" },
{ bizTypeValue: 4, enumValueIndex: 64, color: "#7A7CED" },
{ bizTypeValue: 5, enumValueIndex: 65, color: "#435088" },
];
const filteredbizTypesTitlesItems = computed(() => bizTypesTitles.slice(1));
const handleRowClick = (record) => {
showRecordChart.value = true;
detailTitle.value = t(queryColumnValue[115]) + `(Radio-${record.terminalID})`;
recordInfo.value = record;
detailCountParam.businessTypes = reqParam.businessTypes;
detailCountParam.startTime = reqParam.startTime;
detailCountParam.endTime = reqParam.endTime;
detailCountParam.radioIDs = [record.terminalID];
getDetailCountByDayBizType(record);
};
const renderChartVoice = (detailCountData, record) => {
const x = Object.keys(detailCountData).sort();
const y_1 = [];
x.forEach((key) => {
let nestedMap = detailCountData[key];
if (
nestedMap[bizTypesTitles[0].bizTypeValue] !== undefined &&
nestedMap[bizTypesTitles[0].bizTypeValue] !== null
) {
y_1.push(nestedMap[bizTypesTitles[0].bizTypeValue]);
}
});
const chartDomVoice = document.querySelector(
`#voice_business_by_date_${record.terminalID}`
);
const chart = echarts.init(chartDomVoice);
const option = {
color: ["#2FA5FB"],
tooltip: {
trigger: "axis",
axisPointer: {
type: "cross", // 鼠标滑过时显示交叉线
},
formatter: function (params) {
// 获取日期(x 轴的值)
const date = params[0].axisValue;
// 获取 y 轴的次数(即每个系列的值)
const count = params[0].value;
// 返回格式化后的内容
return `${date}<br>次数: ${count}`;
},
},
legend: {
itemGap: 20,
textStyle: {
color: "#202B40",
fontFamily: "PingFang SC",
fontSize: 13,
fontWeight: 400,
lineHeight: 22,
},
},
grid: {
left: "3%",
right: "10%",
bottom: "6%",
containLabel: true,
},
toolbox: {
feature: {
saveAsImage: {},
},
},
xAxis: {
type: "category",
boundaryGap: false,
data: x,
triggerEvent: true,
},
yAxis: {
type: "value",
name: t(queryColumnValue[118]),
nameTextStyle: {
color: "#778091",
fontFamily: "PingFang SC",
fontSize: 12,
fontWeight: 400,
lineHeight: 12,
align: "left",
},
minInterval: 1,
},
series: [
{
type: "line",
data: y_1,
symbol: "circle",
symbolSize: 5,
connectNulls: true,
},
],
};
option && chart.setOption(option);
};
let globalChartDomOtherData;
const renderChartOtherData = (detailCountData, record) => {
const x = Object.keys(detailCountData).sort();
const y_1 = [];
for (let i = 1; i < bizTypesTitles.length; i++) {
const y_2 = [];
x.forEach((key) => {
let nestedMap = detailCountData[key];
y_2.push(nestedMap[bizTypesTitles[i].bizTypeValue]);
});
y_1.push({ y_2: y_2, bizTypesTitles: bizTypesTitles[i] });
}
const chartDomOtherData = document.querySelector(
`#data_business_by_date_${record.terminalID}`
);
const chart = echarts.init(chartDomOtherData);
globalChartDomOtherData = chart;
const series = [];
for (let i = 0; i < y_1.length; i++) {
series.push({
name: t(queryColumnValue[y_1[i].bizTypesTitles.enumValueIndex]),
type: "line",
areaStyle: {},
data: y_1[i].y_2,
symbol: "circle",
symbolSize: 5,
connectNulls: true,
lineStyle: {
opacity: 0.7, // 透明度
width: 2,
color: y_1[i].bizTypesTitles.color,
emphasis: {
color: y_1[i].bizTypesTitles.color,
},
},
});
}
const option = {
color: ["#7D51BC", "#2987B6", "#7A7CED", "#435088"],
tooltip: {
trigger: "axis",
axisPointer: {
type: "cross", // 鼠标滑过时显示交叉线
},
},
legend: {
show: false,
itemGap: 20,
textStyle: {
color: "#202B40",
fontFamily: "PingFang SC",
fontSize: 13,
fontWeight: 400,
lineHeight: 22,
},
},
grid: {
left: "6%",
right: "10%",
bottom: "8%",
containLabel: true,
},
toolbox: {
feature: {
saveAsImage: {},
},
},
xAxis: {
type: "category",
boundaryGap: false,
data: x,
triggerEvent: true,
},
yAxis: {
type: "value",
name: t(queryColumnValue[118]),
nameTextStyle: {
color: "#778091",
fontFamily: "PingFang SC",
fontSize: 12,
fontWeight: 400,
lineHeight: 12,
align: "left",
},
minInterval: 1,
},
series: series,
};
option && chart.setOption(option);
};
const g0 = ref(false);
const g1 = ref(false);
const g2 = ref(false);
const g3 = ref(false);
const toggleLine = (name, index) => {
if (index == 0) {
g0.value = !g0.value;
}
if (index == 1) {
g1.value = !g1.value;
}
if (index == 2) {
g2.value = !g2.value;
}
if (index == 3) {
g3.value = !g3.value;
}
const option = globalChartDomOtherData.getOption();
if (Object.prototype.hasOwnProperty.call(option.legend[0].selected, name)) {
option.legend[0].selected[name] = !option.legend[0].selected[name];
} else {
option.legend[0].selected[name] = false;
}
globalChartDomOtherData.setOption(option, true);
};
const init = () => {
resetSearch();
};
init();
</script>
<style scoped lang="less">
.table-line {
box-sizing: border-box;
margin-top: 20px;
height: calc(100% - 60px);
}
.select-input {
width: 160px;
}
.title {
margin-top: 20px;
margin-left: 40px;
margin-top: 10px;
padding-left: 10px;
}
.content {
width: 100%;
margin-top: 20px;
&-item {
position: relative;
box-sizing: border-box;
border: 1px solid #e5e7ec;
border-radius: 10px;
padding: 20px;
&.box-1 {
width: 45%;
margin-left: 40px;
margin-right: 40px;
height: 420px;
.chart-1 {
height: 345px;
}
}
&.box-2 {
margin-left: 30px;
width: 45%;
height: 420px;
.chart-2 {
height: 345px;
}
}
&-title {
color: #192840;
font-family: "PingFang SC";
font-size: 18px;
font-style: normal;
font-weight: 600;
line-height: 28px; /* 155.556% */
text-align: center;
}
&-icon {
display: flex;
justify-content: center;
&-greyed-out-0 {
opacity: 0.5; /* 置灰效果 */
}
&-greyed-out-1 {
opacity: 0.5; /* 置灰效果 */
}
&-greyed-out-2 {
opacity: 0.5; /* 置灰效果 */
}
&-greyed-out-3 {
opacity: 0.5; /* 置灰效果 */
}
&-container {
display: flex;
cursor: pointer;
/* 中间的所有子元素 */
&:not(:first-child) {
margin-left: 40px;
}
&-inline {
width: 28px;
height: 15px;
border-radius: 5px;
margin-right: 5px;
}
&-text {
color: #192840;
font-family: "PingFang SC";
font-size: 12px;
font-style: normal;
line-height: 15px;
text-align: center;
}
}
}
}
}
</style>图表导出PDF/JPG/PNG
java
<template>
<a-spin
:size="80"
:loading="uploadeLoading"
:tip="loadingTip"
style="width: 100%; height: 100%"
>
<layout_1 :auto-height="true">
<div class="--search-line">
<div>
<div class="key">{{ $t(queryButtonValue[7]) }} </div>
<div class="val">
<a-range-picker
style="width: 280px"
:allow-clear="false"
:disabled-date="disabledDate"
v-model="param.timeRange"
>
<template #suffix-icon>
<svg-loader :width="20" :height="20" name="clock"></svg-loader>
</template>
<template #separator>
<svg-loader
:width="16"
:height="16"
name="arrow-right"
></svg-loader>
</template>
</a-range-picker>
</div>
</div>
<div>
<div class="key">{{ $t(queryButtonValue[8]) }} </div>
<div class="val">
<a-tree-select
class="arco-tree-select --arco-select"
style="width: 230px"
:field-names="{
key: 'serialNo',
title: 'name',
children: 'children',
}"
:data="treeSelectNodeData"
:multiple="true"
:tree-checkable="true"
tree-checked-strategy="child"
:max-tag-count="1"
v-model:model-value="param.repeaterSNs"
>
</a-tree-select>
</div>
</div>
<a-button class="huge" @click="search" type="primary">
<template #icon> <icon-search size="18" /> </template
>{{ $t(queryButtonValue[1]) }}
</a-button>
<a-button class="huge" @click="resetSearch">
<template #icon>
<svg-loader
:width="20"
:height="20"
name="reset"
></svg-loader> </template
>{{ $t(queryButtonValue[21]) }}
</a-button>
<a-dropdown @select="handleSelect">
<a-button
class="huge"
:disabled="!dataList?.length"
>
<template #icon> <icon-export size="18" /> </template
>{{ $t(queryButtonValue[3]) }}</a-button
>
<template #content>
<a-doption value="pdf">PDF</a-doption>
<a-doption value="png">PNG</a-doption>
<a-doption value="jpeg">JPEG</a-doption>
</template>
</a-dropdown>
</div>
<div class="statistics-box">
<a-scrollbar
outer-style="height: 100%; width: calc(100%)"
style="height: 100%; overflow: scroll"
>
<div class="statistics-box-id" ref="exportContentRef">
<div v-for="item in dataList" :key="item.repeaterSN">
<div class="title">
{{ $t(queryColumnValue[50]) }}({{ item.repeaterAlias }})
</div>
<div class="content" id="transfer_business_content_box">
<div class="content-item box-1 inline">
<div class="content-item-title">
{{ $t(queryColumnValue[46]) }}
</div>
<div
:id="`business_by_date_${item.repeaterSN}`"
class="chart-1"
></div>
</div>
<div class="content-item box-2 inline">
<div class="content-item-title">
{{ $t(queryColumnValue[48]) }}
</div>
<div
:id="`business_by_time_pie_${item.repeaterSN}`"
class="chart-2"
></div>
<div class="chart-2-tooltip">
<div
v-for="(percentage, key) in calculatedPercentages(item.datas)"
:key="key"
class="chart-2-tooltip-item"
>
<div
class="circle inline"
:style="{ background: colorChart[key] }"
></div>
<div class="text inline">{{ $t(statBusinessType[key]) }}</div>
<div class="sp-line inline"></div>
<div class="percentage inline">{{ percentage }}%</div>
</div>
</div>
</div>
<div class="content-item box-3">
<div class="content-item-title">
{{ $t(queryColumnValue[47]) }}
</div>
<div
:id="`business_by_time_${item.repeaterSN}`"
class="chart-3"
></div>
</div>
</div>
</div>
</div>
</a-scrollbar>
</div>
</layout_1>
</a-spin>
</template>
<script setup>
import Layout_1 from "@/views/pages/_common/layout_1.vue";
import * as moment from "moment/moment";
import * as echarts from "echarts";
import {nextTick, reactive, ref, inject, computed} from "vue";
import html2canvas from "html2canvas";
import JsPDF from "jspdf";
import { qryTransferNodeList } from "@/views/pages/topology/_request";
import { getTransferBusinessData } from "@/views/pages/business/_request";
const uploadeLoading = ref(false);
import {
commonResponse,
formatDateToYyyyMMddHHmmss,
} from "@/views/pages/_common";
import {
queryButtonValue,
queryColumnValue,
queryName,
} from "@/views/pages/_common/enum";
import {
colorChart,
statBusinessType,
exportSlot,
} from "@/views/pages/_common/enum";
const t = inject("t");
const param = reactive({
timeRange: [null, null],
repeaterSNs: [],
});
let reqParam = {
startTime: null,
endTime: null,
repeaterSNs: [],
};
const treeSelectNodeData = ref([]);
const exportType = ref('');
const getTransferNodeList = () => {
const principal = sessionStorage.getItem("principal");
if (principal) {
const principalObject = JSON.parse(principal);
qryTransferNodeList({ userName: principalObject.userName }).then(
(response) => {
treeSelectNodeData.value = [
{
serialNo: "-1",
name: t(queryButtonValue[22]),
children: response.data,
},
];
}
);
}
};
const dataList = ref([]);
const tableLoading = ref(false);
const getAllData = () => {
tableLoading.value = true;
getTransferBusinessData({
...reqParam,
})
.then((response) => {
tableLoading.value = false;
commonResponse({
response,
onSuccess: () => {
dataList.value = response.data;
nextTick(() => {
initCharts();
});
},
});
})
.catch((e) => (tableLoading.value = true));
};
const chartList = [];
const initCharts = () => {
chartList.splice(0, chartList.length - 1);
dataList.value?.forEach((item) => {
chartList.push(
initByDateLine(
item.repeaterSN,
item.businessDataDetailList1,
item.businessDataDetailList2
)
);
// chartList.push(
// initByTimeLine(
// item.repeaterSN,
// item.businessDataDetailList1,
// item.businessDataDetailList2
// )
// );
chartList.push(initBusinessTimePie(item.repeaterSN, item.datas));
});
window.removeEventListener("resize", () => {});
window.addEventListener("resize", () => {
chartList.forEach((item) => item.resize({ width: "auto", height: "auto" }));
});
};
const clickTimeInitByTimeChart = () => {};
const initByDateLine = (id, data, data2) => {
const x = [];
const y_1 = [];
const y_2 = [];
const length = Math.min(data?.length, data2?.length);
for (let i = 0; i < length; i++) {
// 确保数据存在,且不越界 {{ moment(record.startTime).format('YYYY-MM-DD HH:mm:ss') }}
if (data[i] && data2[i]) {
x.push(moment(data[i]?.date).format('YYYY-MM-DD')); // 根据索引从 data 中获取 date
y_1.push(data[i]?.keepTimeCount); // 根据索引从 data 中获取 value1
y_2.push(data2[i]?.keepTimeCount); // 根据索引从 data2 中获取 value2
} else {
// 处理缺失数据情况:根据需求可以选择忽略或使用默认值
if (data[i]) {
x.push(moment(data[i]?.date).format('YYYY-MM-DD'));
y_1.push(data[i]?.keepTimeCount);
y_2.push(null); // data2 缺失时,y_2 填充 null
} else if (data2[i]) {
x.push(moment(data[i]?.date).format('YYYY-MM-DD')); // 假设data2有 date 字段
y_1.push(null); // data 缺失时,y_1 填充 null
y_2.push(data2[i]?.keepTimeCount);
}
}
}
const chartDom = document.querySelector(`#business_by_date_${id}`);
const chart = echarts.init(chartDom);
const option = {
color: ["#3461BA", "#FFAE00"],
tooltip: {
trigger: "axis",
},
legend: {
itemGap: 20,
textStyle: {
color: "#202B40",
fontFamily: "PingFang SC",
fontSize: 13,
fontWeight: 400,
lineHeight: 22,
},
},
grid: {
left: "3%",
right: "4%",
bottom: "3%",
containLabel: true,
},
toolbox: {
feature: {
saveAsImage: {},
},
},
xAxis: {
type: "category",
boundaryGap: false,
data: x,
triggerEvent: true,
},
yAxis: {
type: "value",
name:
t(queryColumnValue[49]) +
` ${moment(reqParam.startTime).format("yyyy/MM/DD")}~${moment(
reqParam.endTime
).format("yyyy/MM/DD")}`,
nameTextStyle: {
color: "#778091",
fontFamily: "PingFang SC",
fontSize: 12,
fontWeight: 400,
lineHeight: 12,
align: "left",
},
},
series: [
{
name: t(exportSlot[1]),
type: "line",
data: y_1,
symbol: "none",
},
{
name: t(exportSlot[2]),
type: "line",
data: y_2,
symbol: "none",
},
],
};
option && chart.setOption(option);
chart.on("click", (obj) => {
initByTimeLine(id, data, data2, obj.value);
});
return chart;
};
const initByTimeLine = (id, data, data2, time) => {
const dataRes =
data.filter((item) => moment(item.date).format('YYYY-MM-DD') === time)[0]?.datas || {};
const data2Res =
data2.filter((item) => moment(item.date).format('YYYY-MM-DD') === time)[0]?.datas || {};
const x = [];
const y_1 = [];
const y_2 = [];
const keysData = Object.keys(Object.keys(dataRes));
const keysData2 = Object.keys(Object.keys(data2Res));
// 获取所有的键
const allKeys = new Set([...keysData, ...keysData2]);
// 遍历所有的键,确保处理每个小时的值
allKeys.forEach((key) => {
// 需要将 key 转换为数字,因为键是字符串类型的(例如 "0", "1", "2")
const numericKey = Number(key);
// 确保 data 中存在对应的键
if (
dataRes[numericKey] !== undefined &&
data2Res[numericKey] !== undefined
) {
x.push(Number(key)); // 使用小时作为 x 值
y_1.push(dataRes[numericKey]); // 从 data 中获取对应小时的数据
y_2.push(data2Res[numericKey]); // 从 data2 中获取对应小时的数据
} else {
// 如果 data 中有该键但 data2 没有,y_2 填充 null
if (dataRes[numericKey] !== undefined) {
x.push(Number(key));
y_1.push(dataRes[numericKey]);
y_2.push(null);
}
// 如果 data2 中有该键但 data 没有,y_1 填充 null
else if (data2Res[numericKey] !== undefined) {
x.push(Number(key));
y_1.push(null);
y_2.push(data2Res[numericKey]);
}
}
});
const chartDom = document.querySelector(`#business_by_time_${id}`);
const chart = echarts.init(chartDom);
const option = {
color: ["#3461BA", "#FFAE00"],
tooltip: {
trigger: "axis",
},
legend: {
itemGap: 20,
textStyle: {
color: "#202B40",
fontFamily: "PingFang SC",
fontSize: 13,
fontWeight: 400,
lineHeight: 22,
},
},
grid: {
left: "3%",
right: "4%",
bottom: "3%",
containLabel: true,
},
toolbox: {
feature: {
saveAsImage: {},
},
},
xAxis: {
type: "category",
boundaryGap: false,
data: x,
},
yAxis: {
type: "value",
name: t(queryColumnValue[49]) + ` ${moment(time).format("yyyy/MM/DD")}`,
nameTextStyle: {
color: "#778091",
fontFamily: "PingFang SC",
fontSize: 12,
fontWeight: 400,
lineHeight: 12,
align: "left",
},
},
series: [
{
name: t(exportSlot[1]),
type: "line",
data: y_1,
symbol: "none",
},
{
name: t(exportSlot[2]),
type: "line",
data: y_2,
symbol: "none",
},
],
};
option && chart.setOption(option);
return chart;
};
const initBusinessTimePie = (id, data) => {
const chartDom = document.querySelector(`#business_by_time_pie_${id}`);
const chart = echarts.init(chartDom);
const option = {
color: [
colorChart[0],
colorChart[1],
colorChart[2],
colorChart[3],
colorChart[4],
],
tooltip: {
trigger: "item",
formatter: "{b} : {c}",
},
series: [
{
type: "pie",
radius: ["50%", "80%"],
padAngle: 0.5,
label: {
show: true,
alignTo: "labelLine",
position: "outer",
color: "#192840",
fontSize: 12,
fontWeight: 400,
lineHeight: 22,
fontFamily: "PingFang SC",
formatter: "{d}%",
},
labelLine: {
show: true,
length: 0,
length2: 40,
},
labelLayout: {
align: "center",
verticalAlign: "bottom",
},
data: [
{ value: data[4], name: t(queryColumnValue[54]) },
{ value: data[1], name: t(queryColumnValue[51]) },
{ value: data[2], name: t(queryColumnValue[52]) },
{ value: data[3], name: t(queryColumnValue[53]) },
{ value: data[5], name: t(queryColumnValue[55]) },
],
},
],
};
option && chart.setOption(option);
return chart;
};
const calculatedPercentages = (datas) => {
const total = Object.values(datas).reduce((sum, value) => sum + value, 0);
// 如果 total 为 0,设置所有百分比为 0
if (total === 0) {
return Object.keys(datas).reduce((result, key) => {
result[key] = "0.00";
return result;
}, {});
}
// 计算每个项的百分比
return Object.keys(datas).reduce((result, key) => {
const percentage = ((datas[key] / total) * 100).toFixed(2);
result[key] = percentage;
return result;
}, {});
};
const search = () => {
reqParam = {
...reqParam,
...param,
};
reqParam.startTime = moment(reqParam.timeRange[0]).format(
"YYYY-MM-DDT00:00:00.000"
);
reqParam.endTime = moment(reqParam.timeRange[1]).format(
"YYYY-MM-DDT23:59:59.999"
);
delete reqParam.timeRange;
getAllData();
};
const resetSearch = () => {
param.timeRange = [moment().add(-9, "days"), moment()];
param.repeaterSNs = [];
dataList.value = [];
};
const disabledDate = (date) => {
return date.getTime() > moment().format("x");
};
const exportContentRef = ref(null);
const loadingTip = computed(() => {
if (!exportType.value) return t('ExportStatus_Exporting');
return `${exportType.value} ${t('Outputting')}`;
});
const handleSelect = (t) => {
exportType.value = t;
uploadeLoading.value = true;
exportFormat(t);
};
// 处理不同格式的导出请求
const exportFormat = (format) => {
const title =
t(queryName["RepeatedService"]) + formatDateToYyyyMMddHHmmss(new Date());
if (format === "pdf") {
exportPdf(exportContentRef.value, title);
} else if (format === "png") {
exportPng(exportContentRef.value, title);
} else if (format === "jpeg") {
exportJpeg(exportContentRef.value, title);
}
};
// 导出 PDF
const exportPdf = async (el, title) => {
const PDF_WIDTH = 595.28; // A4标准宽度
const PDF_HEIGHT = 841.89; // A4标准高度
const getDynamicScale = (element) => {
try {
if (!element || !element.getBoundingClientRect) {
console.warn('getDynamicScale: 元素无效或不存在');
return 1;
}
const rect = element.getBoundingClientRect();
const area = rect.width * rect.height;
if (isNaN(area) || area <= 0) {
console.warn('getDynamicScale: 计算出的面积无效', { width: rect.width, height: rect.height, area });
return 1;
}
console.log('area', area, 'width:', rect.width, 'height:', rect.height);
const areaMB = area / 1000000;
if (!isFinite(areaMB)) {
console.warn('getDynamicScale: areaMB无效', areaMB);
return 1;
}
if (areaMB > 20) {
return 0.5;
} else if (areaMB > 15) {
return 0.75;
} else if (areaMB > 13) {
return 0.8;
} else if (areaMB > 10) {
return 0.9;
} else if (areaMB > 5) {
return 0.95;
} else if (areaMB > 3) {
return 1;
} else if (areaMB > 2) {
return 1.25;
} else if (areaMB > 1) {
return 1.5;
} else {
return 2;
}
} catch (error) {
console.error('getDynamicScale 发生错误:', error);
return 1;
}
};
const scale = getDynamicScale(el);
try {
const canvas = await html2canvas(el, {
allowTaint: true,
taintTest: false,
useCORS: true,
logging: false,
imageTimeout: 0,
scale: scale,
});
const contentWidth = canvas.width;
const contentHeight = canvas.height;
// 计算缩放比例
const imgWidth = PDF_WIDTH;
const imgHeight = (PDF_WIDTH / contentWidth) * contentHeight;
// 计算总页数
const totalPages = Math.ceil(imgHeight / PDF_HEIGHT);
const PDF = new JsPDF('p', 'pt', 'a4');
for (let i = 0; i < totalPages; i++) {
if (i > 0) PDF.addPage();
// 计算当前页的显示区域
const yPos = i * PDF_HEIGHT;
PDF.addImage(
canvas,
'PNG',
0, // x
-yPos, // y (负值实现滚动效果)
imgWidth,
imgHeight
);
}
PDF.save(`${title}.pdf`);
} catch (error) {
console.error("导出.pdf图片失败:", error);
} finally {
setTimeout(() => uploadeLoading.value = false, 3000);
}
};
// 导出 PNG
const exportPng = async (el, title) => {
const contentHeight = el.scrollHeight;
const contentWidth = el.scrollWidth;
try {
const canvas = await html2canvas(el, {
allowTaint: true,
taintTest: false,
useCORS: true,
logging: false,
imageTimeout: 0,
scale: 2,
scrollX: 0,
scrollY: 0,
width: contentWidth,
height: contentHeight,
});
let url = canvas.toDataURL("image/png");
let a = document.createElement("a");
a.href = url;
a.download = title + ".png";
a.click();
setTimeout(() => URL.revokeObjectURL(url), 1000);
} catch (error) {
console.error("导出.png图片失败:", error);
} finally {
setTimeout(() => uploadeLoading.value = false, 3000);
}
};
// 导出 JPEG
const exportJpeg = async (el, title) => {
const contentHeight = el.scrollHeight;
const contentWidth = el.scrollWidth;
try {
const canvas = await html2canvas(el, {
allowTaint: true,
taintTest: false,
useCORS: true,
logging: false,
imageTimeout: 0,
scale: 2,
scrollX: 0,
scrollY: 0,
width: contentWidth,
height: contentHeight,
});
let url = canvas.toDataURL("image/jpeg", 0.9);
let a = document.createElement("a");
a.href = url;
a.download = title + ".jpg";
a.click();
setTimeout(() => URL.revokeObjectURL(url), 1000);
} catch (error) {
console.error("导出.jpg图片失败:", error);
} finally {
setTimeout(() => uploadeLoading.value = false, 3000);
}
};
const init = () => {
resetSearch();
getTransferNodeList();
};
init();
</script>
<style scoped lang="less">
.statistics-box {
box-sizing: border-box;
height: calc(100vh - 140px);
.title {
overflow: hidden;
color: #192840;
font-family: "PingFang SC";
font-size: 20px;
font-style: normal;
font-weight: 600;
line-height: 72px; /* 160% */
height: 72px;
}
:deep(.arco-scrollbar-track-direction-vertical) {
right: -20px;
}
.content {
width: 100%;
&-item {
position: relative;
box-sizing: border-box;
border: 1px solid #e5e7ec;
border-radius: 10px;
padding: 20px;
&.box-1 {
width: calc(100% - 454px);
.chart-1 {
height: 343px;
}
}
&.box-2 {
margin-left: 20px;
width: 434px;
height: 413px;
.chart-2 {
height: 240px;
}
}
&.box-3 {
margin-top: 20px;
}
&-title {
color: #192840;
font-family: "PingFang SC";
font-size: 18px;
font-style: normal;
font-weight: 600;
line-height: 28px; /* 155.556% */
}
.chart-2-tooltip {
position: absolute;
display: flex;
justify-content: space-between;
flex-wrap: wrap;
left: 50%;
transform: translateX(-50%);
margin-top: 28px;
width: 330px;
&-item {
height: 22px;
min-width: 150px;
.circle {
margin-top: 6px;
border-radius: 5px;
height: 10px;
width: 10px;
}
.text {
margin-left: 8px;
min-width: 64px;
color: #202b40;
font-family: "PingFang SC";
font-size: 14px;
font-style: normal;
font-weight: 400;
line-height: 22px;
}
.sp-line {
margin-top: 5px;
margin-left: 6px;
width: 1px;
height: 12px;
background-color: #dde4ed;
}
.percentage {
margin-left: 12px;
color: #7987a3;
font-family: "PingFang SC";
font-size: 14px;
font-style: normal;
font-weight: 400;
line-height: 22px;
}
}
}
.chart-3 {
height: 343px;
}
}
}
}
</style>