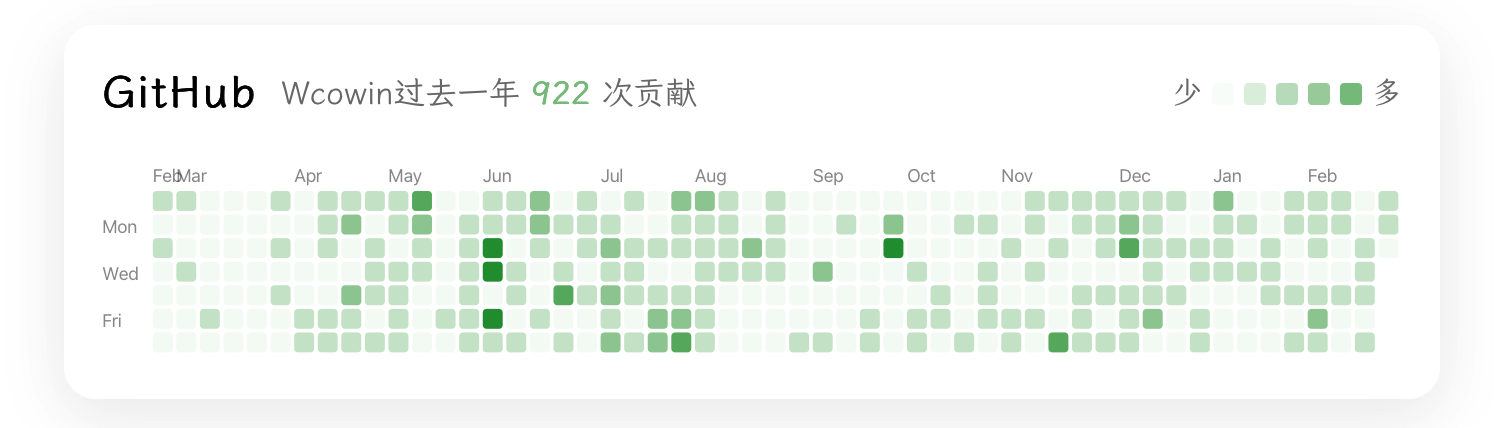
效果预览
下面这个玻璃风格的 GitHub 贡献热力图,就是本文要实现的组件(支持亮色 / 深色模式):
一、数据从哪里来?
我们没有直接调用 GitHub GraphQL API,而是使用了一个无需 Token 的第三方接口:
text
https://github-contributions-api.jogruber.de/v4/<你的 GitHub 用户名>?y=last返回的核心结构大致如下(只保留关键字段):
json
{
  "total": {
    "lastYear": 920
  },
  "contributions": [
    {
      "date": "2025-02-18",
      "count": 3,
      "level": 2
    }
    // ...
  ]
}total.lastYear:过去一年总贡献次数(我们用它展示右上角「过去一年 920 次贡献」)。contributions:按天排列的数组,每个元素包含:date: 日期count: 当天提交次数level: 强度等级(0--4),用来决定小方块的深浅。
二、HTML 结构:一张玻璃卡片
在你想放置热力图的位置(比如首页 docs/index.md),插入下面的 HTML 结构:
html
<!-- GitHub Contribution Heatmap Card -->
<div class="github-heatmap-glass-container">
  <div class="github-heatmap-glass-card">
    <div class="github-heatmap-header">
      <h3 class="github-heatmap-title">GitHub</h3>
      <span id="contribution-stats" class="github-heatmap-stats">
        过去一年 <strong id="stats-count">--</strong> 次贡献
      </span>
    </div>

    <div class="github-heatmap-content">
      <svg
        id="heatmapSvg"
        class="github-heatmap-svg"
        preserveAspectRatio="xMidYMid meet"
      ></svg>
    </div>

    <div class="github-heatmap-footer">
      <div class="github-heatmap-legend">
        <span class="legend-label">少</span>
        <div class="legend-cell" style="--opacity: 0.05;"></div>
        <div class="legend-cell" style="--opacity: 0.25;"></div>
        <div class="legend-cell" style="--opacity: 0.5;"></div>
        <div class="legend-cell" style="--opacity: 0.75;"></div>
        <div class="legend-cell" style="--opacity: 1;"></div>
        <span class="legend-label">多</span>
      </div>
    </div>
  </div>

  <!-- Popover 提示框(带箭头) -->
  <div id="heatmapTooltip" class="github-heatmap-tooltip">
    <div class="github-heatmap-tooltip__arrow"></div>
    <div class="github-heatmap-tooltip__content"></div>
  </div>
</div>
几个关键点:
- 整个卡片用
github-heatmap-glass-card包裹,方便做玻璃拟物效果。 - 中间的
<svg id="heatmapSvg">只是一个占位容器,真正的网格是后面用 JavaScript 动态绘制的。 - 右下角的图例(少 / 多)用纯 HTML + CSS 实现,方便和主题颜色统一。
三、CSS:玻璃拟物 + 深色模式适配
接下来在同一页面里插入一段 <style>,主要包含三部分:
- 卡片布局与玻璃效果
- SVG 容器和图例样式
- 深色主题下的对比度优化(配合 Zensical 的
slate方案)
html
<style>
  .github-heatmap-glass-container {
    position: relative;
    margin-bottom: 20px;
    margin-top: 20px;
  }

  .github-heatmap-glass-card {
    background: rgba(255, 255, 255, 0.7);
    backdrop-filter: blur(10px);
    -webkit-backdrop-filter: blur(10px);
    border: 1px solid rgba(255, 255, 255, 0.3);
    border-radius: 16px;
    padding: 14px 18px;
    box-shadow: 0 8px 32px rgba(0, 0, 0, 0.08);
  }

  /* Zensical 深色主题 (slate) 下的专用样式 */
  [data-md-color-scheme="slate"] .github-heatmap-glass-card {
    background: rgba(17, 24, 39, 0.96); /* #111827 */
    border-color: rgba(148, 163, 184, 0.55);
    box-shadow: 0 10px 32px rgba(0, 0, 0, 0.65);
  }

  .github-heatmap-header {
    display: flex;
    align-items: baseline;
    justify-content: space-between;
    margin-bottom: 8px;
    gap: 10px;
  }

  .github-heatmap-title {
    font-size: 1.1rem;
    font-weight: 600;
    margin: 0;
    color: var(--md-typeset-color);
    letter-spacing: 0.5px;
  }

  .github-heatmap-stats {
    font-size: 0.8rem;
    color: var(--md-typeset-color);
    opacity: 0.6;
    white-space: nowrap;
  }

  .github-heatmap-stats strong {
    color: #239a3b;
    font-weight: 700;
    opacity: 1;
  }

  .github-heatmap-content {
    position: relative;
    overflow-x: auto;
    overflow-y: hidden;
    margin: 0 -12px;
    padding: 0 12px;
  }

  .github-heatmap-svg {
    width: 100%;
    height: auto;
    display: block;
    min-height: 110px;
    cursor: default;
  }

  .github-heatmap-footer {
    display: flex;
    justify-content: flex-end;
    margin-top: 10px;
  }

  .github-heatmap-legend {
    display: flex;
    align-items: center;
    gap: 5px;
    font-size: 0.75rem;
    color: var(--md-typeset-color);
    opacity: 0.6;
  }

  .legend-label {
    font-weight: 500;
  }

  .legend-cell {
    width: 11px;
    height: 11px;
    border-radius: 2px;
    background-color: #239a3b;
    opacity: var(--opacity, 0.5);
    flex-shrink: 0;
  }

  /* Popover 提示框样式(带箭头) */
  .github-heatmap-tooltip {
    position: fixed;
    pointer-events: none;
    z-index: 1000;
    display: none;
  }

  .github-heatmap-tooltip.visible {
    display: block;
    animation: tooltipFadeIn 150ms ease-out;
  }

  .github-heatmap-tooltip__content {
    background: rgba(30, 30, 30, 0.95);
    backdrop-filter: blur(12px);
    -webkit-backdrop-filter: blur(12px);
    border: none;
    border-radius: 8px;
    padding: 8px 12px;
    font-size: 0.75rem;
    font-weight: 500;
    color: #fff;
    white-space: nowrap;
    box-shadow: 0 4px 16px rgba(0, 0, 0, 0.25);
    position: relative;
  }

  /* 深色模式适配 */
  [data-md-color-scheme="slate"] .github-heatmap-tooltip__content {
    background: rgba(17, 24, 39, 0.95);
  }

  .github-heatmap-tooltip__arrow {
    position: absolute;
    width: 0;
    height: 0;
    border-style: solid;
  }

  /* 箭头向上(Tooltip 在格子下方时) */
  .github-heatmap-tooltip.arrow-top .github-heatmap-tooltip__arrow {
    bottom: 100%;
    left: 50%;
    transform: translateX(-50%);
    border-width: 0 6px 6px 6px;
    border-color: transparent transparent rgba(30, 30, 30, 0.95) transparent;
    filter: drop-shadow(0 -2px 4px rgba(0, 0, 0, 0.1));
    margin-bottom: -1px; /* 让箭头和 content 无缝连接 */
  }

  [data-md-color-scheme="slate"] .github-heatmap-tooltip.arrow-top .github-heatmap-tooltip__arrow {
    border-color: transparent transparent rgba(17, 24, 39, 0.95) transparent;
  }

  /* 箭头向下(Tooltip 在格子上方时) */
  .github-heatmap-tooltip.arrow-bottom .github-heatmap-tooltip__arrow {
    top: 100%;
    left: 50%;
    transform: translateX(-50%);
    border-width: 6px 6px 0 6px;
    border-color: rgba(30, 30, 30, 0.95) transparent transparent transparent;
    filter: drop-shadow(0 2px 4px rgba(0, 0, 0, 0.1));
    margin-top: -1px; /* 让箭头和 content 无缝连接 */
  }

  [data-md-color-scheme="slate"] .github-heatmap-tooltip.arrow-bottom .github-heatmap-tooltip__arrow {
    border-color: rgba(17, 24, 39, 0.95) transparent transparent transparent;
  }

  @keyframes tooltipFadeIn {
    from {
      opacity: 0;
      transform: translateY(-4px);
    }
    to {
      opacity: 1;
      transform: translateY(0);
    }
  }
</style>
如果你已经在首页里复制过这段样式,可以只挑关键部分合并,不必重复粘贴。
四、JavaScript:把数据画成热力图
核心思路:
- 页面加载后,通过
fetch调用 API。 - 根据返回的
contributions计算网格尺寸,将一维数组映射成「按周分列、每列 7 天」的矩阵。 - 用 SVG 的
<rect>画出每个小方块,level不同用不同透明度。 - 给每个
<rect>绑定mouseenter/mousemove/mouseleave,控制 Tooltip 的显示。
html
<script>
  (function () {
    const username = "Wcowin"; // TODO:换成你的 GitHub 用户名

    const CELL = 11;
    const GAP = 3;
    const ROWS = 7;
    const LEVEL_OPACITY = [0.05, 0.25, 0.5, 0.75, 1.0];
    const MONTHS = ["Jan","Feb","Mar","Apr","May","Jun","Jul","Aug","Sep","Oct","Nov","Dec"];
    const DAYS = ["", "Mon", "", "Wed", "", "Fri", ""];

    function formatDate(dateStr) {
      const d = new Date(dateStr);
      return `${d.getFullYear()}年${d.getMonth() + 1}月${d.getDate()}日`;
    }

    async function loadHeatmap() {
      try {
        const response = await fetch(
          `https://github-contributions-api.jogruber.de/v4/${username}?y=last`
        );
        const data = await response.json();
        renderHeatmap(data);
      } catch (error) {
        console.error("Error loading GitHub contributions:", error);
        document.getElementById("stats-count").textContent = "--";
      }
    }

    function renderHeatmap(data) {
      const svg = document.getElementById("heatmapSvg");
      const statsEl = document.getElementById("stats-count");
      const tooltipEl = document.getElementById("heatmapTooltip");

      if (!svg) return;

      statsEl.textContent = data.total.lastYear;

      const weeks = Math.ceil(data.contributions.length / ROWS);
      const labelOffset = 28;
      const headerOffset = 16;
      const svgWidth = labelOffset + weeks * (CELL + GAP);
      const svgHeight = headerOffset + ROWS * (CELL + GAP);

      svg.setAttribute("viewBox", `0 0 ${svgWidth} ${svgHeight}`);
      svg.innerHTML = "";

      const monthLabels = [];
      let lastMonth = -1;
      for (let w = 0; w < weeks; w++) {
        const idx = w * ROWS;
        if (idx < data.contributions.length) {
          const month = new Date(data.contributions[idx].date).getMonth();
          if (month !== lastMonth) {
            monthLabels.push({
              label: MONTHS[month],
              x: labelOffset + w * (CELL + GAP),
            });
            lastMonth = month;
          }
        }
      }

      const ns = "http://www.w3.org/2000/svg";

      // 顶部月份标签
      monthLabels.forEach((m) => {
        const text = document.createElementNS(ns, "text");
        text.setAttribute("x", m.x);
        text.setAttribute("y", 11);
        text.setAttribute("class", "heatmap-label");
        text.setAttribute("font-size", 10);
        text.textContent = m.label;
        svg.appendChild(text);
      });

      // 左侧星期标签
      DAYS.forEach((d, i) => {
        if (d) {
          const text = document.createElementNS(ns, "text");
          text.setAttribute("x", 0);
          text.setAttribute(
            "y",
            headerOffset + i * (CELL + GAP) + CELL - 1
          );
          text.setAttribute("class", "heatmap-label");
          text.setAttribute("font-size", 9);
          text.textContent = d;
          svg.appendChild(text);
        }
      });

      // 贡献格子
      data.contributions.forEach((day, idx) => {
        const col = Math.floor(idx / ROWS);
        const row = idx % ROWS;
        const rect = document.createElementNS(ns, "rect");

        rect.setAttribute("x", labelOffset + col * (CELL + GAP));
        rect.setAttribute("y", headerOffset + row * (CELL + GAP));
        rect.setAttribute("width", CELL);
        rect.setAttribute("height", CELL);
        rect.setAttribute("rx", 2);
        rect.setAttribute("ry", 2);
        rect.setAttribute("class", "heatmap-cell");
        rect.setAttribute("data-date", day.date);
        rect.setAttribute("data-count", day.count);

        const opacity = LEVEL_OPACITY[Math.min(day.level, 4)];
        rect.setAttribute("fill", `rgba(35, 154, 59, ${opacity})`);

        rect.addEventListener("mouseenter", (e) => {
          tooltip(day.date, day.count, e);
        });

        rect.addEventListener("mousemove", (e) => {
          tooltip(day.date, day.count, e);
        });

        rect.addEventListener("mouseleave", () => {
          tooltipEl.classList.remove("visible");
        });

        svg.appendChild(rect);
      });

      // 标签与 hover 高亮效果
      if (!document.querySelector("style[data-heatmap-style]")) {
        const style = document.createElement("style");
        style.setAttribute("data-heatmap-style", "");
        style.textContent = `
        .heatmap-label {
          fill: rgba(0, 0, 0, 0.4);
          font-family: -apple-system, BlinkMacSystemFont, 'Segoe UI', 'Roboto', sans-serif;
          font-size: 10px;
        }
        [data-md-color-scheme="slate"] .heatmap-label {
          fill: rgba(255, 255, 255, 0.7);
        }
        .heatmap-cell {
          transition: opacity 150ms, filter 150ms;
          cursor: default;
          filter: drop-shadow(0 0 0 rgba(35, 154, 59, 0));
        }
        .heatmap-cell:hover {
          opacity: 1 !important;
          filter: drop-shadow(0 2px 6px rgba(35, 154, 59, 0.4));
        }
      `;
        document.head.appendChild(style);
      }

      function tooltip(date, count, event) {
        const text =
          count > 0
            ? `${formatDate(date)}: ${count} 次贡献`
            : `${formatDate(date)}: 无贡献`;
        const contentEl = tooltipEl.querySelector(".github-heatmap-tooltip__content");
        if (contentEl) {
          contentEl.textContent = text;
        }
        tooltipEl.classList.add("visible");

        // 按格子定位:显示在对应格子正上方居中,箭头指向格子
        const target = event.currentTarget;
        const margin = 8;
        const gap = 8;

        if (target && target.getBoundingClientRect) {
          const cellRect = target.getBoundingClientRect();
          const tooltipRect = tooltipEl.getBoundingClientRect();

          let x = cellRect.left + cellRect.width / 2 - tooltipRect.width / 2;
          let y = cellRect.top - tooltipRect.height - gap;
          let arrowPosition = cellRect.left + cellRect.width / 2;
          let isAbove = true;

          const maxX = window.innerWidth - tooltipRect.width - margin;
          x = Math.max(margin, Math.min(x, maxX));

          if (y < margin) {
            y = cellRect.bottom + gap;
            isAbove = false;
          }

          tooltipEl.style.left = x + "px";
          tooltipEl.style.top = y + "px";

          // 设置箭头方向并计算箭头位置
          tooltipEl.classList.remove("arrow-top", "arrow-bottom");
          tooltipEl.classList.add(isAbove ? "arrow-bottom" : "arrow-top");

          const arrowEl = tooltipEl.querySelector(".github-heatmap-tooltip__arrow");
          if (arrowEl) {
            const arrowOffset = arrowPosition - x;
            arrowEl.style.left = arrowOffset + "px";
          }
        }
      }
    }

    if (document.readyState === "loading") {
      document.addEventListener("DOMContentLoaded", loadHeatmap);
    } else {
      loadHeatmap();
    }
  })();
</script>
到这里,一个带 Tooltip 的 GitHub 贡献热力图就完成了。
五、接入步骤总结
1.在目标页面插入 HTML 卡片结构 (github-heatmap-glass-card + svg#heatmapSvg)。
2.添加 CSS :卡片玻璃风格、SVG 布局、Tooltip 样式,以及 [data-md-color-scheme="slate"] 下的深色适配。
3.在页面底部插入 JavaScript,把:
- GitHub 用户名替换为你自己的;
- 如有需要,可调整颜色或字体大小。
如果你已经在首页实现了这张卡片,可以把这篇文档当作「拆解说明」,方便之后在其它 Zensical 站点复制复用。