1.在grafana上生成 token,参考前面的文章
2.在grafana服务端使用docker安装 grafana mcp server
bash
docker run -d -p 8000:8000 -e GRAFANA_URL=http://grafana的ip:端口 -e GRAFANA_SERVICE_ACCOUNT_TOKEN='Tokenxxxx' mcp/grafana

docker ps|grep mcp
14477871b265   mcp/grafana                                    "/app/mcp-grafana --..."   5 seconds ago   Up 5 seconds             0.0.0.0:8000->8000/tcp, [::]:8000->8000/tcp                                                                                                                                                        tender_davinci
3.在codebuddy上添加mcp配置
填写Grafana MCP Server的连接信息:
服务器地址:http://<你的mcp-server地址>:端口
传输协议:通常为SSE或HTTP(根据MCP Server实现而定,我的地址就是:http://<你的mcp-server地址>:端口/sse)。
名称自定义,我命名为grafana-mcp。
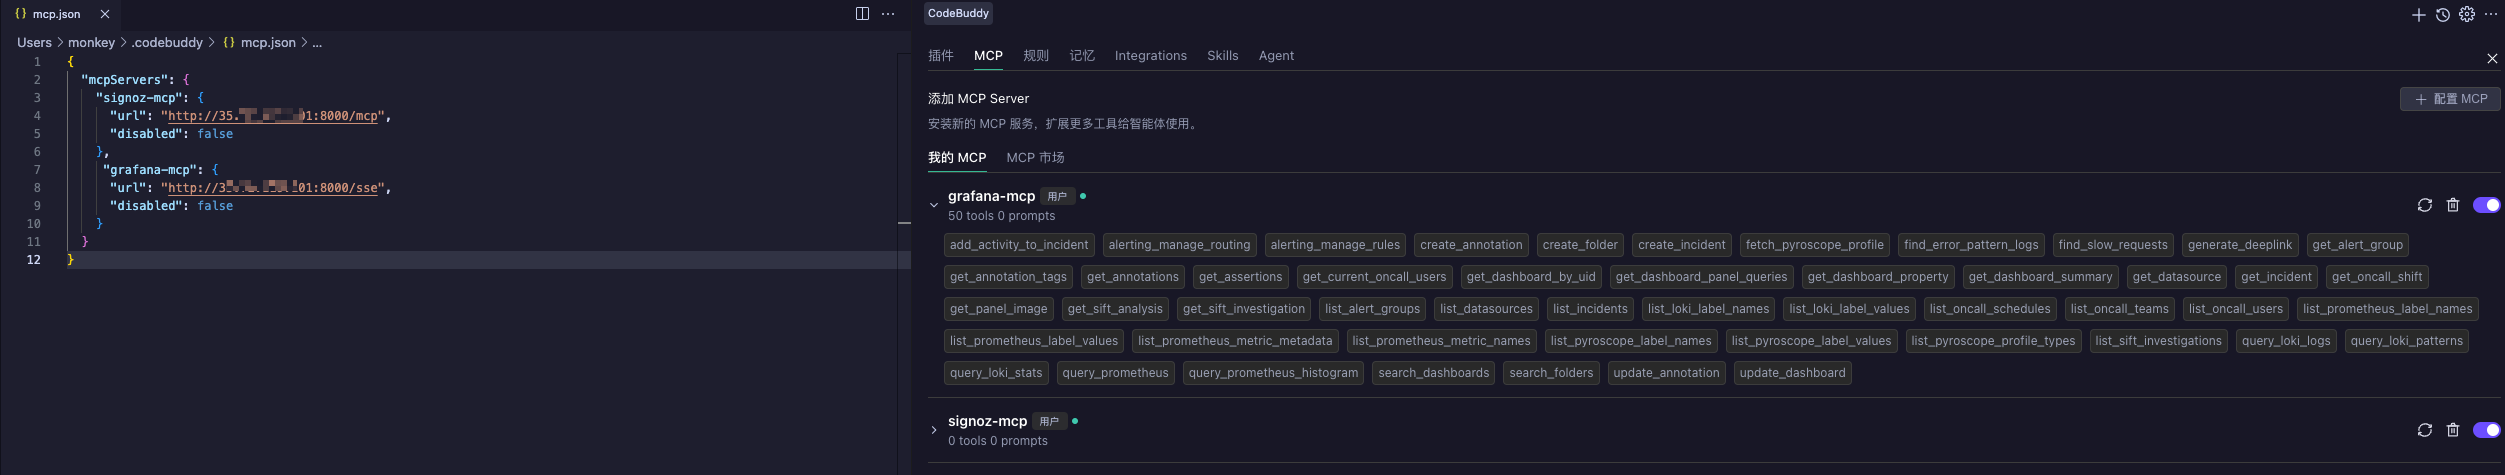
添加多个mcp server的样例如下:
bash
{
"mcpServers": {
"signoz-mcp": {
"url": "http://公网ip:8000/mcp",
"disabled": false
},
"grafana-mcp": {
"url": "http://公网ip:8000/sse",
"disabled": false
}
}
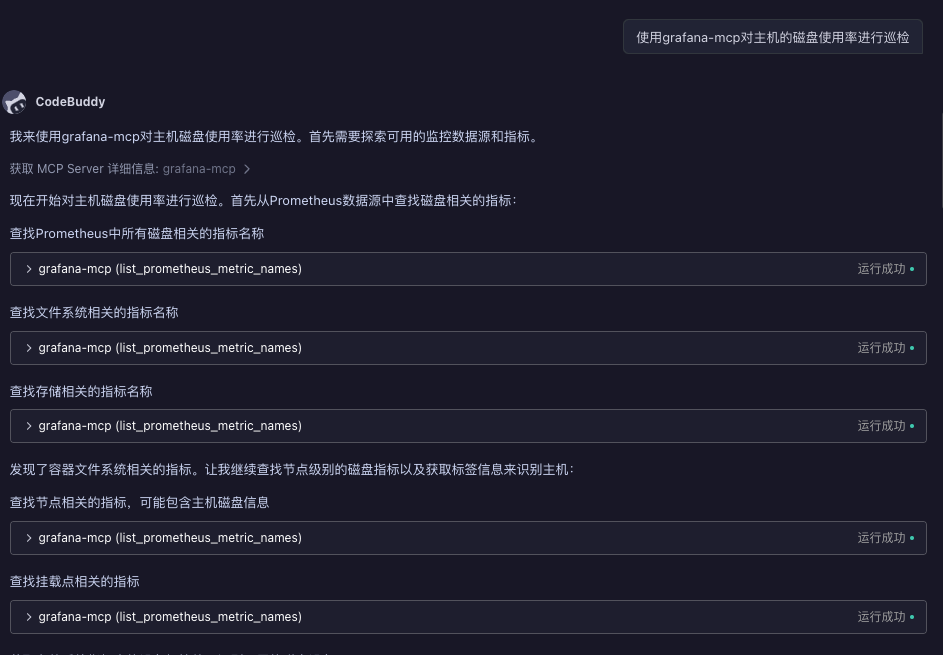
}4.使用codebuddy 自动巡检