Handsontable 是一款功能强大、高性能的 JavaScript 电子表格组件库,它提供了类似 Excel 的交互体验,支持多种前端框架集成,适用于构建数据密集型应用。以下是对 Handsontable 的详细介绍:
一、核心功能
-
数据编辑与验证:
- 支持多种数据类型,包括文本、数字、日期、下拉选择等。
- 提供数据验证功能,确保输入数据的准确性和完整性。
-
数据排序与过滤:
- 支持单列或多列排序,方便用户快速浏览和分析数据。
- 提供列筛选功能,用户可以根据条件筛选数据。
-
公式计算:
- 内置公式引擎,支持常用数学函数和自定义公式。
- 用户可以在表格中进行复杂的计算,满足各种业务需求。
-
单元格合并与拆分:
- 支持灵活的单元格合并和拆分功能,方便展示复杂信息。
-
剪贴板操作:
- 提供完整的剪贴板支持,包括复制、剪切和粘贴操作。
- 用户可以像操作 Excel 一样轻松处理数据。
-
主题与样式:
- 提供多种内置主题和样式,支持自定义样式以满足不同需求。
- 用户可以通过 CSS 变量调整表格的外观和风格。
二、性能优化
-
虚拟滚动:
- 支持虚拟滚动技术,可流畅处理数万行数据。
- 适合大数据量场景,提高渲染速度和响应速度。
-
客户端行分页:
- Handsontable 16.1.0 引入了客户端行分页功能。
- 允许用户将大型表格划分为更小、更易于管理的区块,提高性能和可用性。
三、多框架支持
-
React:
- 提供专门的 React 组件和 hooks,方便在 React 项目中集成。
-
Angular:
- 提供完整的 Angular 包装器和指令,支持在 Angular 项目中使用。
-
Vue:
- 支持 Vue 2 和 Vue 3 版本,提供相应的封装库。
-
纯 JavaScript:
- 也可以在纯 JavaScript 项目中直接使用 Handsontable。
四、应用场景
-
资源规划软件(ERP):
- 用于显示和编辑库存、订单、客户等数据。
-
库存管理系统:
- 提供直观的数据输入和编辑界面,实时更新库存状态。
-
数字平台:
- 用于展示和编辑用户数据、配置信息等。
-
数据建模应用:
- 处理大量数据,提供强大的数据编辑和验证功能。
五、优势与特点
-
易用性:
- 类 Excel 交互体验,降低用户学习成本。
- 开发者可以通过简单配置快速集成 Handsontable。
-
灵活性:
- 支持自定义渲染、插件扩展,适配多样化业务需求。
- 提供丰富的 API 和回调函数,方便开发者进行定制和扩展。
-
性能:
- 虚拟滚动技术确保大数据量下的流畅操作。
- 客户端行分页功能进一步提高性能和可用性。
-
生态完善:
- 提供 TypeScript 类型定义、详细 API 文档及社区支持。
- 开发者可以轻松获取帮助和资源,提高开发效率。
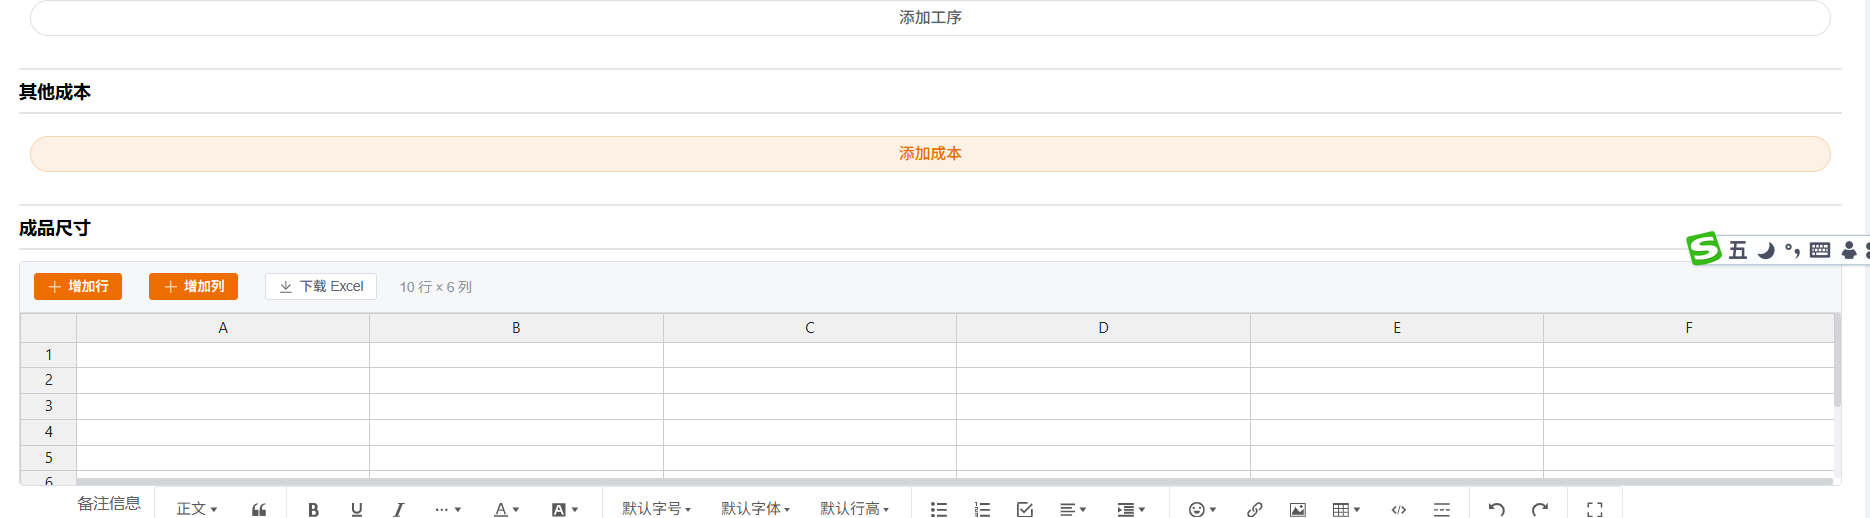
VUE3整合实现例子
<template>
  <div class="diy-excel">
    <div class="diy-excel-toolbar">
      <el-button type="primary" size="small" @click="addRow">
        <el-icon><Plus /></el-icon>
        增加行
      </el-button>
      <el-button type="primary" size="small" @click="addColumn">
        <el-icon><Plus /></el-icon>
        增加列
      </el-button>
      <el-button size="small" @click="downloadExcel">
        <el-icon><Download /></el-icon>
        下载 Excel
      </el-button>
      <span class="diy-excel-info">{{ infoText }}</span>
    </div>
    <div class="diy-excel-hot" ref="hotContainerRef"></div>
  </div>
</template>

<script setup>
import { ref, computed, watch, onMounted, onBeforeUnmount, nextTick } from 'vue'
import { Plus, Download } from '@element-plus/icons-vue'
import Handsontable from 'handsontable'
import 'handsontable/dist/handsontable.full.min.css'
import * as XLSX from 'xlsx'

const DEFAULT_ROWS = 10
const DEFAULT_COLS = 6

const props = defineProps({
  /** 二维数组 [行][列],字符串。不传则默认 10×6 空表 */
  modelValue: {
    type: Array,
    default: undefined,
  },
})

const emit = defineEmits(['update:modelValue'])

const hotContainerRef = ref(null)
let hot = null
let resizeObserver = null
const stats = ref({ rows: DEFAULT_ROWS, cols: DEFAULT_COLS })

function toPlainData(val) {
  if (!val || !Array.isArray(val) || val.length === 0) return null
  return val.map((row) =>
    Array.isArray(row)
      ? row.map((cell) => (cell != null && cell !== undefined ? String(cell) : ''))
      : []
  )
}

function getDefaultData() {
  return Array.from({ length: DEFAULT_ROWS }, () =>
    Array.from({ length: DEFAULT_COLS }, () => '')
  )
}

function getDataToLoad() {
  const plain = toPlainData(props.modelValue)
  return plain || getDefaultData()
}

function snapshot() {
  if (!hot) return
  const data = hot.getData()
  const out = data.map((row) => (row ? [...row] : []))
  stats.value = { rows: out.length, cols: Math.max(0, ...out.map((r) => (r ? r.length : 0))) }
  emit('update:modelValue', out)
}

function createHot() {
  if (!hotContainerRef.value) return
  if (hot) {
    hot.destroy()
    hot = null
  }
  const data = getDataToLoad()
  const container = hotContainerRef.value
  const initialHeight = container.clientHeight || 300
  hot = new Handsontable(container, {
    data,
    rowHeaders: true,
    colHeaders: true,
    width: '100%',
    height: initialHeight,
    stretchH: 'all',
    manualColumnResize: true,
    manualRowResize: true,
    readOnly: false,
    licenseKey: 'non-commercial-and-evaluation',
    afterChange(_, source) {
      if (source !== 'loadData') snapshot()
    },
    afterCreateRow(_, __, source) {
      if (source !== 'loadData') snapshot()
    },
    afterRemoveRow() {
      snapshot()
    },
    afterCreateCol(_, __, source) {
      if (source !== 'loadData') snapshot()
    },
    afterRemoveCol() {
      snapshot()
    },
  })
  snapshot()
  resizeObserver = new ResizeObserver((entries) => {
    const entry = entries[0]
    if (entry && hot) {
      const h = entry.contentRect.height
      if (h > 0) hot.updateSettings({ height: h })
    }
  })
  resizeObserver.observe(container)
}

watch(
  () => props.modelValue,
  (val) => {
    const plain = toPlainData(val)
    if (!plain || !hot) return
    hot.loadData(plain)
    stats.value = {
      rows: plain.length,
      cols: Math.max(0, ...plain.map((r) => (r ? r.length : 0))),
    }
  },
  { deep: true }
)

onMounted(() => {
  nextTick(() => createHot())
})

onBeforeUnmount(() => {
  if (resizeObserver && hotContainerRef.value) {
    resizeObserver.unobserve(hotContainerRef.value)
    resizeObserver = null
  }
  if (hot) {
    hot.destroy()
    hot = null
  }
})

const infoText = computed(() => `${stats.value.rows} 行 × ${stats.value.cols} 列`)

function addRow() {
  if (hot) hot.alter('insert_row_below', hot.countRows() - 1)
}

function addColumn() {
  if (hot) hot.alter('insert_col_end')
}

function downloadExcel() {
  const data = hot ? hot.getData() : getDataToLoad()
  if (!data || data.length === 0) return
  const aoa = data.map((row) => (row ? row.map((c) => (c != null ? c : '')) : []))
  const wb = XLSX.utils.book_new()
  XLSX.utils.book_append_sheet(wb, XLSX.utils.aoa_to_sheet(aoa), 'Sheet1')
  XLSX.writeFile(wb, `表格_${new Date().toISOString().slice(0, 10)}.xlsx`)
}
</script>

<style lang="scss" scoped>
.diy-excel {
  width: 100%;
  height: 100%;
  min-height: 200px;
  display: flex;
  flex-direction: column;
  border: 1px solid #dcdfe6;
  border-radius: 4px;
  overflow: hidden;
  background: #fff;
  box-sizing: border-box;
}

.diy-excel-toolbar {
  flex-shrink: 0;
  display: flex;
  align-items: center;
  gap: 12px;
  padding: 10px 12px;
  background: #f5f7fa;
  border-bottom: 1px solid #dcdfe6;
}

.diy-excel-info {
  color: #909399;
  font-size: 12px;
  margin-left: 8px;
}

.diy-excel-hot {
  flex: 1;
  min-height: 0;
  width: 100%;
  overflow: auto;
  :deep(.handsontable) {
    position: relative;
    z-index: 0;
  }
}
</style>