TEST01数据来自DBA_OBJECTS,重复512次,共4500W行,占用5G存储空间
create table test_a as select rowid as rid,a.* from test01 a;
create table test_b as select rowid as rid,a.* from test01 a;

begin
  DBMS_STATS.GATHER_TABLE_STATS(ownname          => 'SCOTT',
                                tabname          => 'TEST_A',
                                estimate_percent => 100, ---oracle改成100,崖山改成1
                                method_opt       => 'for all columns size auto',
                                no_invalidate    => FALSE,
                                degree           => 6,
                                granularity      => 'ALL',
                                cascade          => TRUE);
end;
/
begin
  DBMS_STATS.GATHER_TABLE_STATS(ownname          => 'SCOTT',
                                tabname          => 'TEST_B',
                                estimate_percent => 100, ---oracle改成100,崖山改成1
                                method_opt       => 'for all columns size auto',
                                no_invalidate    => FALSE,
                                degree           => 6,
                                granularity      => 'ALL',
                                cascade          => TRUE);
end;
/
HASH JOIN场景太多了,有内连接,外连接,全外连接,半连接,反连接,1个列关联,多个列关联,JOIN+非等值关联过滤,小表JOIN大表,大表JOIN大表,1:1关联,1:N关联,N:N关联,以及各种不同数据类型列关联等等,这么多场景根本测不完,我这里选择大表JOIN大表1:1关联,关联列使用ROWID类型,也算是具有代表性了
崖山23.5.1相关参数设置,重启DB后生效
alter system set DATA_BUFFER_SIZE=16G scope=spfile;  ---BUFFER CACHE设置为16G
alter system set "_HOT_BUFFER_PCT"=25 scope=spfile;  ---热块占用比例设置为25%,使得全表扫描后表能被CACHE在内存中
alter system set MEX_POOL_SIZE=8G scope=spfile;      ---批量模式HASH JOIN,HASH GROUP BY,ORDER专用内存
alter system set VM_BUFFER_SIZE=8G scope=spfile;     ---行存表ORDER BY,HASH JOIN存放中间结果集临时缓存
Oracle19c设置SGA=16G,PGA=16G,修改直接路径读参数=never
alter system set "_serial_direct_read"=never;测试SQL共4条,测试Oracle19c物理机,Oracle19c虚拟机,崖山23.5.1虚拟机单行模式,崖山23.5.1虚拟机批量模式4条SQL4种场景性能表现
注意事项:
1.崖山23.5.1版本中,批量模式需要添加HINT batch_mode(2)
2.崖山并行不能直接parallel(4),需要对表设置并行度(行为和Oracle10g相似),另外崖山并行必须使用批量模式,完整HINT parallel(a,4) parallel(b,4) batch_mode(2)
测试SQL如下(崖山批量模式,并行需要添加HINT):
select count(*) from test_a a, test_b b where a.rid = b.rid;

select count(distinct a.object_id),count(distinct b.object_name) from test_a a, test_b b where a.rid = b.rid;

select count(distinct a.owner),
       count(distinct a.object_name),
       count(distinct a.subobject_name),
       count(distinct a.object_id),
       count(distinct a.data_object_id),
       count(distinct a.object_type),
       count(distinct a.created),
       count(distinct a.last_ddl_time),
       count(distinct a.timestamp),
       count(distinct a.status),
       count(distinct a.temporary),
       count(distinct a.generated),
       count(distinct a.secondary),
       count(distinct a.namespace),
       count(distinct a.edition_name),
       count(distinct b.owner),
       count(distinct b.object_name),
       count(distinct b.subobject_name),
       count(distinct b.object_id),
       count(distinct b.data_object_id),
       count(distinct b.object_type),
       count(distinct b.created),
       count(distinct b.last_ddl_time),
       count(distinct b.timestamp),
       count(distinct b.status),
       count(distinct b.temporary),
       count(distinct b.generated),
       count(distinct b.secondary),
       count(distinct b.namespace),
       count(distinct b.edition_name)
  from test_a a, test_b b
 where a.rid = b.rid;

select /*+ parallel(4) */ count(distinct a.owner),
       count(distinct a.object_name),
       count(distinct a.subobject_name),
       count(distinct a.object_id),
       count(distinct a.data_object_id),
       count(distinct a.object_type),
       count(distinct a.created),
       count(distinct a.last_ddl_time),
       count(distinct a.timestamp),
       count(distinct a.status),
       count(distinct a.temporary),
       count(distinct a.generated),
       count(distinct a.secondary),
       count(distinct a.namespace),
       count(distinct a.edition_name),
       count(distinct b.owner),
       count(distinct b.object_name),
       count(distinct b.subobject_name),
       count(distinct b.object_id),
       count(distinct b.data_object_id),
       count(distinct b.object_type),
       count(distinct b.created),
       count(distinct b.last_ddl_time),
       count(distinct b.timestamp),
       count(distinct b.status),
       count(distinct b.temporary),
       count(distinct b.generated),
       count(distinct b.secondary),
       count(distinct b.namespace),
       count(distinct b.edition_name)
  from test_a a, test_b b
 where a.rid = b.rid;
测试结果:
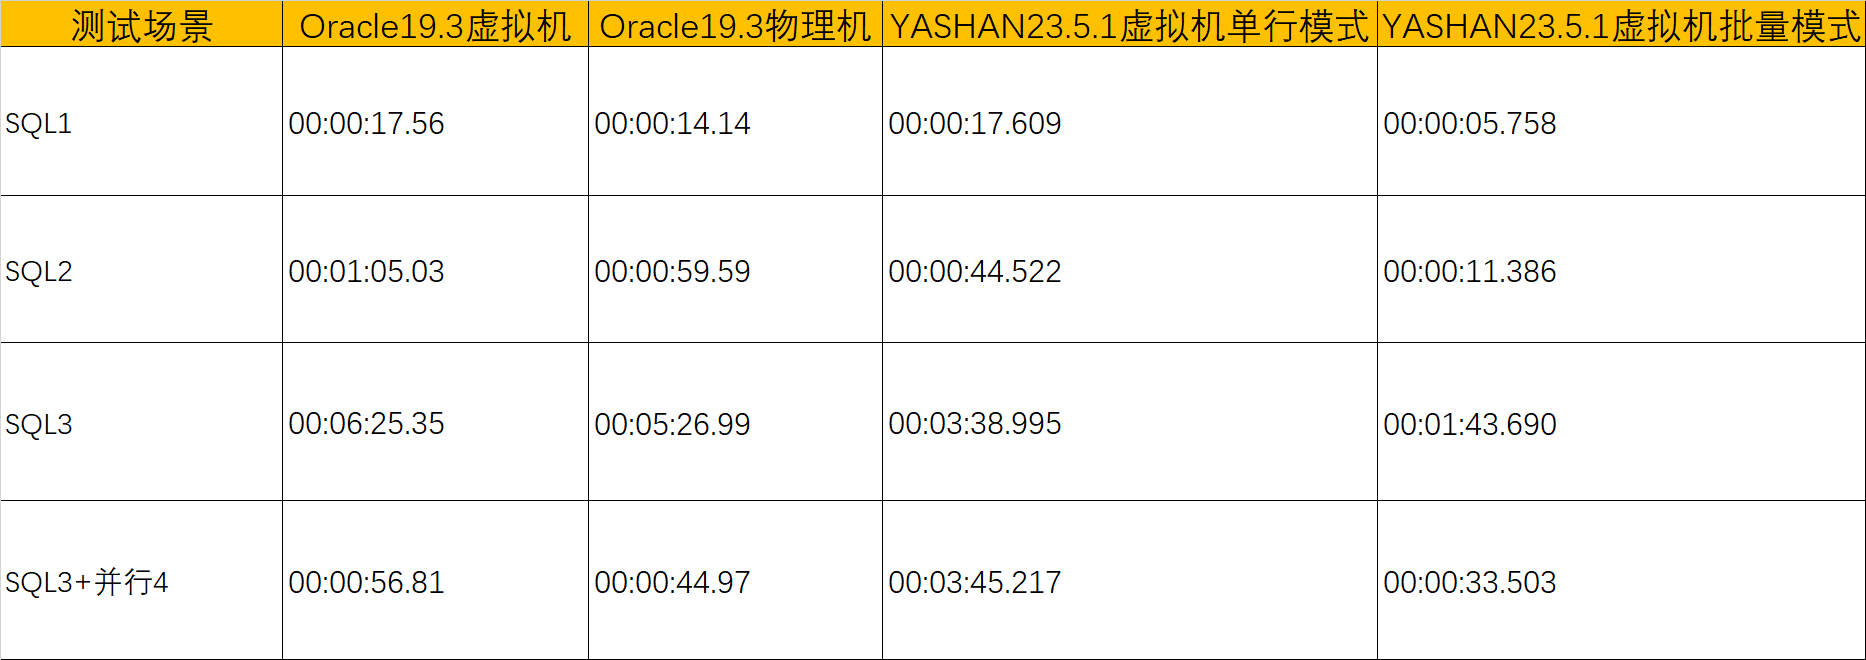
测试结果有点吓人,Oracle咋这么挫,应该是遇到了Oracle19c PGA memory operation BUG了
针对本次测试场景,Oracle19c是慢在单个SESSION PGA内存使用限制上了,本次测试PGA=16G,_pga_max_size默认2G,_smm_max_size默认1G),Oracle要想设置较大work area size,需要设置较大的pga_aggregate_target,调整隐藏参数_pga_max_size,设置完之后会自动设置_smm_max_size,我设置pga_aggregate_target=32G,_pga_max_size=16G,_smm_max_size被自动设置为了6.399G,但是这样设置之后有些SQL反而更慢, 一直在等PGA memory operation,实锤19c是遇到BUG了,要打补丁。
后面用Oracle26ai重新进行了测试,4条SQL耗时如下:
_pga_max_size=2G,_smm_max_size自动设置为1G

00:00:17.63
00:00:26.82
00:02:07.79
00:00:34.08

_pga_max_size=4G,_smm_max_size自动设置为2G

00:00:16.11
00:00:24.30
00:02:04.30
00:00:25.67

_pga_max_size=8G,_smm_max_size自动设置为4G

00:00:13.95
00:00:20.25
00:01:55.14
00:00:26.76

_pga_max_size=16G,_smm_max_size自动设置为6.399G

00:00:13.48
00:00:20.44
00:01:48.90
00:00:25.60
我就不更正测试结果的表格了,各位看官老爷知道就行了
崖山VM_BUFFER_SIZE=8G,MEX_POOL_SIZE=8G,崖山不需要像Oracle那样修改隐含参数,没对单个会话使用私有内存做限制
最后给崖山提个小建议,对SQL开启并行能否别搞这么复杂 parallel(a,4) parallel(b,4) batch_mode(2),直接parallel(4)
最近有很多小伙伴问我,为什么我最近几个月一直在测试崖山?那是因为:
1.崖山有RAC,能够满足核心系统高可用要求(核心系统要么分布式,要么RAC,不可能用主备)
2.崖山基础算子性能强,配合使用批量模式很多场景性能比Oracle还强
3.崖山没有PG系顽疾:表膨胀&索引膨胀
4.崖山事务行为和Oracle一致(PG系数据库事务行为和Oracle有些差异)
5.体系结构高度相似Oracle,学习成本低
6.本人搞性能优化出身,测试完崖山性能,再对比其他国产数据库直摇头
7.崖山不是在PG,MySQL上做二次研发,PG&MySQL上限已被锁死
对于一款真正用心在做研发的国产数据库,我们做的各种测试也是帮崖山能更快的打磨好各种细节,希望良币驱逐劣币