之前 Cesium 中一直围绕着园区进行开发,现在增加地图的部分,后面还会增加公共组件、统计图等等操作。
在智慧园区、区域管控 等三维GIS场景中,热力图 和四色图是两大最常用的可视化展示方案。
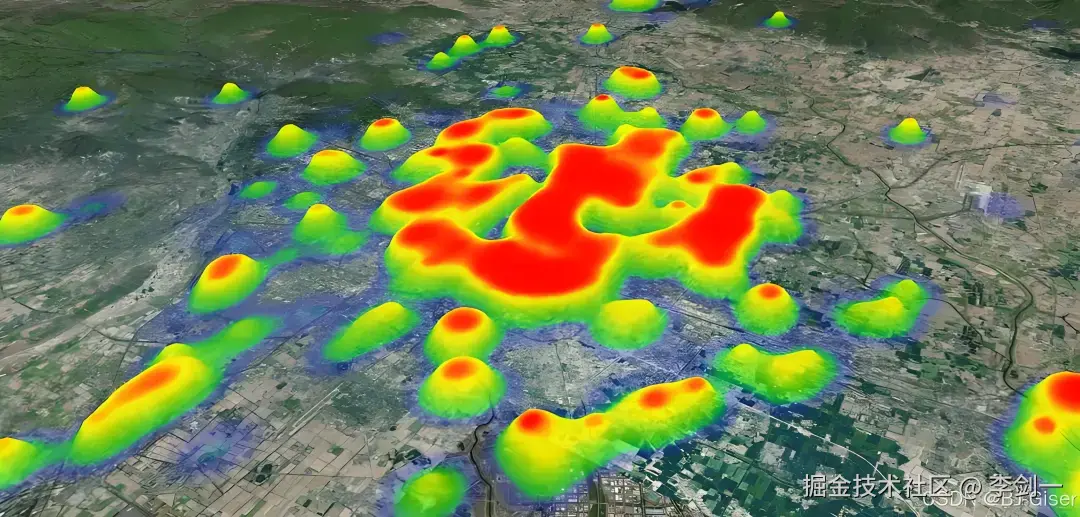
热力图直观展示密度、热度、强度分布 ,四色图清晰区分行政区域、功能分区、风险等级,两者搭配能让三维可视化效果和实用性直接拉满!
热力图
使用 Cesium 纯原生实现,无第三方依赖。
采用多级渐变色的效果,径向渐变过渡显得更加自然。
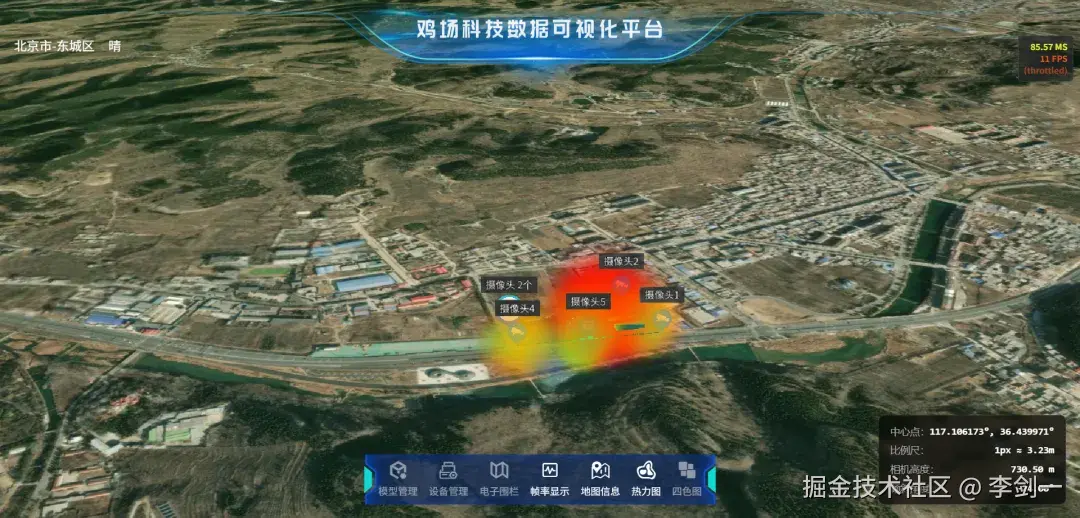
同时支持显示/隐藏切换,内存自动释放。
完整代码
javascript
const createHeatMap = () => {
    if (heatMapRef.value) {
        cesiumViewer.value.scene.primitives.remove(heatMapRef.value);
        heatMapRef.value = null;
    }

    // 热力图数据点(经纬度+权重值)
    const cameraList = [
        { longitude: 117.105914, latitude: 36.437846, height: 15 },
        { longitude: 117.105842, latitude: 36.437532, height: 14 },
        // 此处可替换为你的业务数据...
    ];

    // 创建Billboard集合
    const billboardCollection = new Cesium.BillboardCollection({
        scene: cesiumViewer.value.scene
    });

    // 计算最大权重,用于归一化
    const maxHeight = Math.max(...cameraList.map(c => c.height));

    // 热力图8级渐变色配置
    const heatColors = {
        veryLow: new Cesium.Color(0.0, 0.0, 1.0, 0.2),    // 深蓝
        low: new Cesium.Color(0.0, 0.5, 1.0, 0.3),        // 蓝色
        mediumLow: new Cesium.Color(0.0, 1.0, 1.0, 0.4),  // 青色
        medium: new Cesium.Color(0.5, 1.0, 0.5, 0.5),     // 黄绿色
        mediumHigh: new Cesium.Color(1.0, 1.0, 0.0, 0.6), // 黄色
        high: new Cesium.Color(1.0, 0.7, 0.0, 0.7),       // 橙色
        veryHigh: new Cesium.Color(1.0, 0.3, 0.0, 0.8),   // 橙红
        extreme: new Cesium.Color(1.0, 0.0, 0.0, 0.9)     // 红色
    };

    // 遍历数据生成热力点
    cameraList.forEach(camera => {
        const normalizedHeight = camera.height / maxHeight;
        let color, radius, alpha;

        // 8级密度分级,自动匹配颜色、半径、透明度
        if (normalizedHeight < 0.125) {
            color = heatColors.veryLow; radius = 40; alpha = 0.25;
        } else if (normalizedHeight < 0.25) {
            const intensity = (normalizedHeight - 0.125) / 0.125;
            color = Cesium.Color.fromBytes(0, Math.round(128 * intensity), 255, Math.round(255 * 0.3));
            radius = 40 + intensity * 15; alpha = 0.3;
        } else if (normalizedHeight < 0.375) {
            const intensity = (normalizedHeight - 0.25) / 0.125;
            color = Cesium.Color.fromBytes(0, 128 + Math.round(127 * intensity), 255 - Math.round(127 * intensity), Math.round(255 * 0.35));
            radius = 55 + intensity * 15; alpha = 0.35;
        } else if (normalizedHeight < 0.5) {
            const intensity = (normalizedHeight - 0.375) / 0.125;
            color = Cesium.Color.fromBytes(Math.round(128 * intensity), 255, 128 - Math.round(128 * intensity), Math.round(255 * 0.4));
            radius = 70 + intensity * 20; alpha = 0.4;
        } else if (normalizedHeight < 0.625) {
            const intensity = (normalizedHeight - 0.5) / 0.125;
            color = Cesium.Color.fromBytes(128 + Math.round(127 * intensity), 255, 0, Math.round(255 * 0.5));
            radius = 90 + intensity * 25; alpha = 0.5;
        } else if (normalizedHeight < 0.75) {
            const intensity = (normalizedHeight - 0.625) / 0.125;
            color = Cesium.Color.fromBytes(255, 255 - Math.round(178 * intensity), 0, Math.round(255 * 0.6));
            radius = 115 + intensity * 30; alpha = 0.6;
        } else if (normalizedHeight < 0.875) {
            const intensity = (normalizedHeight - 0.75) / 0.125;
            color = Cesium.Color.fromBytes(255, 77 - Math.round(77 * intensity), 0, Math.round(255 * 0.7));
            radius = 145 + intensity * 35; alpha = 0.7;
        } else {
            const intensity = (normalizedHeight - 0.875) / 0.125;
            color = Cesium.Color.fromBytes(255, 0, 0, Math.round(255 * 0.8));
            radius = 180 + intensity * 40; alpha = 0.8;
        }

        // 多层圆形叠加,实现渐变光晕效果
        const numCircles = 3;
        for (let i = 0; i < numCircles; i++) {
            const circleRadius = radius * (0.7 + i * 0.15);
            const circleAlpha = alpha * (0.8 - i * 0.2);

            // Canvas绘制径向渐变圆形
            const canvas = document.createElement('canvas');
            canvas.width = 256; canvas.height = 256;
            const context = canvas.getContext('2d');
            const gradient = context.createRadialGradient(128,128,0,128,128,128);

            gradient.addColorStop(0, `rgba(${Math.round(color.red * 255)}, ${Math.round(color.green * 255)}, ${Math.round(color.blue * 255)}, ${circleAlpha})`);
            gradient.addColorStop(0.7, `rgba(${Math.round(color.red * 255)}, ${Math.round(color.green * 255)}, ${Math.round(color.blue * 255)}, ${circleAlpha * 0.5})`);
            gradient.addColorStop(1, `rgba(${Math.round(color.red * 255)}, ${Math.round(color.green * 255)}, ${Math.round(color.blue * 255)}, 0)`);

            context.fillStyle = gradient;
            context.beginPath();
            context.arc(128,128,128,0,Math.PI*2);
            context.fill();

            // 添加到场景
            billboardCollection.add({
                position: Cesium.Cartesian3.fromDegrees(camera.longitude, camera.latitude, camera.height),
                image: canvas,
                width: circleRadius * 2,
                height: circleRadius * 2,
                scaleByDistance: new Cesium.NearFarScalar(100,1.0,1000,0.5),
                translucencyByDistance: new Cesium.NearFarScalar(100,1.0,500,0.3),
            });
        }
    });

    cesiumViewer.value.scene.primitives.add(billboardCollection);
    heatMapRef.value = billboardCollection;
    cesiumViewer.value.scene.requestRender();
    console.log('✅ 热力图创建成功');
};
加载GeoJson四色图实现
使用 fetch 加载标准GeoJson行政区划/面数据,数据可以从这个地址下载: datav.aliyun.com/portal/scho...
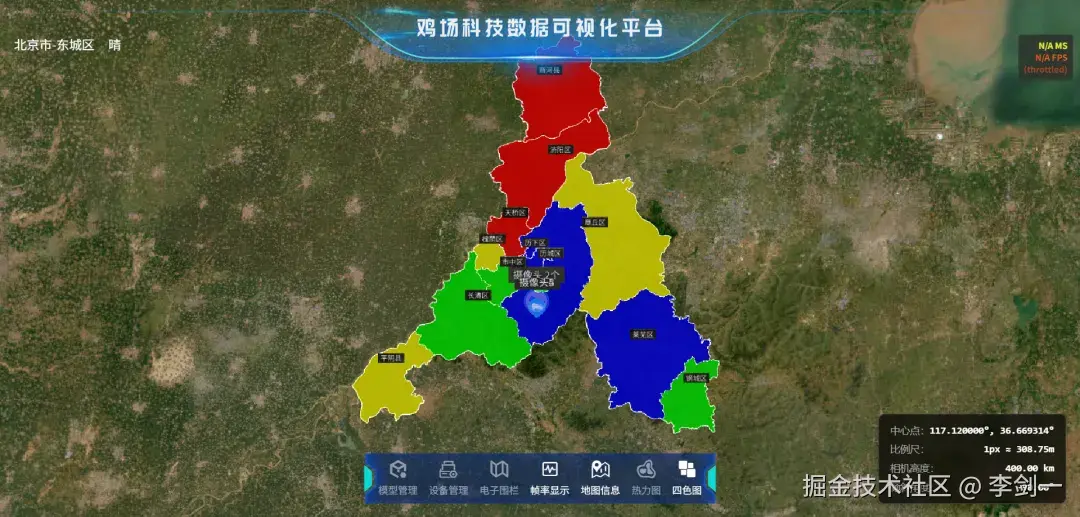
这里采用的是四色循环渲染,如果想要多种颜色也是一样的。
完整代码
javascript
const createColorMap = () => {
    // 已存在则先移除
    if (colorMapRef.value) {
        cesiumViewer.value.dataSources.remove(colorMapRef.value);
        colorMapRef.value = null;
    }

    // 加载GeoJson区域数据
    fetch('/json/济南市.geojson')
        .then(res => res.json())
        .then(geojsonData => {
            // 四色图配色
            const colorMap = [
                new Cesium.Color(0.0, 0.0, 1.0, 0.7),   // 蓝
                new Cesium.Color(0.0, 1.0, 0.0, 0.7),   // 绿
                new Cesium.Color(1.0, 1.0, 0.0, 0.7),   // 黄
                new Cesium.Color(1.0, 0.0, 0.0, 0.7),   // 红
            ];

            const dataSource = new Cesium.GeoJsonDataSource();
            dataSource.load(geojsonData, {
                stroke: Cesium.Color.WHITE,
                fill: colorMap[0],
                strokeWidth: 2,
                clampToGround: true
            }).then(ds => {
                const entities = ds.entities.values;
                let colorIndex = 0;

                entities.forEach(entity => {
                    if (entity.polygon) {
                        // 四色循环赋值
                        entity.polygon.material = colorMap[colorIndex % 4];
                        entity.polygon.outline = true;
                        entity.polygon.outlineColor = Cesium.Color.WHITE;
                        entity.polygon.outlineWidth = 2;

                        // 拉伸高度(立体效果)
                        entity.polygon.extrudedHeight = 50;
                        entity.polygon.height = 0;

                        colorIndex++;
                    }
                });

                cesiumViewer.value.dataSources.add(ds);
                colorMapRef.value = ds;

                // 自动飞掠到视图
                cesiumViewRef.value.flyToLocation({
                    longitude: 117.12,
                    latitude: 36.67,
                    height: 400000,
                    duration: 3,
                    heading: 0,
                    pitch: -90,
                });

                console.log('✅ 四色图创建成功');
            });
        });
};
总结
热力图+四色图是Cesium三维GIS可视化中最常用、最实用的两大功能。
这里提供的代码均为原生实现、生产环境可用,无需引入任何第三方库,直接复制即可运行。
热力图效果需要大量的数据才能看出效果,如果是人造数据我建议通过AI生成查看效果。
四色图这里也可以增加颜色显示,看起来更丰富。