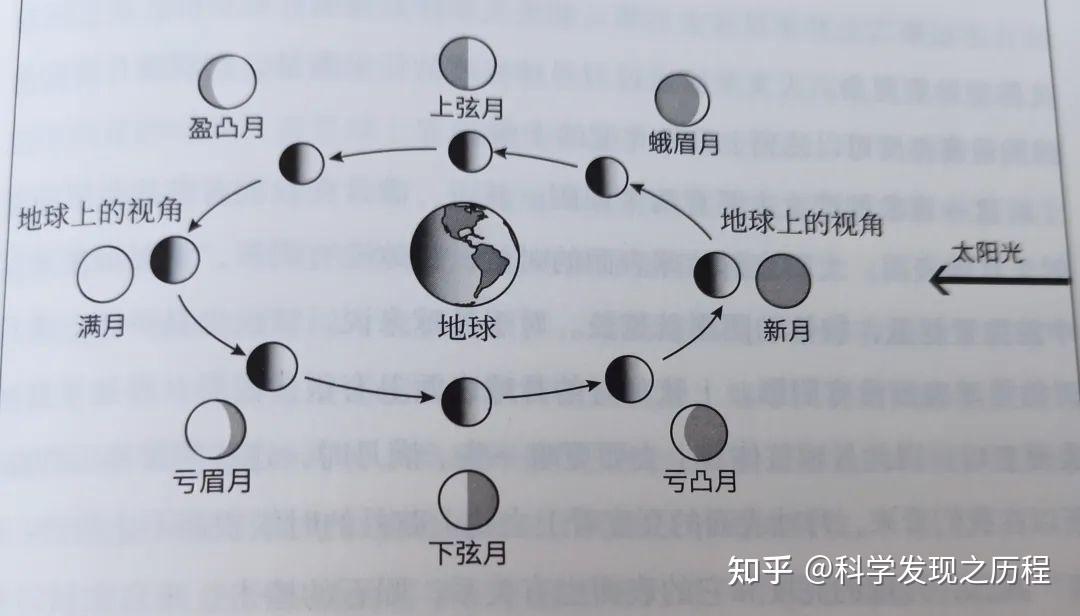
本文介绍了一个使用Python Matplotlib库创建的月相变化动画程序。该程序通过绘制地球、月球轨道和太阳光照,模拟展示了月球绕地球公转时不同位置呈现的月相变化(包括新月、上弦月、满月等下弦月等)。动画采用红色月球配合白色受光面的视觉效果,准确表现了月相变化的原理。程序设置了120帧动画循环,每帧计算月球轨道角度和相应月相名称,最终输出为GIF格式的月相变化演示动画。该实现结合了天文学知识和数据可视化技术,为理解月相变化提供了直观的教学工具。
python
import numpy as np
import matplotlib.pyplot as plt
from matplotlib.patches import Circle
from matplotlib.animation import FuncAnimation, PillowWriter
from matplotlib import rcParams

# 中文字体
rcParams["font.sans-serif"] = ["SimHei", "Microsoft YaHei", "Arial Unicode MS"]
rcParams["axes.unicode_minus"] = False

# ----------------------------
# 参数设置
# ----------------------------
fig, ax = plt.subplots(figsize=(8, 8))
ax.set_aspect("equal")
ax.set_xlim(-4.2, 4.8)
ax.set_ylim(-4.2, 4.2)
ax.axis("off")

orbit_r = 2.8
earth_r = 0.5
moon_r = 0.28
sun_x, sun_y = 4.2, 3.0
frames = 120

# ----------------------------
# 绘制"红色月球 + 白色投影"
# ----------------------------
def draw_moon_red_white(ax, x, y, r, phase_deg):
    # 红色底盘
    ax.add_patch(Circle((x, y), r, color="#CC0000", ec="black", lw=1.2))

    # 新月
    if phase_deg == 0:
        return

    # 满月:整颗变白
    if phase_deg == 180:
        ax.add_patch(Circle((x, y), r, color="white", ec="black", lw=1.2))
        return

    # 白色"投影/受光面"
    phi = np.deg2rad(phase_deg)

    if phase_deg < 180:
        # 盈月:右侧白
        ax.add_patch(Circle((x, y), r, color="white", ec="none"))
        shift = r * np.cos(phi)
        ax.add_patch(Circle((x - shift, y), r, color="#CC0000", ec="none"))
    else:
        # 亏月:左侧白
        ax.add_patch(Circle((x, y), r, color="white", ec="none"))
        shift = r * np.cos(np.pi - phi)
        ax.add_patch(Circle((x + shift, y), r, color="#CC0000", ec="none"))

    # 外轮廓
    ax.add_patch(Circle((x, y), r, fill=False, ec="black", lw=1.2))

# ----------------------------
# 月相文字
# ----------------------------
def get_phase_name(angle_deg):
    if angle_deg < 22.5 or angle_deg >= 337.5:
        return "新月"
    elif angle_deg < 67.5:
        return "蛾眉月"
    elif angle_deg < 112.5:
        return "上弦月"
    elif angle_deg < 157.5:
        return "盈凸月"
    elif angle_deg < 202.5:
        return "满月"
    elif angle_deg < 247.5:
        return "亏凸月"
    elif angle_deg < 292.5:
        return "下弦月"
    else:
        return "亏眉月"

# ----------------------------
# 动画更新函数
# ----------------------------
def update(frame):
    ax.clear()
    ax.set_aspect("equal")
    ax.set_xlim(-4.2, 4.8)
    ax.set_ylim(-4.2, 4.2)
    ax.axis("off")
    ax.set_facecolor("white")

    # 当前月球轨道角度
    angle_deg = frame * 360 / frames
    theta = np.deg2rad(angle_deg)

    # 月球位置
    moon_x = orbit_r * np.cos(theta)
    moon_y = orbit_r * np.sin(theta)

    # 月相角:0°新月,180°满月
    phase_deg = angle_deg if angle_deg <= 180 else 360 - angle_deg

    # 太阳光
    ax.annotate(
        "",
        xy=(-3.0, 3.0),
        xytext=(4.0, 3.0),
        arrowprops=dict(arrowstyle="->", lw=2.5, color="orange")
    )
    ax.text(4.05, 3.15, "太阳光", color="orange", fontsize=12, ha="right")

    # 太阳
    sun = Circle((sun_x, sun_y), 0.35, color="gold", ec="black", lw=1.2)
    ax.add_patch(sun)
    ax.text(sun_x, sun_y, "太阳", ha="center", va="center", fontsize=11, weight="bold")

    # 地球
    earth = Circle((0, 0), earth_r, color="#2E86DE", ec="black", lw=1.5)
    ax.add_patch(earth)
    ax.text(0, 0, "地球", ha="center", va="center", color="white", fontsize=13, weight="bold")

    # 轨道
    orbit = Circle((0, 0), orbit_r, fill=False, ls="--", ec="gray", lw=1.2)
    ax.add_patch(orbit)

    # 地月连线
    ax.plot([0, moon_x], [0, moon_y], color="gray", lw=1, ls=":")

    # 月球
    draw_moon_red_white(ax, moon_x, moon_y, moon_r, phase_deg)
    ax.text(moon_x, moon_y - 0.45, "月球", ha="center", va="top", fontsize=11)

    # 文字说明
    phase_text = get_phase_name(angle_deg)
    ax.text(-4.0, 3.6, f"月相动画:{phase_text}", fontsize=15, weight="bold")
    ax.text(2.1, -3.7, f"月球轨道角度:{int(angle_deg)}°", fontsize=11)

    # 轨道方向箭头
    ax.annotate(
        "",
        xy=(orbit_r * np.cos(np.deg2rad(70)), orbit_r * np.sin(np.deg2rad(70))),
        xytext=(orbit_r * np.cos(np.deg2rad(30)), orbit_r * np.sin(np.deg2rad(30))),
        arrowprops=dict(arrowstyle="->", lw=1.8, color="black")
    )

# ----------------------------
# 生成 GIF
# ----------------------------
anim = FuncAnimation(fig, update, frames=frames, interval=80)
gif_name = "moon_phase_red_white.gif"
anim.save(gif_name, writer=PillowWriter(fps=12))
print(f"已生成动画文件:{gif_name}")
plt.close(fig)