一、实现效果
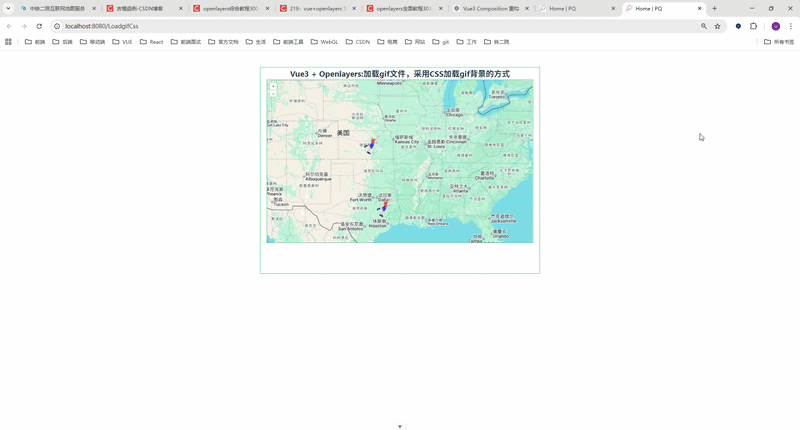
最终效果如下:
- 地图加载完成后
- 指定经纬度位置出现 动态 GIF 标记
- 标记通过 CSS 控制,无需额外动画逻辑
二、前言
在实际 GIS 项目开发中,我们经常会遇到这样一种需求:
👉 在地图上展示"动态标记"(比如闪烁点、雷达扫描、预警点等)
传统做法一般是:
- 使用静态图片(PNG / SVG)
- 或使用 Canvas 动画
但如果我们只是想实现简单的动画效果,其实可以用一种更轻量的方式:
✅ 通过 CSS 加载 GIF 作为标记,实现动画效果
本文将基于 Vue3 + OpenLayers,实现:
✔ 在地图上加载多个点
✔ 每个点使用 GIF 动画展示
✔ 不使用复杂绘制,仅用 Overlay + CSS
三、核心思路
实现步骤其实很简单:
1️⃣ 使用 GeoJSON 定义点位
javascript
const geojsonData = {
    type: "FeatureCollection",
    features: [{
        geometry: {
            type: "Point",
            coordinates: [-95.4, 31.8],
        },
    }],
}
2️⃣ 提取坐标
javascript
const getCoordinatesByGeojson = (geojsonData) => {
    return geojsonData.features.map(
        (feature) => feature.geometry.coordinates
    )
}
3️⃣ 使用 Overlay 绑定 DOM
OpenLayers 提供了 Overlay:
👉 可以把 HTML 元素"挂"到地图上
javascript
const marker = new Overlay({
    position: coord,
    element: gifspan,
})
4️⃣ 使用 CSS 加载 GIF
关键点来了 👇
javascript
span {
    background: url("/image/gif.gif") no-repeat;
}
👉 GIF 会自动播放动画,不需要 JS 控制
四、完整代码实现
javascript
<!--
 * @Author: 彭麒
 * @Date: 2026/4/10
 * @Email: 1062470959@qq.com
 * @Description: 此源码版权归吉檀迦俐所有,可供学习和借鉴或商用。
 -->
<template>
  <div class="container">
    <div class="w-full flex justify-center flex-wrap">
      <div class="font-bold text-[24px]">
        Vue3 + Openlayers:加载gif文件,采用CSS加载gif背景的方式
      </div>
    </div>
    <div id="vue-openlayers"></div>
  </div>
</template>

<script setup>
import { onMounted } from 'vue'
import 'ol/ol.css'
import { Map, View, Overlay } from 'ol'
import TileLayer from 'ol/layer/Tile'
import XYZ from 'ol/source/XYZ'
import { fromLonLat, useGeographic } from 'ol/proj'
let map = null
const geojsonData = {
  type: "FeatureCollection",
  features: [
    {
      type: "Feature",
      properties: { title: "point1" },
      geometry: {
        type: "Point",
        coordinates: [-95.4, 31.8],
      },
    },
    {
      type: "Feature",
      properties: { title: "point2" },
      geometry: {
        type: "Point",
        coordinates: [-97.1, 38.7],
      },
    },
  ],
}

// ====== 方法 ======
const getCoordinatesByGeojson = (geojsonData) => {
  return geojsonData.features.map(
      (feature) => feature.geometry.coordinates
  )
}

const showGif = () => {
  const coordinates = getCoordinatesByGeojson(geojsonData)

  coordinates.forEach((coord) => {
    const gifspan = document.createElement('span')
    document.documentElement.appendChild(gifspan)

    const marker = new Overlay({
      position: coord,
      element: gifspan,
      positioning: 'center-center',
    })

    map.addOverlay(marker)
  })
}

const initMap = () => {
  const googleLayer = new TileLayer({
    source: new XYZ({
      url: 'https://www.google.com/maps/vt?lyrs=m&gl=en&x={x}&y={y}&z={z}',
      crossOrigin: 'anonymous',
    }),
  })

  map = new Map({
    target: 'vue-openlayers',
    layers: [googleLayer],
    view: new View({
      projection: 'EPSG:3857',
      center: fromLonLat([-97.1, 38.7]),
      zoom: 4,
    }),
  })
}

// ====== 生命周期 ======
onMounted(() => {
  initMap()
  showGif()
  useGeographic() // 必须
})
</script>

<style>
.container {
  width: 840px;
  height: 620px;
  margin: 50px auto;
  border: 1px solid #42B983;
}

#vue-openlayers {
  width: 800px;
  height: 490px;
  margin: 0 auto;
  border: 1px solid #42B983;
  position: relative;
}

.container span {
  display: inline-block;
  width: 80px;
  height: 80px;
  border-radius: 50%;
  background: url("/image/gif.gif") no-repeat;
  background-size: 80px 80px;
}
</style>
五、关键点解析
⚠️ 1. 为什么用 Overlay?
- VectorLayer → 更适合大量数据
- Overlay → 更适合 DOM / 动画 / 交互
👉 本场景用 Overlay 更简单
⚠️ 2. 为什么用 CSS 而不是 JS 动画?
优点:
- ✅ 实现简单
- ✅ 不占用 JS 计算
- ✅ GIF 自动循环
⚠️ 3. 坐标问题(重点坑)
javascript
useGeographic()👉 必须调用,否则:
- 坐标系不一致
- 点位会偏移
⚠️ 4. DOM 挂载位置优化
❌ 错误写法:
javascript
document.documentElement.appendChild(el)✅ 正确写法:
javascript
container.appendChild(el)👉 避免污染全局 DOM
六、适用场景
这种方式非常适合:
- 🚨 预警点闪烁
- 📍 定位动画
- 📡 雷达扫描效果
- 🚑 实时监控点
七、优化建议
如果你要做更复杂的项目,可以升级👇:
🚀 1. 使用 VectorLayer(性能更高)
适合上千点
🚀 2. 使用 Sprite 动画(替代 GIF)
更流畅、可控
🚀 3. 使用 Canvas 动画
实现波纹、扩散效果
八、总结
本文核心就一句话:
✅ 利用 Overlay + CSS GIF,实现地图动态标记,是一种简单高效的方案
相比复杂动画:
- 实现成本低
- 可维护性高
- 非常适合业务项目