前言:c# winform UI控件系列,做不到最好用,但愿是更好用!
一、效果图
二、使用说明
BarPlotEx 柱状图控件
控件简介
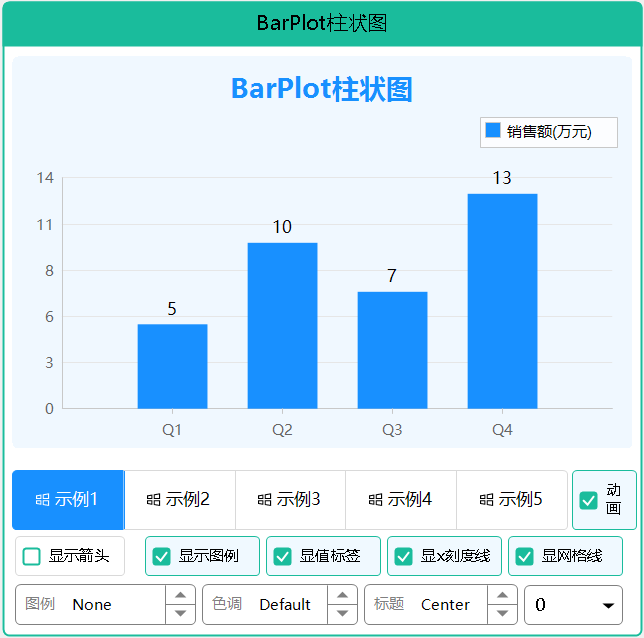
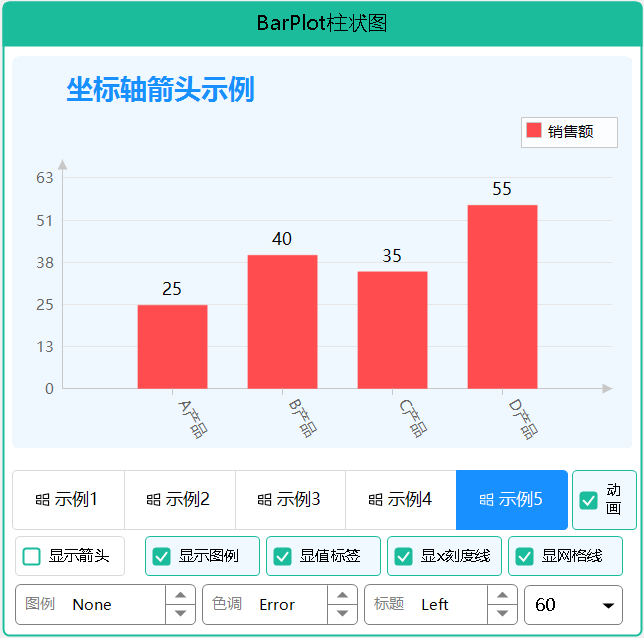
BarPlotEx 是一个功能强大的柱状图控件,参考 ScottPlot 设计,支持亮暗主题切换、色彩模式、值标签显示、对比柱状图、标题设置、坐标轴箭头、网格线样式和图例位置控制。
主要特性
- 简单易用:参考 ScottPlot API,几行代码即可创建专业图表
- 亮暗主题:自动适配亮色/暗色主题,也可独立设置颜色
- 色彩模式:支持 Primary/Success/Warning/Error 等功能色
- 值标签显示:支持在柱子顶部显示数值标签
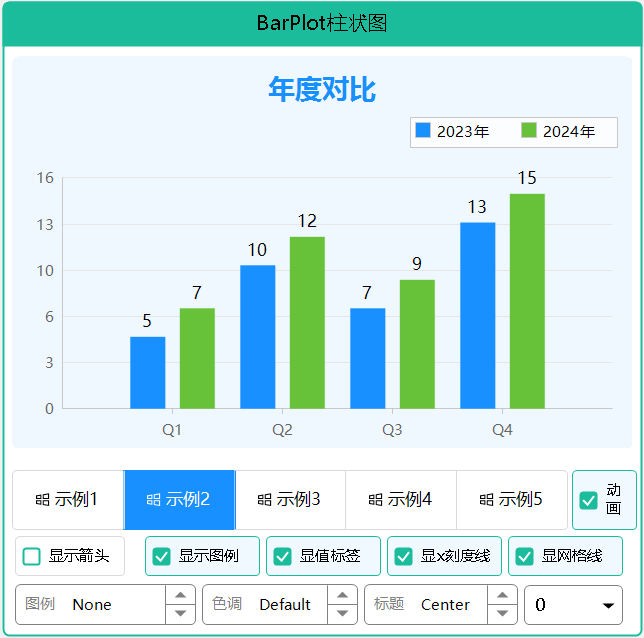
- 对比柱状图:支持多组数据并排对比显示
- 边距控制:支持像素边距和百分比边距(参考 ScottPlot Axes.Margins)
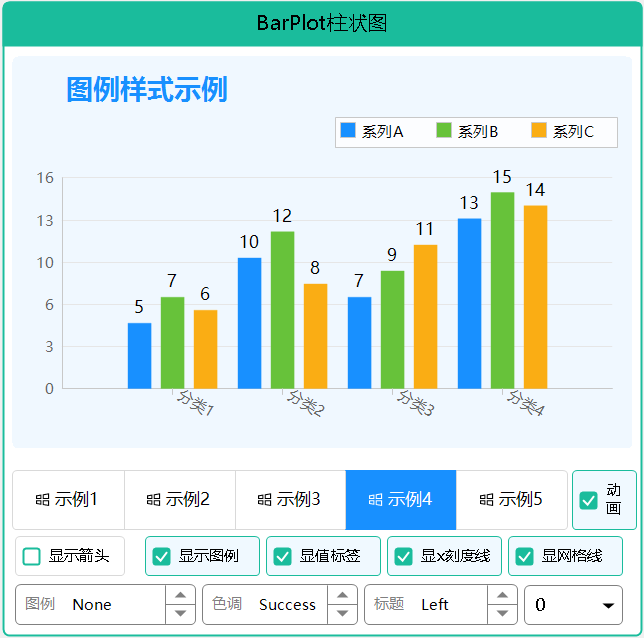
- 图例支持:可显示多系列数据的图例说明,支持背景、边框和位置控制
- 标题支持:支持设置图表标题,可控制位置、大小、颜色和粗细
- 坐标轴箭头:支持显示X轴和Y轴箭头
- 网格线样式:支持水平/垂直网格线,可调整宽度、样式和颜色
- 背景图支持:支持设置背景图片和背景色
基本使用
简单柱状图
// 创建柱状图控件
var barPlot = new BarPlotEx
{
    Dock = DockStyle.Fill,
    ColorType = ColorType.Primary
};

// 添加数据
double[] values = { 5, 10, 7, 13 };
barPlot.AddBars(values);

// 设置底部边距为0,使柱子贴底
barPlot.MarginBottomPercent = 0;

// 刷新显示
barPlot.RefreshPlot();

this.Controls.Add(barPlot);

### 带标签的柱状图(数组方式)

```csharp
double[] values = { 5, 10, 7, 13 };
string[] labels = { "Q1", "Q2", "Q3", "Q4" };

// 一次性传入数值和标签
var series = barPlot.AddBars(values, labels, "销售额");

barPlot.SetMarginPercent(bottom: 0, top: 0.1);
barPlot.RefreshPlot();
带X轴标签和值标签的柱状图(完整数组方式)
double[] values = { 5, 10, 7, 13 };
string[] xLabels = { "Q1", "Q2", "Q3", "Q4" };
string[] valueLabels = { "5万", "10万", "7万", "13万" };

// 一次性传入数值、X轴标签和值标签
var series = barPlot.AddBars(values, xLabels, valueLabels, "销售额");

// 显示值标签
barPlot.ShowValueLabels = true;

barPlot.SetMarginPercent(bottom: 0, top: 0.15);
barPlot.RefreshPlot();
带X轴标签,自动显示数值标签
double[] values = { 25, 40, 35, 55 };
string[] xLabels = { "A产品", "B产品", "C产品", "D产品" };

// 自动将数值转为字符串作为值标签显示
var series = barPlot.AddBars(values, xLabels, "销售额", showValueLabels: true);

// 需要设置 ShowValueLabels = true 才会显示
barPlot.ShowValueLabels = true;

barPlot.SetMarginPercent(bottom: 0, top: 0.15);
barPlot.RefreshPlot();
带值标签的柱状图
double[] values = { 5, 10, 7, 13 };
var series = barPlot.AddBars(values);

// 为每个柱子设置值标签
foreach (var item in series.Items)
{
    item.ValueLabel = item.Value.ToString();
}

// 显示值标签
barPlot.ShowValueLabels = true;

// 设置样式
series.ValueLabelStyle.Bold = true;
series.ValueLabelStyle.FontSize = 14;

// 设置边距:底部为0,顶部预留20%空间给标签
barPlot.SetMarginPercent(bottom: 0, top: 0.2);

barPlot.RefreshPlot();
对比柱状图
// 第一组数据
double[] values1 = { 5, 10, 7, 13 };
var series1 = barPlot.AddBars(values1);
series1.LegendText = "Alpha";
series1.Color = Color.FromArgb(24, 144, 255);  // 蓝色

// 第二组数据
double[] values2 = { 7, 12, 9, 15 };
var series2 = barPlot.AddBars(values2);
series2.LegendText = "Beta";
series2.Color = Color.FromArgb(103, 194, 58);  // 绿色

// 显示图例
barPlot.ShowLegend = true;
barPlot.LegendPosition = LegendPosition.Right;  // 图例显示在数据区右侧

// 设置底部边距
barPlot.MarginBottomPercent = 0;

barPlot.RefreshPlot();
带标题的柱状图
barPlot.Title = "2024年销售数据";
barPlot.TitlePosition = TitlePosition.Center;  // 标题居中
barPlot.TitleBold = true;                      // 标题加粗
barPlot.TitleFontSize = 16;                    // 标题字号
barPlot.TitleColor = Color.DodgerBlue;         // 标题颜色
barPlot.TitleMargin = 15;                      // 标题与图表间距

barPlot.RefreshPlot();
坐标轴箭头
barPlot.ShowAxisArrows = true;   // 显示坐标轴箭头
barPlot.ArrowSize = 10;          // 箭头大小

// 为Y轴标签预留空间,防止箭头与网格线太近
barPlot.SetMarginPercent(bottom: 0, top: 0.15);

barPlot.RefreshPlot();
网格线样式
// 显示网格线
barPlot.ShowGrid = true;
barPlot.ShowHorizontalGrid = true;   // 水平网格线(默认)
barPlot.ShowVerticalGrid = true;     // 垂直网格线

// 网格线样式(细线更丝滑)
barPlot.GridLineWidth = 0.5f;                    // 线宽0.5像素
barPlot.GridLineStyle = DashStyle.Solid;         // 实线(默认)
barPlot.GridColor = Color.FromArgb(220, 220, 220); // 淡灰色

barPlot.RefreshPlot();
背景设置
// 背景色
barPlot.BackColor = Color.LightBlue;

// 或背景图
barPlot.BackgroundImage = Image.FromFile("background.png");
barPlot.BackgroundImageLayout = ImageLayout.Zoom;  // None/Tile/Center/Stretch/Zoom
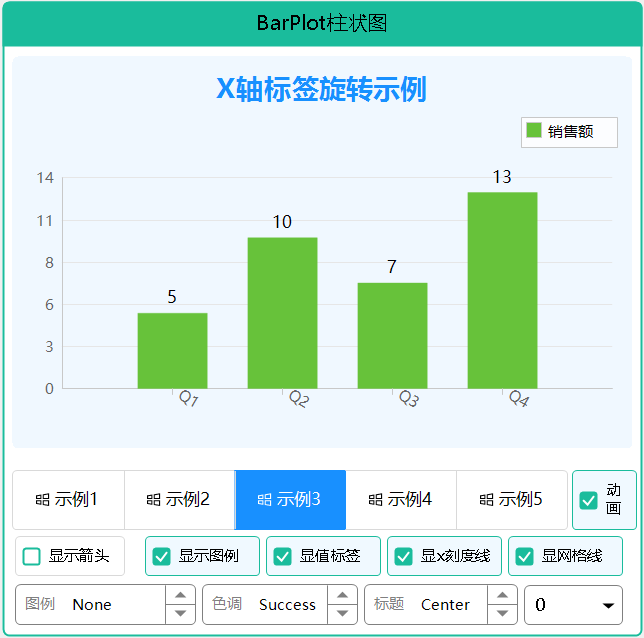
X轴标签旋转
// X轴标签旋转45度,避免重叠
barPlot.XAxisLabelAngle = 45;

// 调整标签与轴线的距离
barPlot.XAxisLabelOffset = 10;

// 显示X轴刻度线
barPlot.ShowXAxisTicks = true;
barPlot.XAxisTickLength = 6;

barPlot.RefreshPlot();
图例样式
barPlot.ShowLegend = true;
barPlot.LegendPosition = LegendPosition.TopRight;  // 图例位置

// 图例背景
barPlot.LegendShowBackground = true;
barPlot.LegendBackColor = Color.White;

// 图例边框
barPlot.LegendShowBorder = true;
barPlot.LegendBorderColor = Color.Gray;
barPlot.LegendBorderWidth = 1;

barPlot.RefreshPlot();
属性说明
数据属性
| 属性名 |
类型 |
默认值 |
说明 |
| Series |
List |
- |
数据系列集合 |
| ColorType |
ColorType |
Primary |
色彩类型(Primary/Success/Warning/Error/Info) |
显示属性
| 属性名 |
类型 |
默认值 |
说明 |
| ShowGrid |
bool |
true |
是否显示网格线 |
| ShowHorizontalGrid |
bool |
true |
是否显示水平网格线 |
| ShowVerticalGrid |
bool |
false |
是否显示垂直网格线 |
| ShowLegend |
bool |
false |
是否显示图例 |
| ShowAxis |
bool |
true |
是否显示坐标轴 |
| ShowValueLabels |
bool |
false |
是否显示值标签 |
| ShowXAxisTicks |
bool |
true |
是否显示X轴刻度线 |
| ShowAxisArrows |
bool |
false |
是否显示坐标轴箭头 |
布局属性
| 属性名 |
类型 |
默认值 |
说明 |
| BarSpacing |
double |
0.1 |
同一分类内柱子之间的间距比例(0-1) |
| CategorySpacing |
double |
0.2 |
不同分类之间的间距比例(0-1) |
| XAxisLabelAngle |
float |
0 |
X轴标签旋转角度(度) |
| XAxisLabelOffset |
float |
6 |
X轴标签与轴线的距离(像素) |
| XAxisTickLength |
float |
5 |
X轴刻度线长度(像素) |
边距属性
| 属性名 |
类型 |
默认值 |
说明 |
| MarginLeft |
float |
50 |
左侧边距(像素) |
| MarginRight |
float |
20 |
右侧边距(像素) |
| MarginTop |
float |
20 |
顶部边距(像素) |
| MarginBottom |
float |
40 |
底部边距(像素) |
| MarginBottomPercent |
double |
0 |
底部边距百分比(0-1) |
| MarginTopPercent |
double |
0 |
顶部边距百分比(0-1) |
网格线属性
| 属性名 |
类型 |
默认值 |
说明 |
| GridLineWidth |
float |
0.5 |
网格线宽度(像素,细线更丝滑) |
| GridLineStyle |
DashStyle |
Solid |
网格线样式(Solid/Dash/Dot等) |
| GridColor |
Color |
#E6E6E6 |
网格线颜色 |
标题属性
| 属性名 |
类型 |
默认值 |
说明 |
| Title |
string |
"" |
标题文本 |
| TitlePosition |
TitlePosition |
Center |
标题位置(Left/Center/Right) |
| TitleBold |
bool |
true |
标题是否加粗 |
| TitleFontSize |
float |
14 |
标题字体大小 |
| TitleColor |
Color |
Empty |
标题颜色(空则使用主题色) |
| TitleMargin |
float |
10 |
标题与图表区域的间距 |
图例属性
| 属性名 |
类型 |
默认值 |
说明 |
| LegendPosition |
LegendPosition |
TopRight |
图例位置 |
| LegendShowBackground |
bool |
true |
是否显示图例背景 |
| LegendShowBorder |
bool |
true |
是否显示图例边框 |
| LegendBackColor |
Color |
White |
图例背景色 |
| LegendBorderColor |
Color |
Empty |
图例边框色(空则使用轴线颜色) |
| LegendBorderWidth |
int |
1 |
图例边框宽度 |
| LegendWidth |
int |
100 |
图例宽度(用于Right/Left位置) |
箭头属性
| 属性名 |
类型 |
默认值 |
说明 |
| ShowAxisArrows |
bool |
false |
是否显示坐标轴箭头 |
| ArrowSize |
float |
8 |
箭头大小(像素) |
主题属性
| 属性名 |
类型 |
默认值 |
说明 |
| FollowGlobalTheme |
bool |
true |
是否跟随全局主题变化 |
动画属性
| 属性名 |
类型 |
默认值 |
说明 |
| EnableAnimation |
bool |
true |
是否启用柱状图生长动画 |
| AnimationDuration |
int |
800 |
动画时长(毫秒,范围100-5000) |
BarSeries 数据系列
属性
| 属性名 |
类型 |
默认值 |
说明 |
| Name |
string |
"" |
系列名称 |
| LegendText |
string |
"" |
图例文本 |
| Items |
List |
- |
数据项集合 |
| Color |
Color |
Empty |
系列颜色(为空则使用主题色) |
| BorderColor |
Color |
Empty |
边框颜色 |
| BorderWidth |
int |
1 |
边框宽度 |
| BarWidth |
double |
0.7 |
柱子宽度比例(0-1) |
| ValueLabelStyle |
ValueLabelStyle |
- |
值标签样式 |
方法
| 方法名 |
说明 |
| Add(double value, string label) |
添加数据项 |
| FromValues(double\[\] values) |
从数组创建系列 |
BarItem 数据项
| 属性名 |
类型 |
默认值 |
说明 |
| Value |
double |
0 |
数据值 |
| Label |
string |
"" |
X轴标签 |
| ValueLabel |
string |
"" |
值标签(显示在柱子上方) |
| Color |
Color |
Empty |
自定义颜色 |
| LegendText |
string |
"" |
图例文本 |
ValueLabelStyle 值标签样式
| 属性名 |
类型 |
默认值 |
说明 |
| Visible |
bool |
false |
是否显示 |
| FontSize |
float |
10 |
字体大小 |
| Bold |
bool |
false |
是否粗体 |
| ForeColor |
Color |
Empty |
字体颜色 |
| Offset |
int |
4 |
距离柱子顶部的偏移 |
动画效果
BarPlotEx 支持柔和的生长动画效果,让柱状图从底部向上生长显示。
启用/禁用动画
// 启用动画(默认)
barPlot.EnableAnimation = true;

// 禁用动画
barPlot.EnableAnimation = false;
调整动画时长
// 设置动画时长为 1.2 秒(范围 100-5000 毫秒)
barPlot.AnimationDuration = 1200;
动画效果说明
- 生长动画:柱子从底部向上生长,使用 EaseOutCubic 缓动函数,开始快结束慢,效果柔和自然
- 值标签淡入:值标签在动画进度达到 70% 时开始淡入显示,带有透明度渐变效果
- 自动触发 :调用
AddBars() 添加数据时自动触发动画
- RefreshPlot 重播 :调用
RefreshPlot() 刷新图表时会重新播放动画(需启用动画)
- 手动重播 :调用
ReplayAnimation() 可随时重新播放动画
- 设计模式:在设计模式下自动禁用动画,避免设计器闪烁
重新播放动画
// 方式1:调用 RefreshPlot(会重新计算范围并重播动画)
barPlot.RefreshPlot();

// 方式2:只重新播放动画(不重新计算数据范围)
barPlot.ReplayAnimation();
公共方法
| 方法名 |
说明 |
| AddBars(double\[\] values, string? name) |
从数值数组添加柱状图(自动播放动画) |
| AddBars(double\[\] values, string\[\] labels, string? name) |
从数值数组和X轴标签数组添加柱状图(自动播放动画) |
| AddBars(double\[\] values, string\[\] labels, string? name, bool showValueLabels) |
从数值数组和X轴标签数组添加柱状图,自动显示数值作为值标签(自动播放动画) |
| AddBars(double\[\] values, string\[\] labels, string\[\] valueLabels, string? name) |
从数值数组、X轴标签数组和值标签数组添加柱状图(自动播放动画) |
| AddSeries(string name) |
添加空数据系列(自动播放动画) |
| Clear() |
清空所有数据 |
| RefreshPlot() |
刷新图表(如果启用了动画会自动重新播放) |
| ReplayAnimation() |
重新播放柱状图生长动画 |
| SetMargins(left, right, top, bottom) |
设置像素边距 |
| SetMarginPercent(bottom, top) |
设置百分比边距 |
枚举类型
LegendPosition(图例位置)
| 值 |
说明 |
| TopLeft |
左上角(控件边缘) |
| TopRight |
右上角(控件边缘) |
| BottomLeft |
左下角(控件边缘) |
| BottomRight |
右下角(控件边缘) |
| Right |
数据区域右侧 |
| Left |
数据区域左侧 |
TitlePosition(标题位置)
| 值 |
说明 |
| Left |
左对齐 |
| Center |
居中(默认) |
| Right |
右对齐 |
ColorType(色彩类型)
| 值 |
说明 |
| Primary |
蓝色 |
| Success |
绿色 |
| Warning |
橙色 |
| Error |
红色 |
| Info |
深蓝色 |
主题适配
控件自动支持亮暗主题切换:
// 亮色主题(默认)
- 背景色: 白色
- 前景色: #333333
- 网格线: #E6E6E6
- 坐标轴: #C8C8C8

// 暗色主题
- 背景色: #1E1E1E
- 前景色: #FFFFFF
- 网格线: #3C3C3C
- 坐标轴: #646464
色彩模式
| ColorType |
亮色模式 |
暗色模式 |
| Primary |
蓝色 |
蓝色 |
| Success |
绿色 |
绿色 |
| Warning |
橙色 |
橙色 |
| Error |
红色 |
红色 |
| Info |
深蓝 |
深蓝 |
完整实例
示例1:基础柱状图
public void Demo1_BasicBarChart()
{
    var barPlot = new BarPlotEx
    {
        Dock = DockStyle.Fill,
        Title = "基础柱状图示例",
        TitlePosition = TitlePosition.Center,
        TitleFontSize = 16,
        ColorType = ColorType.Primary
    };

    // 添加数据
    double[] values = { 25, 40, 35, 55 };
    var series = barPlot.AddBars(values, "销售额");

    // 设置X轴标签
    series.Items[0].Label = "Q1";
    series.Items[1].Label = "Q2";
    series.Items[2].Label = "Q3";
    series.Items[3].Label = "Q4";

    // 设置边距使柱子贴底
    barPlot.SetMarginPercent(bottom: 0, top: 0.1);

    barPlot.RefreshPlot();
    this.Controls.Add(barPlot);
}
示例2:多系列对比
public void Demo2_MultiSeries()
{
    var barPlot = new BarPlotEx
    {
        Dock = DockStyle.Fill,
        Title = "季度销售对比",
        ShowLegend = true,
        LegendPosition = LegendPosition.Right,
        ShowValueLabels = true
    };

    // 2023年数据
    var series2023 = barPlot.AddBars(new double[] { 100, 120, 140, 160 }, "2023年");
    series2023.Color = Color.FromArgb(24, 144, 255);

    // 2024年数据
    var series2024 = barPlot.AddBars(new double[] { 110, 135, 155, 180 }, "2024年");
    series2024.Color = Color.FromArgb(103, 194, 58);

    // 设置标签
    string[] labels = { "Q1", "Q2", "Q3", "Q4" };
    for (int i = 0; i < 4; i++)
    {
        series2023.Items[i].Label = labels[i];
        series2024.Items[i].ValueLabel = series2024.Items[i].Value.ToString();
    }

    // 图例样式
    barPlot.LegendShowBackground = true;
    barPlot.LegendBackColor = Color.White;
    barPlot.LegendShowBorder = true;

    // 网格线
    barPlot.ShowHorizontalGrid = true;
    barPlot.ShowVerticalGrid = true;
    barPlot.GridLineWidth = 0.5f;

    barPlot.SetMarginPercent(bottom: 0, top: 0.15);
    barPlot.RefreshPlot();
    this.Controls.Add(barPlot);
}
示例3:带坐标轴箭头和X轴旋转
public void Demo3_ArrowsAndRotatedLabels()
{
    var barPlot = new BarPlotEx
    {
        Dock = DockStyle.Fill,
        Title = "产品销售数据",
        TitleBold = true,
        TitleColor = Color.DodgerBlue
    };

    // 添加数据
    double[] values = { 120, 200, 150, 80, 250 };
    var series = barPlot.AddBars(values, "销量");

    // 长标签需要旋转
    string[] products = { "笔记本电脑", "智能手机", "平板电脑", "智能手表", "无线耳机" };
    for (int i = 0; i < products.Length; i++)
    {
        series.Items[i].Label = products[i];
    }

    // X轴标签旋转45度,避免重叠
    barPlot.XAxisLabelAngle = 45;
    barPlot.XAxisLabelOffset = 10;
    barPlot.ShowXAxisTicks = true;
    barPlot.XAxisTickLength = 6;

    // 坐标轴箭头
    barPlot.ShowAxisArrows = true;
    barPlot.ArrowSize = 10;

    // 网格线样式(细线更丝滑)
    barPlot.GridLineWidth = 0.5f;
    barPlot.GridColor = Color.FromArgb(220, 220, 220);

    // 预留空间给箭头和标签
    barPlot.SetMarginPercent(bottom: 0.05, top: 0.15);

    barPlot.RefreshPlot();
    this.Controls.Add(barPlot);
}
示例4:暗色主题背景图
public void Demo4_DarkThemeWithBackground()
{
    var barPlot = new BarPlotEx
    {
        Dock = DockStyle.Fill,
        Title = "暗色主题示例",
        TitleColor = Color.White,
        ColorType = ColorType.Warning
    };

    // 设置暗色背景
    barPlot.BackColor = Color.FromArgb(30, 30, 30);

    // 或设置背景图
    // barPlot.BackgroundImage = Image.FromFile("dark-bg.png");
    // barPlot.BackgroundImageLayout = ImageLayout.Stretch;

    // 添加数据
    double[] values = { 65, 78, 90, 81, 56 };
    var series = barPlot.AddBars(values);

    string[] months = { "一月", "二月", "三月", "四月", "五月" };
    for (int i = 0; i < months.Length; i++)
    {
        series.Items[i].Label = months[i];
        series.Items[i].ValueLabel = values[i].ToString();
    }

    barPlot.ShowValueLabels = true;
    barPlot.SetMarginPercent(bottom: 0, top: 0.15);
    barPlot.RefreshPlot();
    this.Controls.Add(barPlot);
}
注意事项
- 边距设置 :
MarginBottomPercent = 0 可使柱子贴底显示,参考 ScottPlot 的 Axes.Margins(bottom: 0)
- 值标签空间 :显示值标签时,建议设置
MarginTopPercent = 0.15-0.2 预留顶部空间
- 数据范围 :控件会自动计算数据范围,最大值会根据
MarginTopPercent 自动调整
- 多系列宽度:多系列数据时,柱子会自动平分分类宽度
- 主题切换 :设置
FollowGlobalTheme = false 可禁用自动主题切换
- Y轴箭头:箭头显示在最顶部,自动预留空间防止与网格线重叠
- 图例位置:所有图例位置都在数据区域外部,不会遮挡数据
- X轴旋转标签 :旋转后的标签从轴线下方开始,使用
XAxisLabelOffset 调整距离
- 动画效果:添加数据后自动播放生长动画,设计模式下自动禁用
版本历史
| 版本 |
日期 |
更新内容 |
| 1.0 |
2025-04-20 |
初始版本 |
| 1.1 |
2025-04-23 |
添加 AddBars 数组重载方法(支持 X轴标签、值标签数组) |
| 1.2 |
2025-04-23 |
添加柱状图生长动画效果 |
三、后记
陆续补充完善中,如有需求,请留言