1.3 Openlayers调用ArcGis地图服务之要素查询(/query)
下面使用ArcGis官方服务作为示例直接调用(如果使用自己的私有服务,可能先要获取token)
各个库版本如下:
javascript
    "ol": "^10.8.0",
    "proj4": "^2.20.8",
    "vue3-openlayers": "^12.2.2"
目录
- [1.3 要素查询【地图服务的查询接口(/query)】](#1.3 要素查询【地图服务的查询接口(/query)】)
- [1.3.1 介绍](#1.3.1 介绍)
- [1.3.2 判断](#1.3.2 判断)
- [1.3.3 调用](#1.3.3 调用)
- [1.3.3.1 在线调用](#1.3.3.1 在线调用)
- [1.3.3.2 Openlayers调用](#1.3.3.2 Openlayers调用)
- [1.3.3.3 Vue3-Openlayers调用](#1.3.3.3 Vue3-Openlayers调用)
1.3 要素查询【地图服务的查询接口(/query)】
1.3.1 介绍
要素查询主要用于对发布的服务中的要素(Features)进行查询和筛选。它允许客户端(Web 应用、桌面软件、脚本)基于空间关系、属性条件或对象 ID 来获取数据,使用/query接口只能针对单个图层,支持空间过滤
1.3.1.1 核心用法
- 根据条件(如"城市名=北京")查询要素
- 根据空间范围(如画一个矩形或多边形)查询该区域内的要素
- 根据对象 ID 列表精确获取特定要素
- 返回要素的几何、属性或统计结果
| 模式 | 说明 | 示例场景 |
|---|---|---|
| 属性查询 | 基于 where 子句(类似 SQL) | where = "POP > 1000000" |
| 空间查询 | 基于几何关系(相交、包含、邻近等) | 点击地图查询该位置的建筑物 |
| ID 查询 | 使用 objectIds 参数直接获取 | 选中已知 ID 的要素并高亮 |
| 统计查询 | 基于outStatistics等统计字段 | 计算某个字段的平均,总和 |
1.3.1.2 参数介绍
如下参数
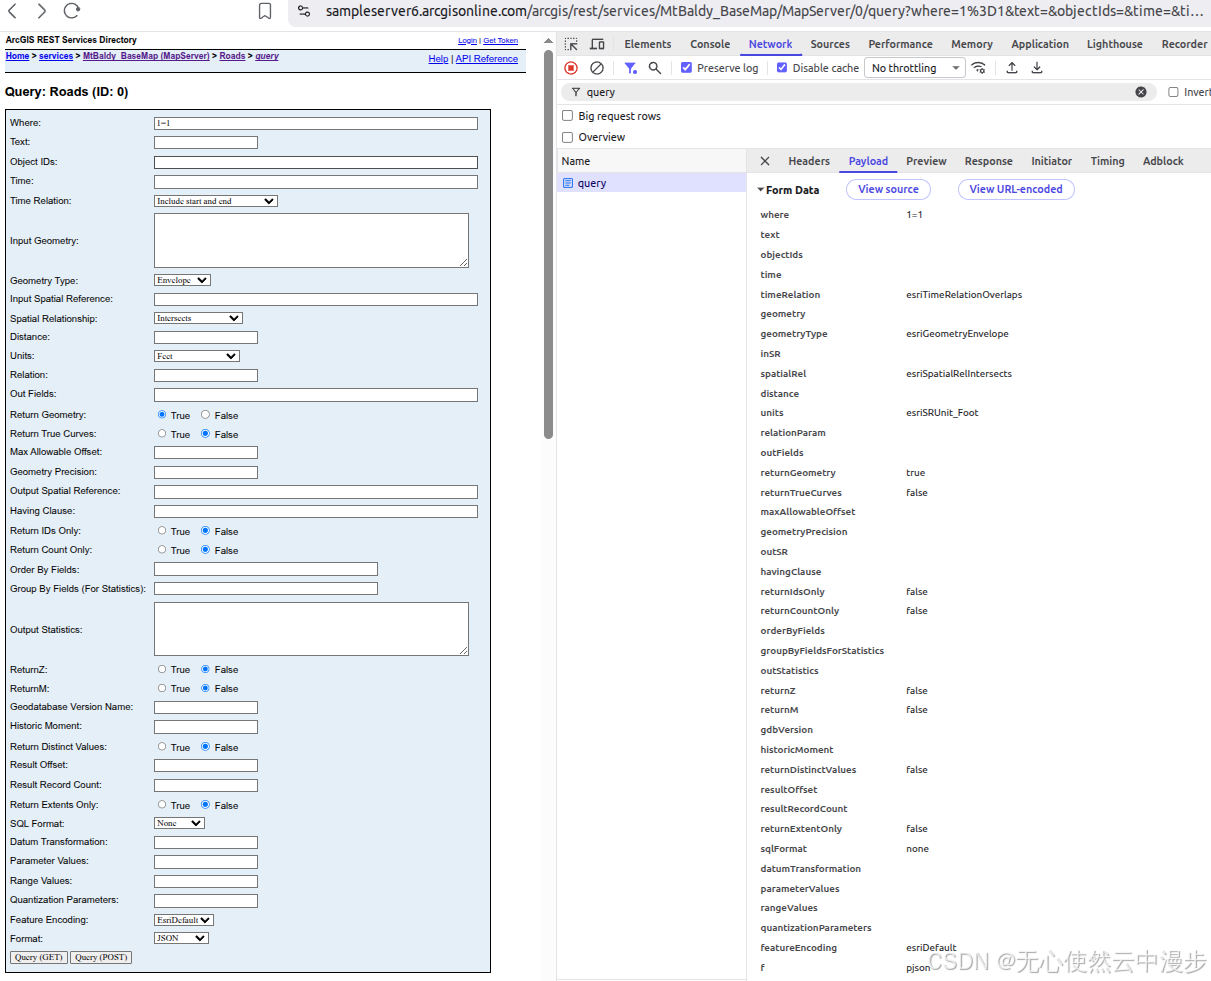
1.3.1.2.1 核心查询参数
-
where=1=1
作用:SQL 风格的属性查询条件。1=1 表示永远为真,即返回所有满足其他条件的要素(不进行属性过滤)
当前值:1=1
示例:
  "POPULATION > 1000000" - 人口大于100万

  "NAME = 'Beijing'" - 名称为北京

  "NAME LIKE '%河%'" - 名称包含"河"字
注意:字符串值需用单引号,URL 中需编码(= 变为 %3D)
-
text=
作用:全文搜索参数,在服务的所有可搜索字段中查找包含该文本的要素
当前值:空(不使用)
示例:text=学校 - 查找名称或地址中包含"学校"的要素
注意:需要服务发布时启用了全文索引,功能较弱,推荐使用 where
-
objectIds=
作用:精确查询指定对象 ID 的要素,多个 ID 用逗号分隔
当前值:空
示例:objectIds=1,5,23,47
注意:如果指定了 objectIds,会忽略 where 条件
-
time=
作用:时间过滤,查询时间字段在指定范围内的要素
当前值:空
格式:时间戳(毫秒数),可指定范围如 1199145600000,1199145600000
示例:time=1609459200000 - 查询2021年1月1日的数据
-
timeRelation=esriTimeRelationOverlaps
作用:时间字段与查询时间范围的关系类型
当前值:esriTimeRelationOverlaps - 时间范围重叠
可选值:
   esriTimeRelationContains - 要素时间包含查询时间

   esriTimeRelationWithin - 要素时间在查询时间内

   esriTimeRelationOverlaps - 有重叠

   esriTimeRelationEquals - 相等
1.3.1.2.2 空间查询参数
-
geometry=
作用:空间查询的几何图形(点、线、面、矩形)
当前值:空
格式:JSON 对象,如 {"x":116.39,"y":39.91,"spatialReference":{"wkid":4326}}
示例:查询某点周围要素
-
geometryType=esriGeometryEnvelope
作用:指定 geometry 参数的几何类型
当前值:esriGeometryEnvelope - 矩形(包络线)
可选值:
esriGeometryPoint - 点 esriGeometryPolyline - 线 esriGeometryPolygon - 面 esriGeometryEnvelope - 矩形(用 xmin,ymin,xmax,ymax 表示) -
inSR=
作用:输入几何(geometry)的空间参考(WKID)
当前值:空(默认与服务的坐标系相同)
示例:inSR=4326(WGS84 经纬度)、inSR=3857(Web 墨卡托)
-
spatialRel=esriSpatialRelIntersects
作用:空间查询的空间关系
当前值:esriSpatialRelIntersects - 相交(最常见)
可选值:
esriSpatialRelIntersects - 相交(有重叠或接触) esriSpatialRelContains - 包含 esriSpatialRelWithin - 在内部 esriSpatialRelCrosses - 交叉 esriSpatialRelEnvelopeIntersects - 包络线相交(性能更好) esriSpatialRelIndexIntersects - 索引相交 esriSpatialRelOverlaps - 重叠 esriSpatialRelTouches - 接触 -
distance=
作用:空间查询的缓冲距离(与 esriSpatialRelIntersects 配合使用时,查询几何图形周边距离内的要素)
当前值:空
示例:distance=100 - 查询几何周围100个单位内的要素
-
units=esriSRUnit_Foot
作用:distance 参数的单位
当前值:esriSRUnit_Foot - 英尺
可选值:
esriSRUnit_Meter - 米 esriSRUnit_Foot - 英尺 esriSRUnit_Kilometer - 公里 esriSRUnit_Mile - 英里 esriSRUnit_IntDecimalDegree - 度 -
relationParam=
作用:空间关系参数,用于更复杂的关系查询(如 esriSpatialRelRelation 时)
当前值:空
示例:用于指定 Clementini 算子等高级空间关系
1.3.1.2.3 返回内容控制参数
-
outFields=
作用:指定要返回的属性字段列表
当前值:空(默认只返回 objectId 和几何)
示例:
outFields=NAME,POPULATION - 返回指定字段 outFields=* - 返回所有字段 -
returnGeometry=true
作用:是否返回要素的几何形状(坐标点串)
当前值:true - 返回几何
注意:不需要几何时设为 false 可显著提升性能
-
returnTrueCurves=false
作用:是否返回真曲线(贝塞尔曲线、圆弧等)
当前值:false - 不返回真曲线,而是近似为线段
注意:如果服务包含曲线几何,设为 true 可保持曲线特性,但客户端需要支持
-
maxAllowableOffset=
作用:几何简化的最大允许偏移量(单位与地图相同),减少返回的数据量,提高传输效率
当前值:空
示例:maxAllowableOffset=10 - 简化几何,偏移不超过10个单位
-
geometryPrecision=
作用:几何坐标的小数位数精度控制,减少数据量,保护精度
当前值:空
示例:geometryPrecision=4 - 保留4位小数
-
outSR=
作用:输出几何的空间参考
当前值:空(默认使用服务的坐标系)
示例:outSR=4326 - 输出 WGS84 经纬度坐标
-
returnZ=false
作用:是否返回几何的 Z 坐标(高程/高度)
当前值:false - 不返回
注意:如果数据是 3D 且需要高度信息,设为 true
-
returnM=false
作用:是否返回几何的 M 值(测量值,如里程、时间),用于线性参考数据
当前值:false - 不返回
1.3.1.2.4 统计与聚合参数
-
havingClause=
作用:与 groupByFieldsForStatistics 配合,对分组后的结果进行过滤(类似 SQL 的 HAVING)
当前值:空
示例:havingClause="AVG(POP) > 50000"
-
groupByFieldsForStatistics=
作用:统计时的分组字段,多个字段用逗号分隔
当前值:空
示例:groupByFieldsForStatistics=CITY_NAME
-
outStatistics=
作用:统计计算参数,返回聚合结果而非原始要素
当前值:空
格式:JSON 数组,如:{"statisticType": "sum","onStatisticField": "POPULATION","outStatisticFieldName": "total_pop"}
statisticType:count、sum、avg、min、max、stddev、var
-
returnDistinctValues=false
作用:返回指定字段的唯一值(去重)
当前值:false
使用前提:需要同时指定 outFields,不能返回几何
1.3.1.2.5 统计与聚合参数
-
returnIdsOnly=false
作用:只返回匹配要素的 Object ID,不返回属性和几何
当前值:false
用途:快速获取符合条件的要素 ID 列表,然后再分批查询详情
-
returnCountOnly=false
作用:只返回匹配要素的数量,不返回任何要素数据
当前值:false
示例响应:{"count": 1234}
用途:先获取总数,用于分页或进度显示
-
returnExtentOnly=false
作用:只返回匹配要素的外包矩形范围(Extent)
当前值:false
示例响应:{"extent": {"xmin":..., "ymin":..., "xmax":..., "ymax":...}}
-
resultOffset=
作用:分页查询的起始位置(跳过前 N 条)
当前值:空
示例:resultOffset=100 - 从第101条开始
-
resultRecordCount=
作用:分页查询的每页记录数
当前值:空
示例:resultRecordCount=50 - 每页50条
注意:建议配合 orderByFields 使用,保证分页稳定
-
orderByFields=
作用:对结果进行排序
当前值:空
示例:
orderByFields=POPULATION DESC - 人口降序

orderByFields=NAME ASC, POPULATION DESC - 多字段排序
1.3.1.2.6 统计与聚合参数
-
gdbVersion=
作用:查询指定地理数据库版本的数据(用于版本化数据)
当前值:空
示例:gdbVersion=SDE.DEFAULT
-
historicMoment=
作用:查询历史时刻的数据(需要数据启用历史追踪)
当前值:空
格式:时间戳,如 1609459200000
1.3.1.2.7 高级与扩展参数
-
sqlFormat=none
作用:where 子句的 SQL 格式
当前值:none - 标准格式
可选值:standard(SQL 92标准)、none(原生格式)
-
datumTransformation=
作用:坐标转换时的基准面转换方法
当前值:空
示例:datumTransformation=4326 - 指定转换方法 ID
-
parameterValues=
作用:传递参数化查询的值(防止 SQL 注入)
当前值:空
格式:JSON 对象
-
rangeValues=
作用:对栅格或影像服务的范围查询
当前值:空
说明:主要用于影像服务的波段范围过滤
-
quantizationParameters=
作用:几何量化参数,用于压缩几何数据
当前值:空
用途:减少数据量,提高传输效率(常用于移动端)
-
featureEncoding=esriDefault
作用:要素编码格式
当前值:esriDefault - 默认编码
可选值:esriDefault、esriStandard、esriPBF(Protocol Buffers)
-
f=pjson
作用:返回结果的格式
当前值:pjson - Pretty JSON(格式化后的 JSON)
可选值:
   json - 紧凑 JSON

   pjson - 格式化 JSON

   geojson - GeoJSON 格式

   html - HTML 表格

   sqlite - SQLite 数据库(移动端)
1.3.1.3 典型场景
| 场景 | 关键参数组合 |
|---|---|
| 点击查询 | geometry + geometryType=Point + spatialRel=esriSpatialRelIntersects |
| 框选查询 | geometry (矩形) + geometryType=Envelope + returnGeometry=true |
| 属性筛选 | where=条件 + outFields=* + returnGeometry=false |
| 分页浏览 | where=1=1 + resultOffset + resultRecordCount + orderByFields |
| 统计汇总 | outStatistics + groupByFieldsForStatistics |
| 获取总数 | returnCountOnly=true |
| 唯一值列表 | returnDistinctValues=true + outFields=字段名 |
1.3.2 判断
一般查询服务要应用在图层上,所以我们可以进入到图层中查看
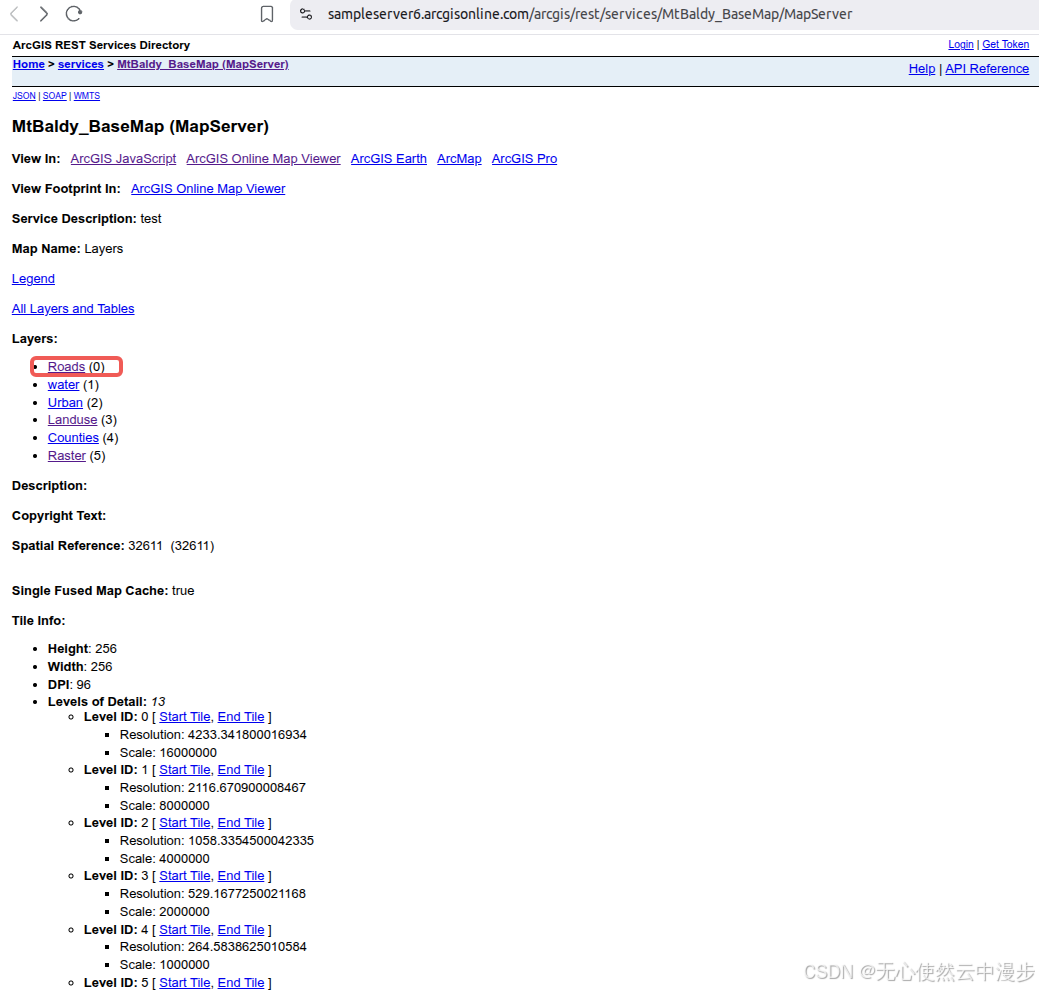
点击红框内的Roads(0),即进入图层
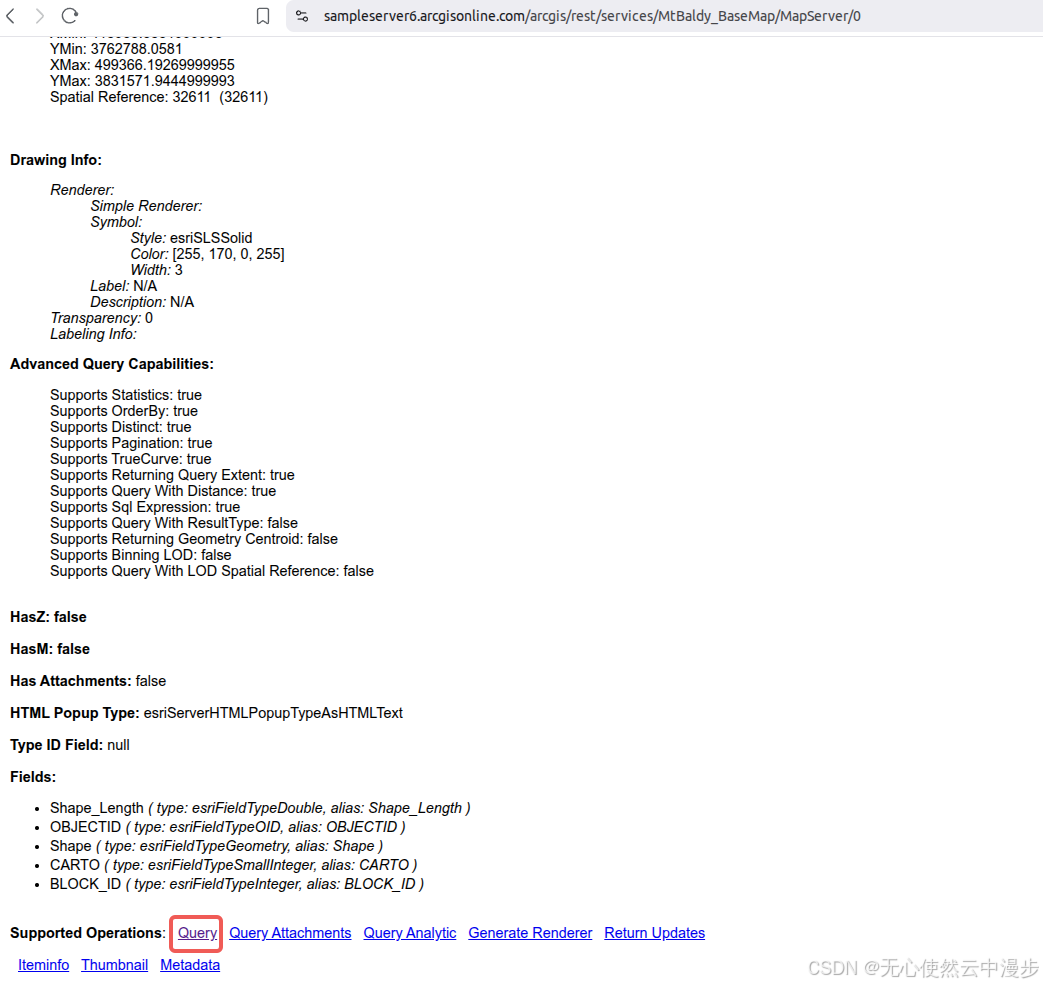
可以看到Supported Operations中有Query就基本可以判断支持查询要素
1.3.3 调用
1.3.3.1 在线调用
点击Query,进入在线调用页面

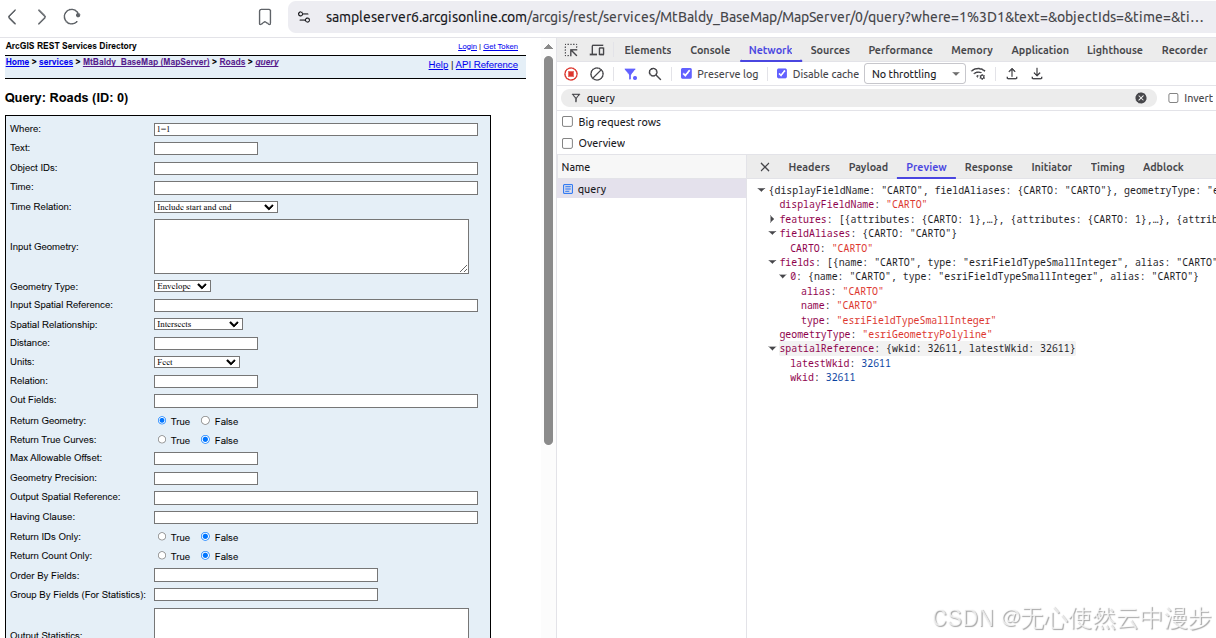
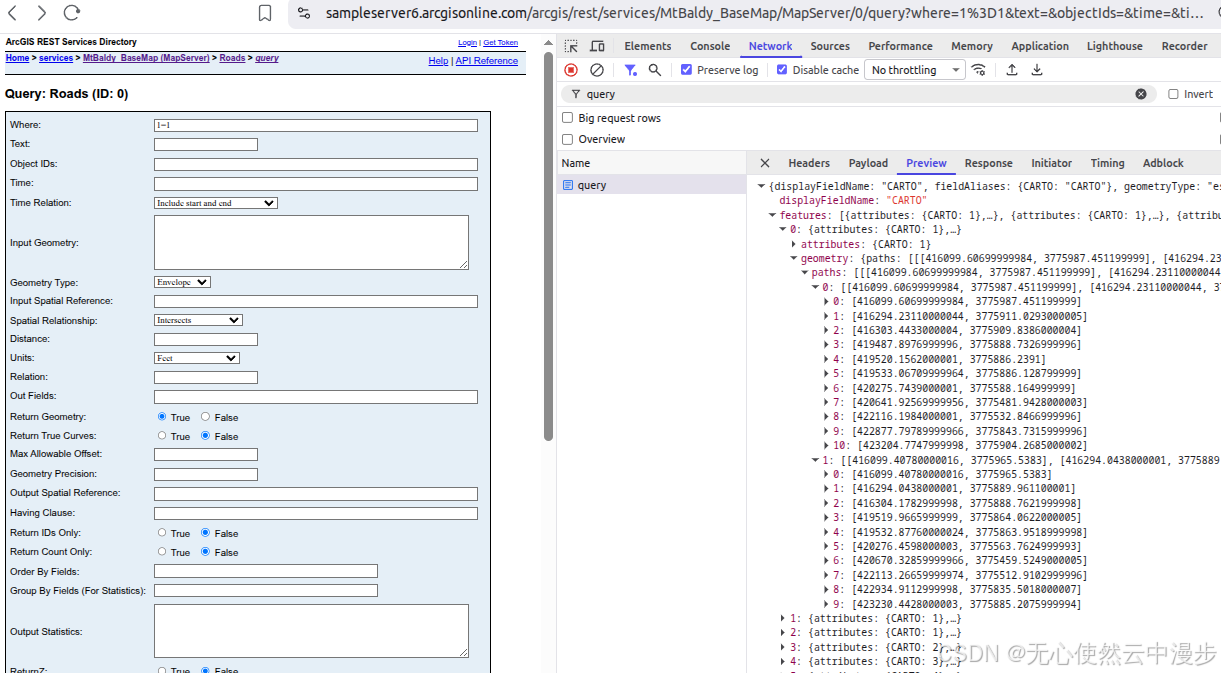
填写参数提交,返回结果中,可以看到
- fields 表明了每个feature中的attributes中包含了哪些字段,图中表明只包含CARTO字段
- geometryType 表明了每个feature中的geometry是什么类型,图中表明是esriGeometryPolyline这种折线类型
- spatialReference 表明了坐标系或投影,图中是wkid: 32611
- features 是返回的坐标及其属性信息,其中的attributes是属性信息,geometry是几何坐标信息
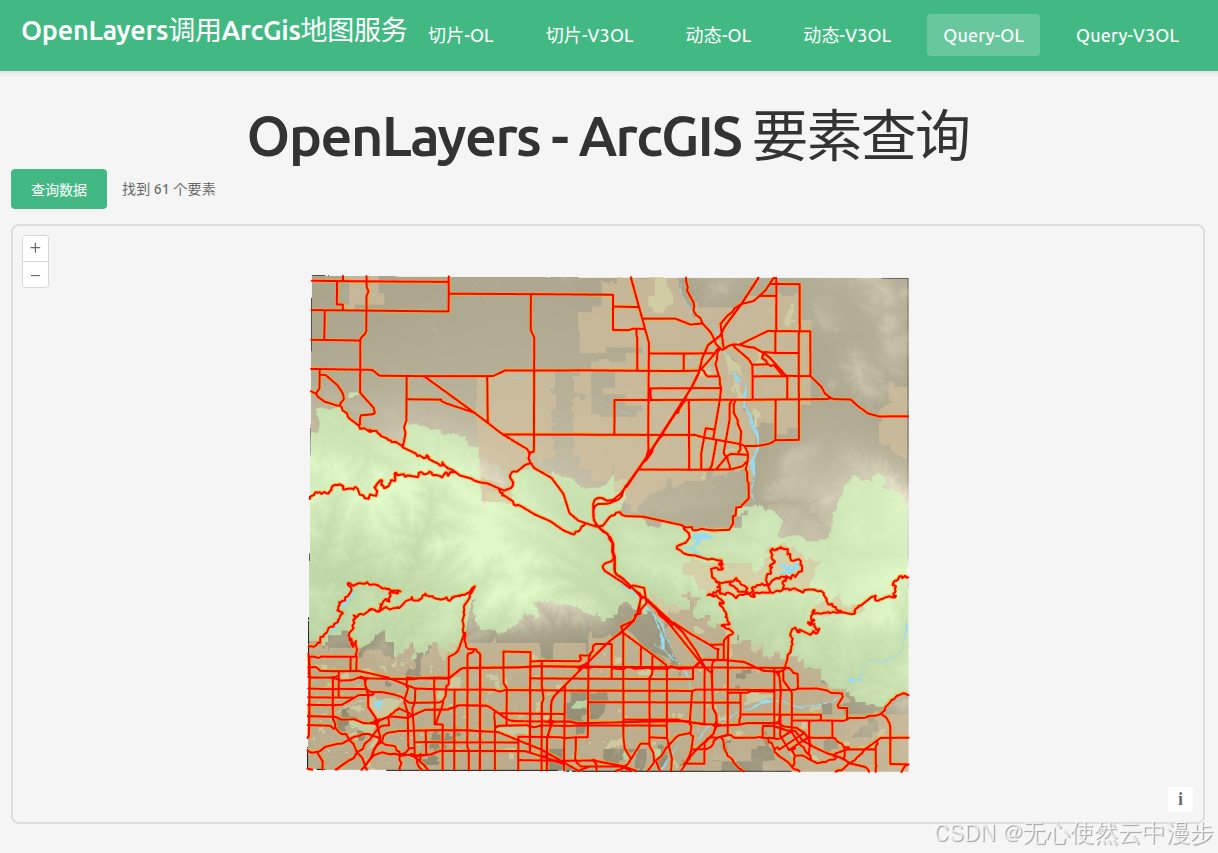
1.3.3.2 Openlayers调用
渲染切片:
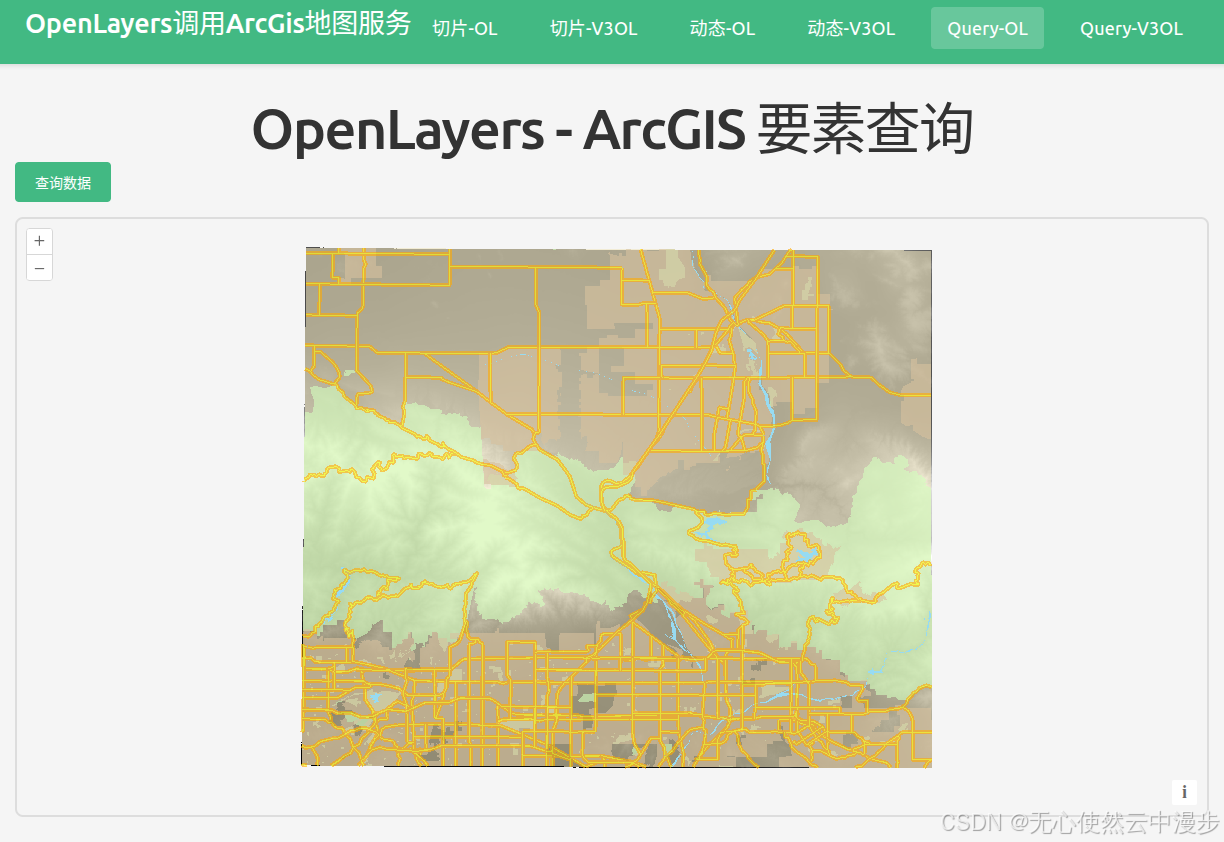
点击查询数据按钮,调用/query接口查询要素,渲染矢量数据:
- 方式一,先请求矢量数据,再渲染
javascript
<template>
  <div class="map-page">
    <h1>OpenLayers - ArcGIS 要素查询(query)</h1>
    <div class="controls">
      <button @click="queryArcGIS" :disabled="loading">
        {{ loading ? "加载中..." : "查询数据" }}
      </button>
      <span v-if="featureCount" class="feature-count"
        >找到 {{ featureCount }} 个要素</span
      >
    </div>
    <div id="ol-query-map" ref="mapContainer" class="map-container"></div>
    <div v-if="error" class="error">{{ error }}</div>
  </div>
</template>

<script setup lang="ts">
import { onMounted, onUnmounted, ref } from "vue";
import axios from "axios";
import Map from "ol/Map";
import View from "ol/View";
import TileLayer from "ol/layer/Tile";
import VectorLayer from "ol/layer/Vector";
import VectorSource from "ol/source/Vector";
import { XYZ } from "ol/source";
import { EsriJSON } from "ol/format";
import { Style, Fill, Stroke } from "ol/style";
import TileGrid from "ol/tilegrid/TileGrid";
import { register } from "ol/proj/proj4";
import proj4 from "proj4";

// 注册 EPSG:32611 投影
proj4.defs("EPSG:32611", "+proj=utm +zone=11 +datum=WGS84 +units=m +no_defs");
register(proj4);

const mapContainer = ref<HTMLDivElement>();
const loading = ref(false);
const featureCount = ref(0);
const error = ref("");

let map: Map | null = null;
const queryLayer = new VectorLayer({
  source: new VectorSource(),
  style: new Style({
    stroke: new Stroke({
      color: "#FF0000",
      width: 2,
    }),
    fill: new Fill({
      color: "rgba(255, 0, 0, 0.1)",
    }),
  }),
});

// Query ArcGIS REST API
const queryArcGIS = async () => {
  loading.value = true;
  error.value = "";

  try {
    const response = await axios.get(
      "https://sampleserver6.arcgisonline.com/arcgis/rest/services/MtBaldy_BaseMap/MapServer/0/query",
      {
        params: {
          f: "pjson",
          where: "1=1",
          returnGeometry: "true",
          outFields: "*",
          spatialRel: "esriSpatialRelIntersects",
        },
      },
    );

    const format = new EsriJSON();
    const features = format.readFeatures(response.data, {
      featureProjection: "EPSG:32611",
    });

    const source = queryLayer.getSource();
    source?.clear();
    source?.addFeatures(features);

    featureCount.value = features.length;

    // Zoom to features extent
    if (features.length > 0 && source) {
      const extent = source.getExtent();
      const view = map?.getView();
      if (view && extent) {
        view.fit(extent, { padding: [50, 50, 50, 50], duration: 1000 });
      }
    }
  } catch (err: any) {
    error.value = "查询失败: " + (err.message || "未知错误");
    console.error("Query error:", err);
  } finally {
    loading.value = false;
  }
};

// 从 MapServer 获取的 resolutions
const resolutions = [
  4233.341800016934, 2116.670900008467, 1058.3354500042335, 529.1677250021168,
  264.5838625010584, 132.2919312505292, 66.1459656252646, 33.0729828126323,
  16.53649140631615, 8.268245703158074, 4.134122851579037, 2.0670614257895186,
  1.0335307128947593,
];

// 创建 TileGrid
const tileGrid = new TileGrid({
  origin: [-5120900, 9998100],
  resolutions: resolutions,
  tileSize: [256, 256],
});

onMounted(() => {
  // Base map layer using ArcGIS MapServer tiles
  const baseLayer = new TileLayer({
    source: new XYZ({
      url: "https://sampleserver6.arcgisonline.com/arcgis/rest/services/MtBaldy_BaseMap/MapServer/tile/{z}/{y}/{x}",
      attributions: "ArcGIS",
      projection: "EPSG:32611",
      tileGrid: tileGrid,
    }),
  });

  // Create map
  map = new Map({
    target: mapContainer.value!,
    layers: [baseLayer, queryLayer],
    view: new View({
      projection: "EPSG:32611",
      center: [457000, 3796000], // UTM zone 11N 坐标 (MtBaldy 区域)
      zoom: 5,
      resolutions: resolutions,
    }),
  });
});

onUnmounted(() => {
  if (map) {
    map.setTarget(undefined);
    map = null;
  }
});
</script>

<style scoped>
.map-page {
  padding: 20px;
}

h1 {
  margin-bottom: 20px;
  color: #333;
}

.controls {
  margin-bottom: 15px;
  display: flex;
  align-items: center;
  gap: 15px;
}

.controls button {
  padding: 10px 20px;
  background-color: #42b983;
  color: white;
  border: none;
  border-radius: 4px;
  cursor: pointer;
  font-size: 14px;
  transition: background-color 0.3s;
}

.controls button:hover:not(:disabled) {
  background-color: #3aa876;
}

.controls button:disabled {
  opacity: 0.6;
  cursor: not-allowed;
}

.feature-count {
  color: #666;
  font-size: 14px;
}

.map-container {
  width: 100%;
  height: 600px;
  border: 2px solid #ddd;
  border-radius: 8px;
}

.error {
  margin-top: 10px;
  padding: 10px;
  background-color: #fee;
  color: #c33;
  border-radius: 4px;
}
</style>- 方式二,使用source上的loader函数
javascript
<template>
  <div class="map-page">
    <h1>OpenLayers - ArcGIS 要素查询(Loader 方式)</h1>
    <div class="controls">
      <button @click="queryArcGIS" :disabled="loading">
        {{ loading ? "加载中..." : "查询数据" }}
      </button>
      <span v-if="featureCount" class="feature-count"
        >找到 {{ featureCount }} 个要素</span
      >
    </div>
    <div id="ol-query-map" ref="mapContainer" class="map-container"></div>
    <div v-if="error" class="error">{{ error }}</div>
  </div>
</template>

<script setup lang="ts">
import { onMounted, onUnmounted, ref } from "vue";
import axios from "axios";
import Map from "ol/Map";
import View from "ol/View";
import TileLayer from "ol/layer/Tile";
import VectorLayer from "ol/layer/Vector";
import VectorSource from "ol/source/Vector";
import { XYZ } from "ol/source";
import { EsriJSON } from "ol/format";
import { Style, Fill, Stroke } from "ol/style";
import TileGrid from "ol/tilegrid/TileGrid";
import { register } from "ol/proj/proj4";
import proj4 from "proj4";
import type { Extent } from "ol/extent";

// 注册 EPSG:32611 投影
proj4.defs("EPSG:32611", "+proj=utm +zone=11 +datum=WGS84 +units=m +no_defs");
register(proj4);

const mapContainer = ref<HTMLDivElement>();
const loading = ref(false);
const featureCount = ref(0);
const error = ref("");
const vectorSourceRef = ref<VectorSource>();

let map: Map | null = null;

// 创建带有 loader 函数的 VectorSource
const createVectorSourceWithLoader = () => {
  return new VectorSource({
    loader: async (extent, resolution, projection, success) => {
      loading.value = true;
      error.value = "";

      try {
        const formData = new FormData();
        formData.append("f", "pjson");
        formData.append("where", "1=1");
        formData.append("returnGeometry", "true");
        formData.append("outFields", "*");
        formData.append("spatialRel", "esriSpatialRelIntersects");
        formData.append("inSR", "32611");

        const response = await axios.post(
          "https://sampleserver6.arcgisonline.com/arcgis/rest/services/MtBaldy_BaseMap/MapServer/0/query",
          formData
        );

        const format = new EsriJSON();
        const features = format.readFeatures(response.data, {
          featureProjection: "EPSG:32611",
        });

        // 使用 ref 获取 source
        const source = vectorSourceRef.value;
        if (source) {
          source.clear();
          source.addFeatures(features);

          featureCount.value = features.length;

          // Zoom to features extent
          if (features.length > 0) {
            const extent = source.getExtent();
            const view = map?.getView();
            if (view && extent) {
              view.fit(extent, { padding: [50, 50, 50, 50], duration: 1000 });
            }
          }
        }

        success(features);
      } catch (err: any) {
        error.value = "查询失败: " + (err.message || "未知错误");
        console.error("Query error:", err);
      } finally {
        loading.value = false;
      }
    },
  });
};

const queryLayer = new VectorLayer({
  source: createVectorSourceWithLoader(),
  style: new Style({
    stroke: new Stroke({
      color: "#FF0000",
      width: 2,
    }),
    fill: new Fill({
      color: "rgba(255, 0, 0, 0.1)",
    }),
  }),
});

// Query ArcGIS REST API - 触发 loader
const queryArcGIS = () => {
  const source = queryLayer.getSource();
  if (source) {
    source.refresh();
  }
};

// 从 MapServer 获取的 resolutions
const resolutions = [
  4233.341800016934, 2116.670900008467, 1058.3354500042335, 529.1677250021168,
  264.5838625010584, 132.2919312505292, 66.1459656252646, 33.0729828126323,
  16.53649140631615, 8.268245703158074, 4.134122851579037, 2.0670614257895186,
  1.0335307128947593,
];

// 创建 TileGrid
const tileGrid = new TileGrid({
  origin: [-5120900, 9998100],
  resolutions: resolutions,
  tileSize: [256, 256],
});

onMounted(() => {
  // 保存 source 引用
  vectorSourceRef.value = queryLayer.getSource() as VectorSource;

  // Base map layer using ArcGIS MapServer tiles
  const baseLayer = new TileLayer({
    source: new XYZ({
      url: "https://sampleserver6.arcgisonline.com/arcgis/rest/services/MtBaldy_BaseMap/MapServer/tile/{z}/{y}/{x}",
      attributions: "ArcGIS",
      projection: "EPSG:32611",
      tileGrid: tileGrid,
    }),
  });

  // Create map
  map = new Map({
    target: mapContainer.value!,
    layers: [baseLayer, queryLayer],
    view: new View({
      projection: "EPSG:32611",
      center: [457000, 3796000], // UTM zone 11N 坐标 (MtBaldy 区域)
      zoom: 5,
      resolutions: resolutions,
    }),
  });
});

onUnmounted(() => {
  if (map) {
    map.setTarget(undefined);
    map = null;
  }
});
</script>

<style scoped>
.map-page {
  padding: 20px;
}

h1 {
  margin-bottom: 20px;
  color: #333;
}

.controls {
  margin-bottom: 15px;
  display: flex;
  align-items: center;
  gap: 15px;
}

.controls button {
  padding: 10px 20px;
  background-color: #42b983;
  color: white;
  border: none;
  border-radius: 4px;
  cursor: pointer;
  font-size: 14px;
  transition: background-color 0.3s;
}

.controls button:hover:not(:disabled) {
  background-color: #3aa876;
}

.controls button:disabled {
  opacity: 0.6;
  cursor: not-allowed;
}

.feature-count {
  color: #666;
  font-size: 14px;
}

.map-container {
  width: 100%;
  height: 600px;
  border: 2px solid #ddd;
  border-radius: 8px;
}

.error {
  margin-top: 10px;
  padding: 10px;
  background-color: #fee;
  color: #c33;
  border-radius: 4px;
}
</style>
当然,为了性能,layer也可以使用WebGLTileLayer,但是这样需要在WebGLTileLayer上绑定styles来控制样式,styles需要使用
{
'stroke-width': 5,
'stroke-color': 'rgba(255,128,128,1)',
'fill-color': '#0000ff40'
}这样的形式绑定
1.3.3.3 Vue3-Openlayers调用
渲染切片:
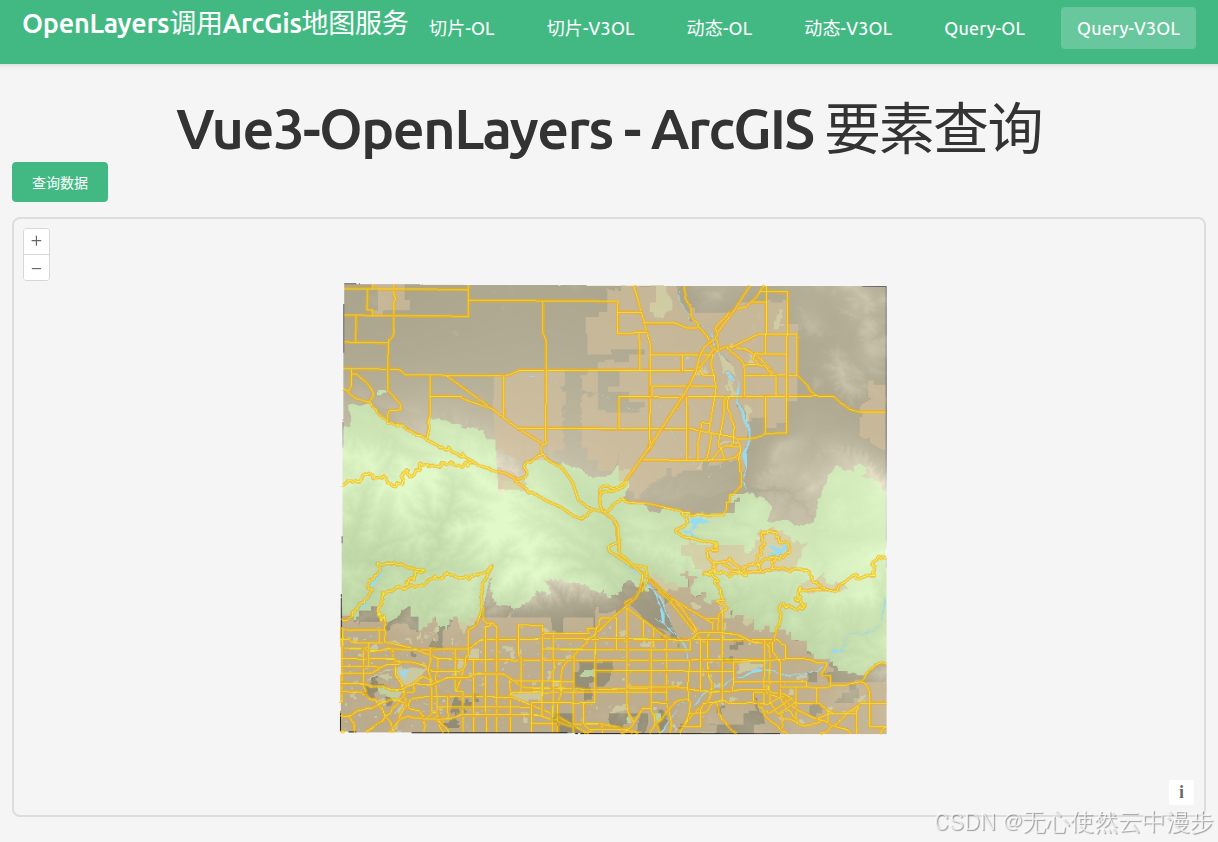
点击查询数据按钮,调用/query接口查询要素,渲染矢量数据:
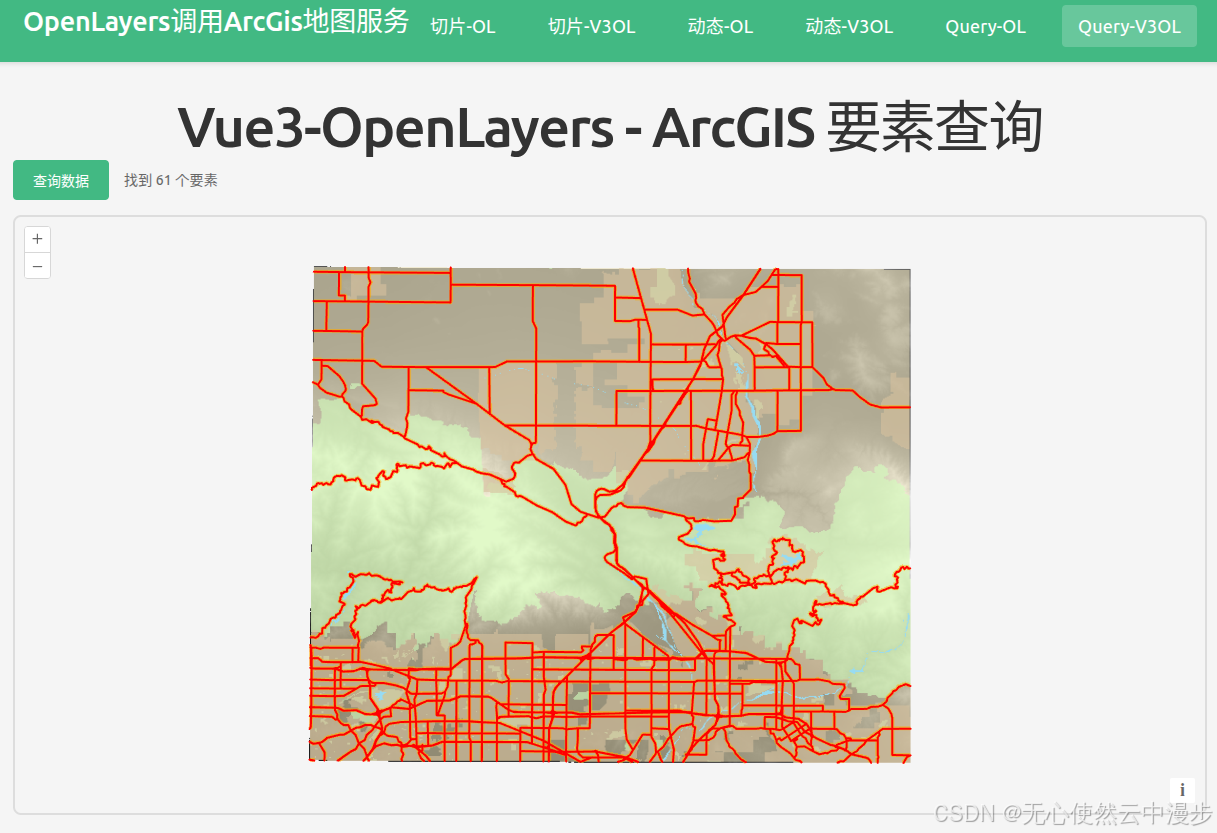
- 方式一,先请求矢量数据,再渲染
javascript
<template>
  <div class="map-page">
    <h1>Vue3-OpenLayers - ArcGIS 要素查询(query)</h1>
    <div class="controls">
      <button @click="queryArcGIS" :disabled="loading">
        {{ loading ? '加载中...' : '查询数据' }}
      </button>
      <span v-if="featureCount" class="feature-count">找到 {{ featureCount }} 个要素</span>
    </div>

    <ol-map
      ref="mapRef"
      :loadTilesWhileAnimating="true"
      :loadTilesWhileInteracting="true"
      style="height: 600px; width: 100%; border: 2px solid #ddd; border-radius: 8px;"
    >
      <ol-view
        ref="viewRef"
        :center="center"
        :zoom="12"
        :projection="projection"
      />

      <ol-tile-layer>
        <ol-source-xyz
          url="https://sampleserver6.arcgisonline.com/arcgis/rest/services/MtBaldy_BaseMap/MapServer/tile/{z}/{y}/{x}"
          attributions="ArcGIS"
          :projection="projection"
          :tileGrid="tileGrid"
        />
      </ol-tile-layer>

      <ol-vector-layer>
        <ol-source-vector ref="vectorSourceRef">
          <ol-style>
            <ol-style-stroke color="#FF0000" :width="2" />
            <ol-style-fill color="rgba(255, 0, 0, 0.1)" />
          </ol-style>
        </ol-source-vector>
      </ol-vector-layer>
    </ol-map>

    <div v-if="error" class="error">{{ error }}</div>
  </div>
</template>

<script setup lang="ts">
import { ref } from "vue";
import axios from "axios";
import { EsriJSON } from "ol/format";
import TileGrid from "ol/tilegrid/TileGrid";
import { register } from "ol/proj/proj4";
import proj4 from "proj4";

// 注册 EPSG:32611 投影
proj4.defs("EPSG:32611", "+proj=utm +zone=11 +datum=WGS84 +units=m +no_defs");
register(proj4);

// 从 MapServer 获取的 resolutions
const resolutions = [
  4233.341800016934, 2116.670900008467, 1058.3354500042335, 529.1677250021168,
  264.5838625010584, 132.2919312505292, 66.1459656252646, 33.0729828126323,
  16.53649140631615, 8.268245703158074, 4.134122851579037, 2.0670614257895186,
  1.0335307128947593,
];

// 创建 TileGrid
const tileGrid = new TileGrid({
  origin: [-5120900, 9998100],
  resolutions: resolutions,
  tileSize: [256, 256],
});

const projection = "EPSG:32611";
const center = ref([457000, 3796000]); // UTM zone 11N 坐标 (MtBaldy 区域)
const loading = ref(false);
const featureCount = ref(0);
const error = ref("");
const vectorSourceRef = ref();
const viewRef = ref();
const mapRef = ref();

// Query ArcGIS REST API
const queryArcGIS = async () => {
  loading.value = true;
  error.value = "";

  try {
    const response = await axios.get(
      "https://sampleserver6.arcgisonline.com/arcgis/rest/services/MtBaldy_BaseMap/MapServer/0/query",
      {
        params: {
          f: "pjson",
          where: "1=1",
          returnGeometry: "true",
          outFields: "*",
          spatialRel: "esriSpatialRelIntersects"
        }
      }
    );

    const format = new EsriJSON();
    const features = format.readFeatures(response.data, {
      featureProjection: "EPSG:32611"
    });

    const source = vectorSourceRef.value?.source;
    if (source) {
      source.clear();
      source.addFeatures(features);
    }

    featureCount.value = features.length;

    // Zoom to features extent
    if (features.length > 0 && source) {
      const extent = source.getExtent();
      const view = viewRef.value?.view;
      if (view && extent) {
        view.fit(extent, { padding: [50, 50, 50, 50], duration: 1000 });
      }
    }
  } catch (err: any) {
    error.value = "查询失败: " + (err.message || "未知错误");
    console.error("Query error:", err);
  } finally {
    loading.value = false;
  }
};
</script>

<style scoped>
.map-page {
  padding: 20px;
}

h1 {
  margin-bottom: 20px;
  color: #333;
}

.controls {
  margin-bottom: 15px;
  display: flex;
  align-items: center;
  gap: 15px;
}

.controls button {
  padding: 10px 20px;
  background-color: #42b983;
  color: white;
  border: none;
  border-radius: 4px;
  cursor: pointer;
  font-size: 14px;
  transition: background-color 0.3s;
}

.controls button:hover:not(:disabled) {
  background-color: #3aa876;
}

.controls button:disabled {
  opacity: 0.6;
  cursor: not-allowed;
}

.feature-count {
  color: #666;
  font-size: 14px;
}

.error {
  margin-top: 10px;
  padding: 10px;
  background-color: #fee;
  color: #c33;
  border-radius: 4px;
}
</style>- 方式二,使用source上的loader函数(如果ol-source-vector上的url参数指定服务url,只会发送get请求<服务器可能有限制要post>,使用loader函数,可以自由控制)
javascript
<template>
  <div class="map-page">
    <h1>Vue3-OpenLayers - ArcGIS 要素查询(Loader 方式)</h1>
    <div class="controls">
      <button @click="queryArcGIS" :disabled="loading">
        {{ loading ? "加载中..." : "查询数据" }}
      </button>
      <span v-if="featureCount" class="feature-count"
        >找到 {{ featureCount }} 个要素</span
      >
    </div>

    <ol-map
      ref="mapRef"
      :loadTilesWhileAnimating="true"
      :loadTilesWhileInteracting="true"
      style="
        height: 600px;
        width: 100%;
        border: 2px solid #ddd;
        border-radius: 8px;
      "
    >
      <ol-view
        ref="viewRef"
        :center="center"
        :zoom="10"
        :projection="projection"
      />

      <ol-tile-layer>
        <ol-source-xyz
          url="https://sampleserver6.arcgisonline.com/arcgis/rest/services/MtBaldy_BaseMap/MapServer/tile/{z}/{y}/{x}"
          attributions="ArcGIS"
          :projection="projection"
          :tileGrid="tileGrid"
        />
      </ol-tile-layer>

      <ol-vector-layer>
        <ol-source-vector ref="vectorSourceRef" :loader="loaderFunction">
          <ol-style>
            <ol-style-stroke color="#FF0000" :width="2" />
            <ol-style-fill color="rgba(255, 0, 0, 0.1)" />
          </ol-style>
        </ol-source-vector>
      </ol-vector-layer>
    </ol-map>

    <div v-if="error" class="error">{{ error }}</div>
  </div>
</template>

<script setup lang="ts">
import { ref } from "vue";
import axios from "axios";
import { EsriJSON } from "ol/format";
import TileGrid from "ol/tilegrid/TileGrid";
import type VectorSource from "ol/source/Vector";
import type { Extent } from "ol/extent";
import { register } from "ol/proj/proj4";
import proj4 from "proj4";

// 注册 EPSG:32611 投影
proj4.defs("EPSG:32611", "+proj=utm +zone=11 +datum=WGS84 +units=m +no_defs");
register(proj4);

// 从 MapServer 获取的 resolutions
const resolutions = [
  4233.341800016934, 2116.670900008467, 1058.3354500042335, 529.1677250021168,
  264.5838625010584, 132.2919312505292, 66.1459656252646, 33.0729828126323,
  16.53649140631615, 8.268245703158074, 4.134122851579037, 2.0670614257895186,
  1.0335307128947593,
];

// 创建 TileGrid
const tileGrid = new TileGrid({
  origin: [-5120900, 9998100],
  resolutions: resolutions,
  tileSize: [256, 256],
});

const projection = "EPSG:32611";
const center = ref([457000, 3796000]); // UTM zone 11N 坐标 (MtBaldy 区域)
const loading = ref(false);
const featureCount = ref(0);
const error = ref("");
const vectorSourceRef = ref<{ source: VectorSource }>();
const viewRef = ref();
const mapRef = ref();

// Loader 函数:请求要素信息并添加到源中
const loaderFunction = async (
  extent: Extent,
  resolution: number,
  projection: string,
  success: () => void
) => {
  loading.value = true;
  error.value = "";

  try {
    const formData = new FormData();
    formData.append("f", "pjson");
    formData.append("where", "1=1");
    formData.append("returnGeometry", "true");
    formData.append("outFields", "*");
    formData.append("spatialRel", "esriSpatialRelIntersects");
    formData.append("inSR", "32611");

    const response = await axios.post(
      "https://sampleserver6.arcgisonline.com/arcgis/rest/services/MtBaldy_BaseMap/MapServer/0/query",
      formData
    );

    const format = new EsriJSON();
    const features = format.readFeatures(response.data, {
      featureProjection: "EPSG:32611",
    });

    const source = vectorSourceRef.value?.source;
    if (source) {
      source.clear();
      source.addFeatures(features);
    }

    featureCount.value = features.length;

    // Zoom to features extent
    if (features.length > 0 && source) {
      const extent = source.getExtent();
      const view = viewRef.value?.view;
      if (view && extent) {
        view.fit(extent, { padding: [50, 50, 50, 50], duration: 1000 });
      }
    }

    success();
  } catch (err: any) {
    error.value = "查询失败: " + (err.message || "未知错误");
    console.error("Query error:", err);
  } finally {
    loading.value = false;
  }
};

// Query ArcGIS REST API - 触发 loader
const queryArcGIS = () => {
  const source = vectorSourceRef.value?.source;
  if (source) {
    source.refresh();
  }
};
</script>

<style scoped>
.map-page {
  padding: 20px;
}

h1 {
  margin-bottom: 20px;
  color: #333;
}

.controls {
  margin-bottom: 15px;
  display: flex;
  align-items: center;
  gap: 15px;
}

.controls button {
  padding: 10px 20px;
  background-color: #42b983;
  color: white;
  border: none;
  border-radius: 4px;
  cursor: pointer;
  font-size: 14px;
  transition: background-color 0.3s;
}

.controls button:hover:not(:disabled) {
  background-color: #3aa876;
}

.controls button:disabled {
  opacity: 0.6;
  cursor: not-allowed;
}

.feature-count {
  color: #666;
  font-size: 14px;
}

.error {
  margin-top: 10px;
  padding: 10px;
  background-color: #fee;
  color: #c33;
  border-radius: 4px;
}
</style>
当然,为了性能,layer也可以使用ol-webgl-vector-layer,但是这样需要在ol-webgl-vector-layer上绑定styles来控制样式,styles需要使用
{
'stroke-width': 5,
'stroke-color': 'rgba(255,128,128,1)',
'fill-color': '#0000ff40'
}这样的形式绑定