单变量比例分布
条形图、堆叠条形图、并排条形图可以用来表现比例以及分组内的比例。 饼图经常用来表现单个分组方式的各组比例。
ggplot2没有专门的饼图函数, 可以用geom_col()与coord_polar()配合
R
library(ggplot2)
library(ggridges)
library(dplyr)
library(GGally)

iris = read.csv('../../seaborn-data/iris.csv')
tips = read.csv('../../seaborn-data/tips.csv')Attaching package: 'dplyr'
The following objects are masked from 'package:stats':
filter, lag
The following objects are masked from 'package:base':
intersect, setdiff, setequal, union
R
tips_day_count <- tips |>
  select(day) |>
  count(day) |>
  mutate(ratio = n)

p <- ggplot(data = tips_day_count,mapping = aes(x = 1,y=ratio,fill=day))

p + geom_col() + coord_polar(theta = "y") +
  scale_x_continuous(name = NULL, breaks = NULL) +
  scale_y_continuous(name = NULL, breaks = NULL) +
  labs(fill = "Cut")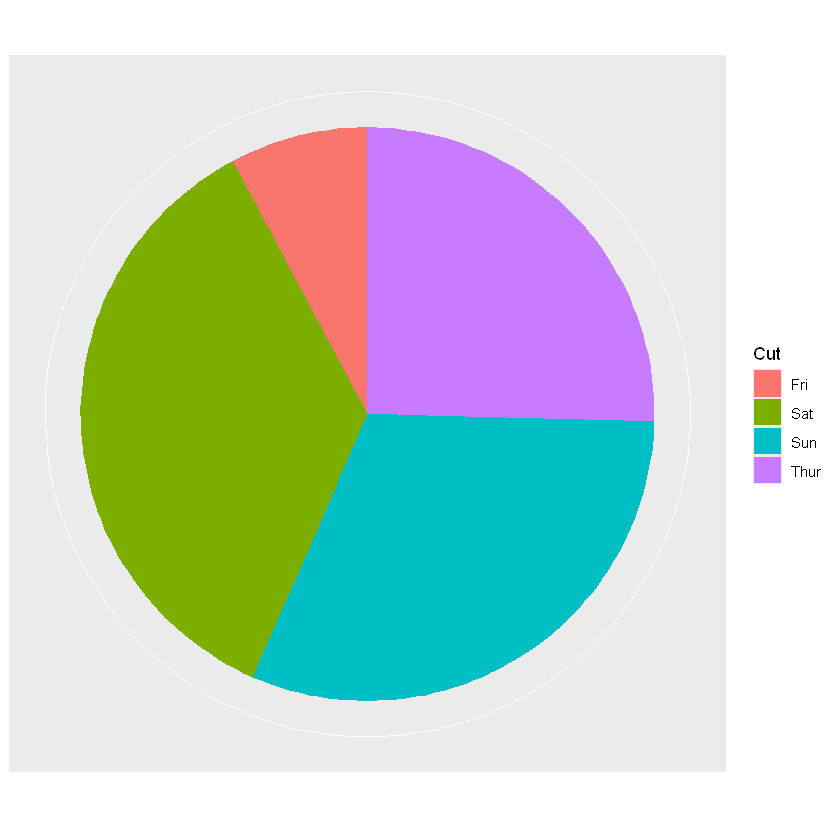
当然也可以用R自带的pie函数绘制饼图
R
piepercent = paste(round(100*tips_day_count$n/sum(tips_day_count$n)), "%")
pie(tips_day_count$n,labels=piepercent,col=rainbow(12))
legend("topright", tips_day_count$day, cex=0.8, fill=rainbow(12))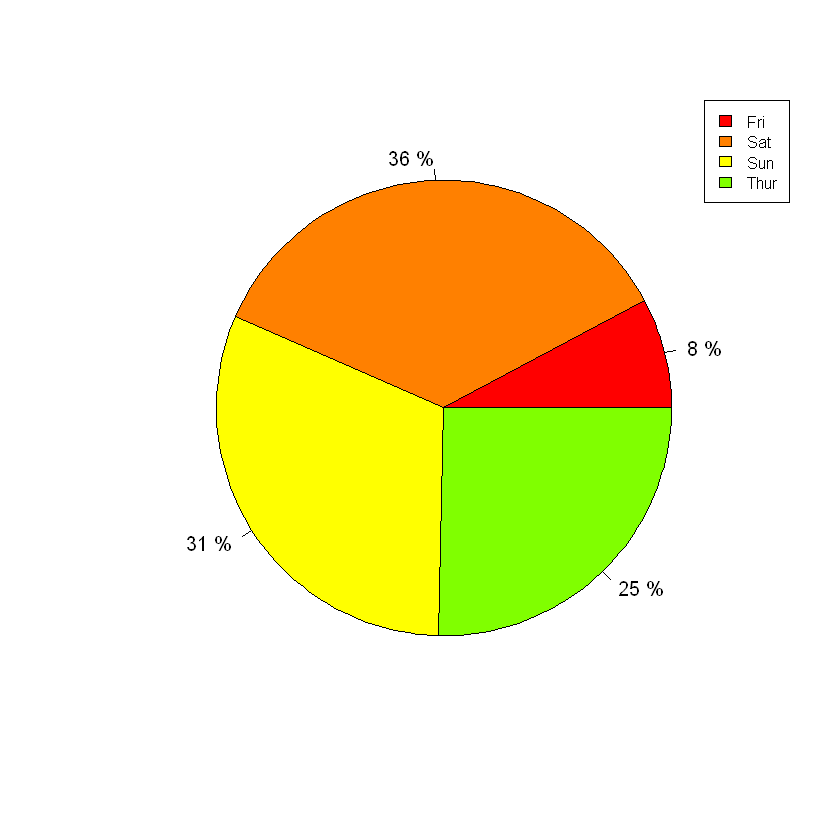
再粗糙点,直接用geom_col(postion='stack),也能达到饼状图的表达效果
R
p + geom_col(position = 'stack')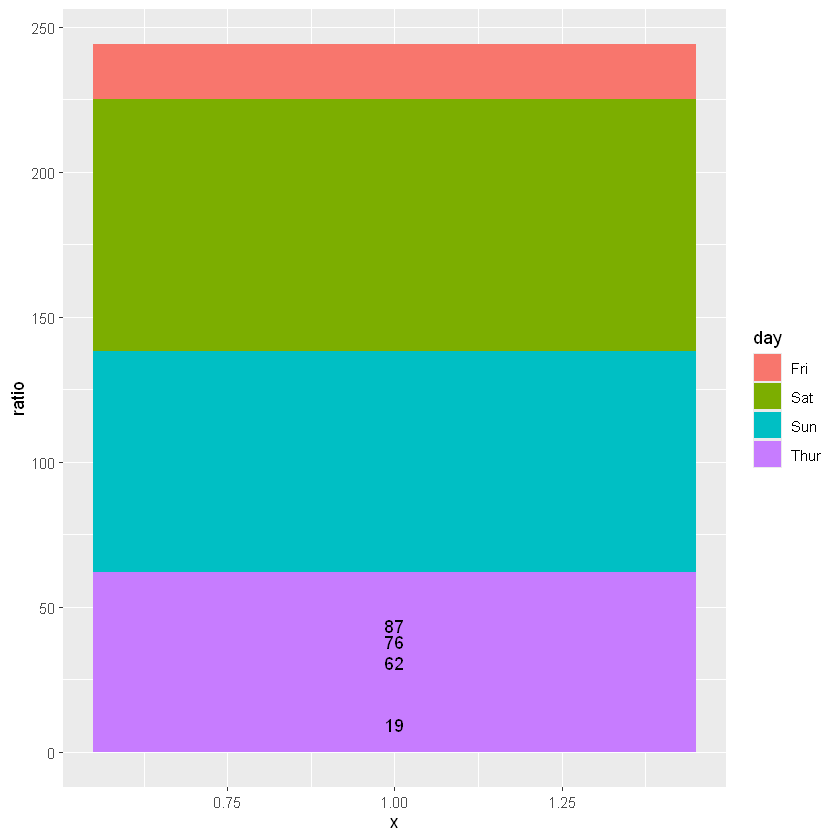
有时需要比较不同组的某个变量的比例分布。
R
ggplot(data = tips,mapping = aes(x = day,y=total_bill,fill=sex))+geom_col(position = 'dodge')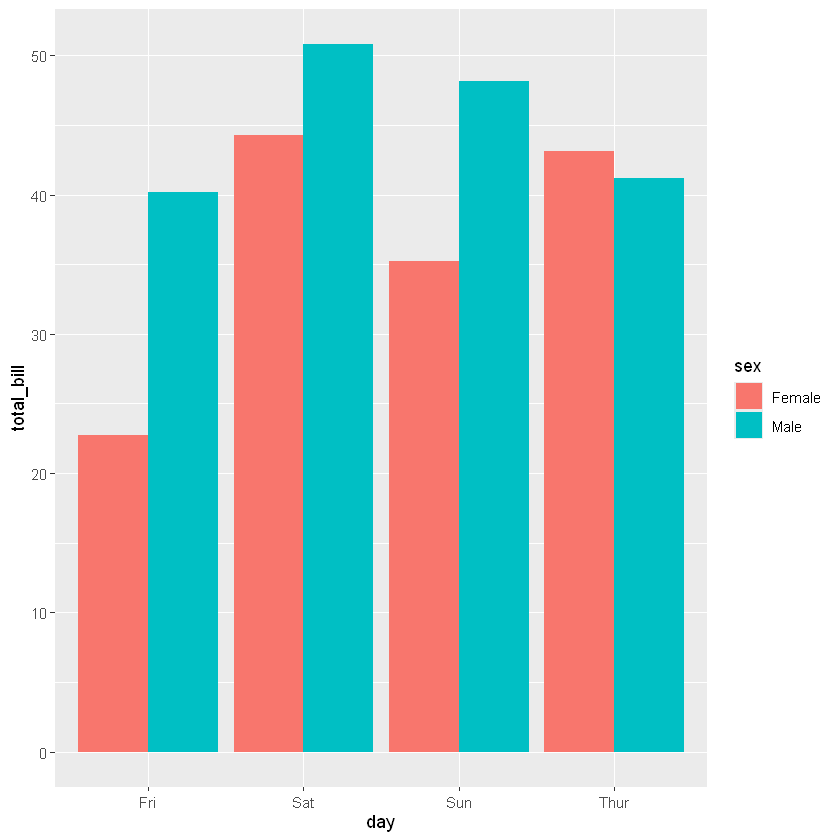
R
ggplot(data = tips,mapping = aes(x = total_bill,fill=day))+geom_density(position = 'fill')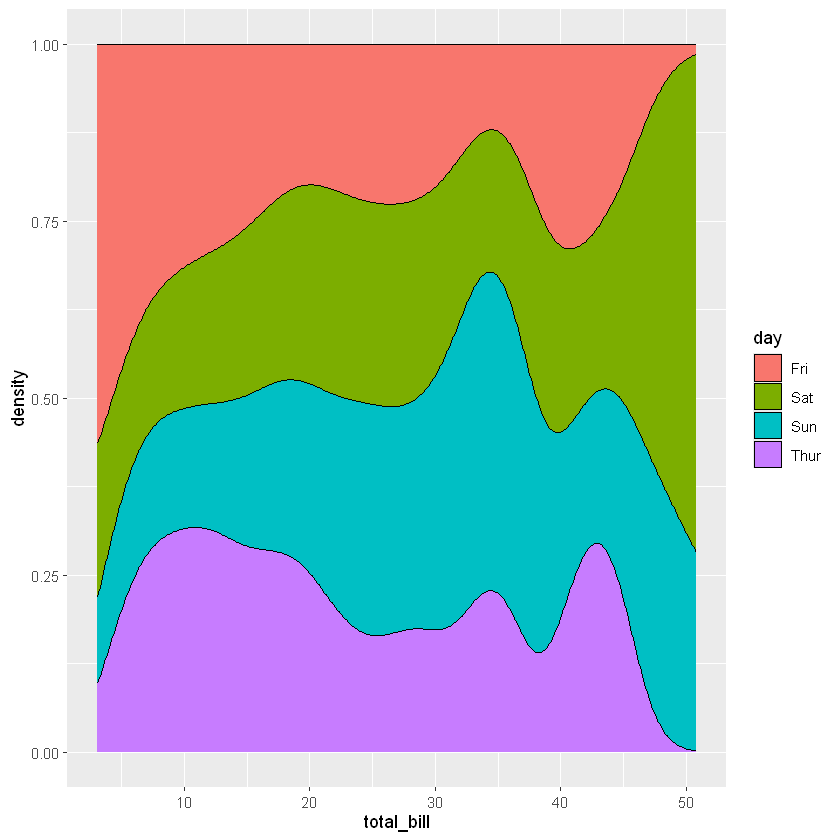
R
ggplot(data = tips,mapping = aes(x = total_bill,fill=day))+geom_density_line(alpha=0.5,mapping = aes(y=..count..))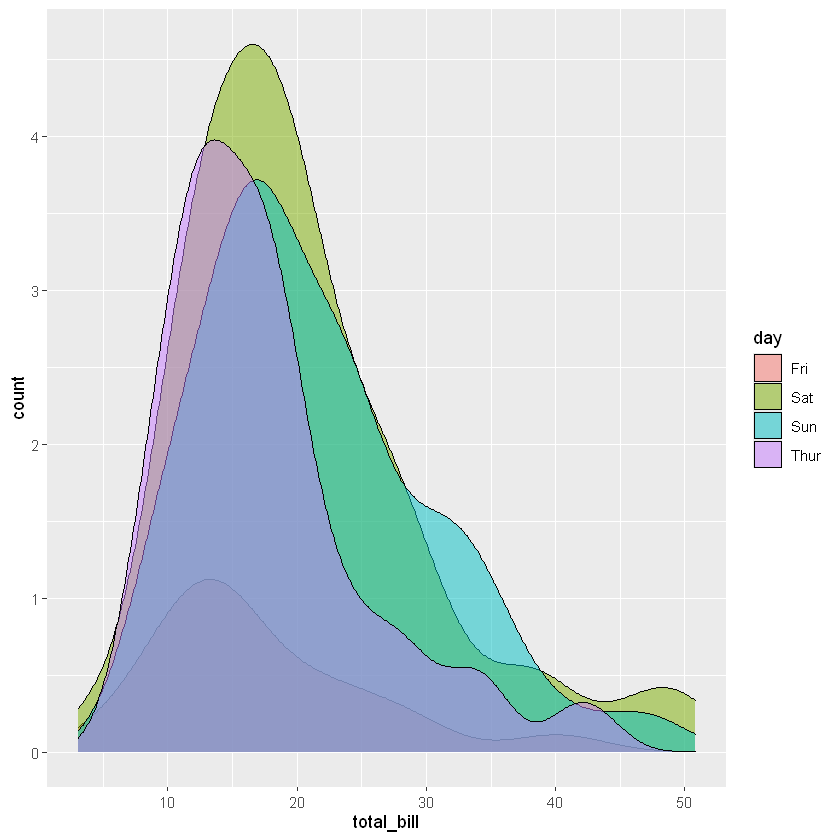
嵌套比例分布的比较
马赛克图是另外一种表现列联表频数的图形, 用色块面积表示每个交叉类的频数。 与堆叠条形图相比, 这里用了条形宽度而不是条形高度表示大类频数。
R
tips_day_count <- tips |>
  count(day,smoker)|>
  group_by(day) |>
  mutate(ratio = sum(n))

ggplot(tips_day_count,aes(y=n,x=day,width=ratio,fill=smoker))+
  geom_col(position = 'fill')+
  facet_grid(~day,scales = "free_x",space = "free_x")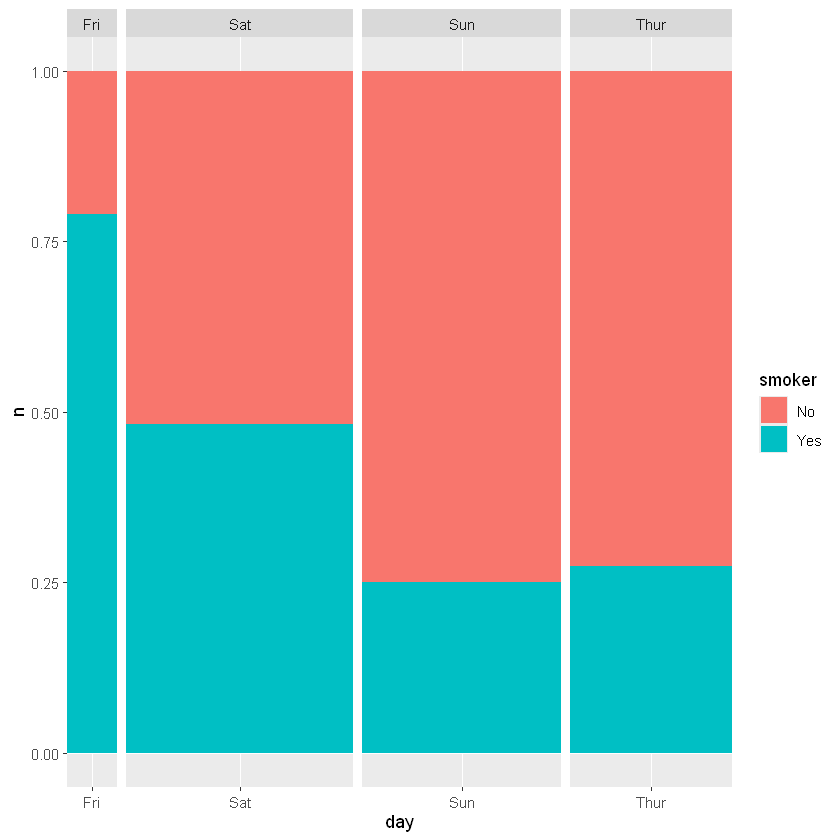
R
tips |>
  count(day,smoker)|>
  group_by(day) |>
  mutate(ratio = sum(n))
| day | smoker | n | ratio |
| <chr> | <chr> | <int> | <int> |
|---|---|---|---|
| Fri | No | 4 | 19 |
| Fri | Yes | 15 | 19 |
| Sat | No | 45 | 87 |
| Sat | Yes | 42 | 87 |
| Sun | No | 57 | 76 |
| Sun | Yes | 19 | 76 |
| Thur | No | 45 | 62 |
| Thur | Yes | 17 | 62 |
| [A grouped_df: 8 × 4] |