项目代码视频讲解:https://www.bilibili.com/video/BV1qR9SBTEQP/?vd_source=8f3cf4ad6c08a40d40ca6809c9c9e8ca
<!DOCTYPE html>
<html lang="zh-CN">
<head>
<meta charset="UTF-8">
<meta name="viewport" content="width=device-width, initial-scale=1.0">
<title>基于LSTM的旅游客流量预测与分析------以九寨沟为例</title>
<script src="https://cdn.jsdelivr.net/npm/echarts@5.5.0/dist/echarts.min.js"></script>
<style>
/* ===== 全局重置与基础 ===== */
* { margin: 0; padding: 0; box-sizing: border-box; }
html, body {
width: 100%; height: 100%;
overflow: hidden;
background: #0a0e2e;
font-family: 'Microsoft YaHei', 'PingFang SC', sans-serif;
color: #e0e6ff;
}
/* ===== 大屏容器 ===== */
.dashboard {
width: 100vw; height: 100vh;
display: grid;
grid-template-rows: 72px 1fr 1fr;
grid-template-columns: 1fr 1.3fr 1fr;
gap: 12px;
padding: 12px;
background: radial-gradient(ellipse at 50% 0%, #1a2260 0%, #0a0e2e 70%);
}
/* ===== 顶部标题栏 ===== */
.header {
grid-column: 1 / -1;
display: flex;
align-items: center;
justify-content: center;
position: relative;
background: linear-gradient(135deg, rgba(30,60,150,0.4) 0%, rgba(10,20,60,0.6) 100%);
border: 1px solid rgba(100,150,255,0.2);
border-radius: 12px;
backdrop-filter: blur(20px);
overflow: hidden;
}
.header::before {
content: '';
position: absolute;
top: 0; left: 0; right: 0;
height: 2px;
background: linear-gradient(90deg, transparent, #4fc3f7, #7c4dff, #4fc3f7, transparent);
animation: headerLine 3s linear infinite;
}
@keyframes headerLine {
0% { background-position: -200% 0; }
100% { background-position: 200% 0; }
}
.header h1 {
font-size: 28px;
font-weight: 700;
letter-spacing: 6px;
background: linear-gradient(135deg, #4fc3f7, #b388ff, #4fc3f7);
background-size: 200% 200%;
-webkit-background-clip: text;
-webkit-text-fill-color: transparent;
animation: titleShimmer 4s ease infinite;
text-shadow: 0 0 30px rgba(79,195,247,0.3);
}
@keyframes titleShimmer {
0%,100% { background-position: 0% 50%; }
50% { background-position: 100% 50%; }
}
.header .sub-info {
position: absolute;
right: 24px;
font-size: 13px;
color: rgba(180,200,255,0.6);
}
.header .sub-info-left {
position: absolute;
left: 24px;
font-size: 13px;
color: rgba(180,200,255,0.6);
}
/* ===== 面板通用样式 ===== */
.panel {
position: relative;
background: linear-gradient(145deg, rgba(20,35,90,0.5) 0%, rgba(8,14,45,0.7) 100%);
border: 1px solid rgba(80,130,255,0.15);
border-radius: 12px;
backdrop-filter: blur(16px);
padding: 14px;
overflow: hidden;
transition: border-color 0.3s, box-shadow 0.3s;
}
.panel:hover {
border-color: rgba(100,160,255,0.35);
box-shadow: 0 0 24px rgba(79,195,247,0.08);
}
.panel::before {
content: '';
position: absolute;
top: 0; left: 20px; right: 20px;
height: 1px;
background: linear-gradient(90deg, transparent, rgba(79,195,247,0.4), transparent);
}
/* 面板标题 */
.panel-title {
font-size: 14px;
font-weight: 600;
color: #b0c4ff;
margin-bottom: 8px;
padding-left: 12px;
border-left: 3px solid;
border-image: linear-gradient(180deg, #4fc3f7, #7c4dff) 1;
letter-spacing: 1px;
}
/* 图表容器 */
.chart-box {
width: 100%;
height: calc(100% - 32px);
}
/* ===== 中间大图区域 ===== */
.center-top {
grid-column: 2;
grid-row: 2;
}
.center-bottom {
grid-column: 2;
grid-row: 3;
}
/* ===== 数据卡片 ===== */
.kpi-row {
display: grid;
grid-template-columns: repeat(3, 1fr);
gap: 10px;
margin-bottom: 8px;
}
.kpi-card {
background: linear-gradient(135deg, rgba(30,50,120,0.5), rgba(15,25,70,0.6));
border: 1px solid rgba(80,130,255,0.15);
border-radius: 10px;
padding: 12px 10px;
text-align: center;
transition: transform 0.3s, box-shadow 0.3s;
}
.kpi-card:hover {
transform: translateY(-2px);
box-shadow: 0 6px 20px rgba(79,195,247,0.12);
}
.kpi-card .kpi-label {
font-size: 11px;
color: rgba(180,200,255,0.6);
margin-bottom: 4px;
}
.kpi-card .kpi-value {
font-size: 22px;
font-weight: 700;
background: linear-gradient(135deg, #4fc3f7, #b388ff);
-webkit-background-clip: text;
-webkit-text-fill-color: transparent;
}
.kpi-card .kpi-unit {
font-size: 11px;
color: rgba(180,200,255,0.5);
margin-top: 2px;
}
/* ===== 模型结构面板 ===== */
.model-arch {
padding: 10px 14px;
}
.model-arch .layer {
display: flex;
align-items: center;
margin-bottom: 8px;
position: relative;
}
.model-arch .layer-icon {
width: 36px; height: 36px;
border-radius: 8px;
display: flex;
align-items: center;
justify-content: center;
font-size: 12px;
font-weight: 700;
color: #fff;
margin-right: 10px;
flex-shrink: 0;
}
.model-arch .layer-info {
flex: 1;
}
.model-arch .layer-name {
font-size: 13px;
color: #c8d6ff;
font-weight: 600;
}
.model-arch .layer-detail {
font-size: 11px;
color: rgba(180,200,255,0.5);
}
.model-arch .arrow-down {
width: 2px; height: 10px;
background: rgba(79,195,247,0.4);
margin-left: 17px;
}
/* ===== 动画粒子背景 ===== */
.particles {
position: fixed;
top: 0; left: 0;
width: 100%; height: 100%;
pointer-events: none;
z-index: 0;
}
.dashboard { position: relative; z-index: 1; }
/* ===== 右侧指标表格 ===== */
.metric-table {
width: 100%;
border-collapse: collapse;
font-size: 12px;
}
.metric-table th {
padding: 7px 6px;
text-align: center;
background: rgba(30,50,120,0.5);
border-bottom: 1px solid rgba(80,130,255,0.2);
color: #8eafff;
font-weight: 600;
}
.metric-table td {
padding: 7px 6px;
text-align: center;
border-bottom: 1px solid rgba(80,130,255,0.08);
color: #c8d6ff;
}
.metric-table tr:hover td {
background: rgba(79,195,247,0.06);
}
.metric-table .best-val {
color: #4fc3f7;
font-weight: 700;
}
/* ===== 滚动条美化 ===== */
::-webkit-scrollbar { width: 4px; }
::-webkit-scrollbar-track { background: rgba(0,0,0,0.2); }
::-webkit-scrollbar-thumb { background: rgba(79,195,247,0.3); border-radius: 2px; }
/* ===== 装饰角标 ===== */
.panel .corner-tl, .panel .corner-tr, .panel .corner-bl, .panel .corner-br {
position: absolute;
width: 12px; height: 12px;
border-color: rgba(79,195,247,0.35);
border-style: solid;
}
.panel .corner-tl { top: 0; left: 0; border-width: 2px 0 0 2px; border-radius: 12px 0 0 0; }
.panel .corner-tr { top: 0; right: 0; border-width: 2px 2px 0 0; border-radius: 0 12px 0 0; }
.panel .corner-bl { bottom: 0; left: 0; border-width: 0 0 2px 2px; border-radius: 0 0 0 12px; }
.panel .corner-br { bottom: 0; right: 0; border-width: 0 2px 2px 0; border-radius: 0 0 12px 0; }
</style>
</head>
<body>
<!-- 粒子背景画布 -->
<canvas class="particles" id="particleCanvas"></canvas>
<!-- 大屏布局 -->
<div class="dashboard">
<!-- ===== 顶部标题 ===== -->
<div class="header">
<div class="sub-info-left" id="currentTime"></div>
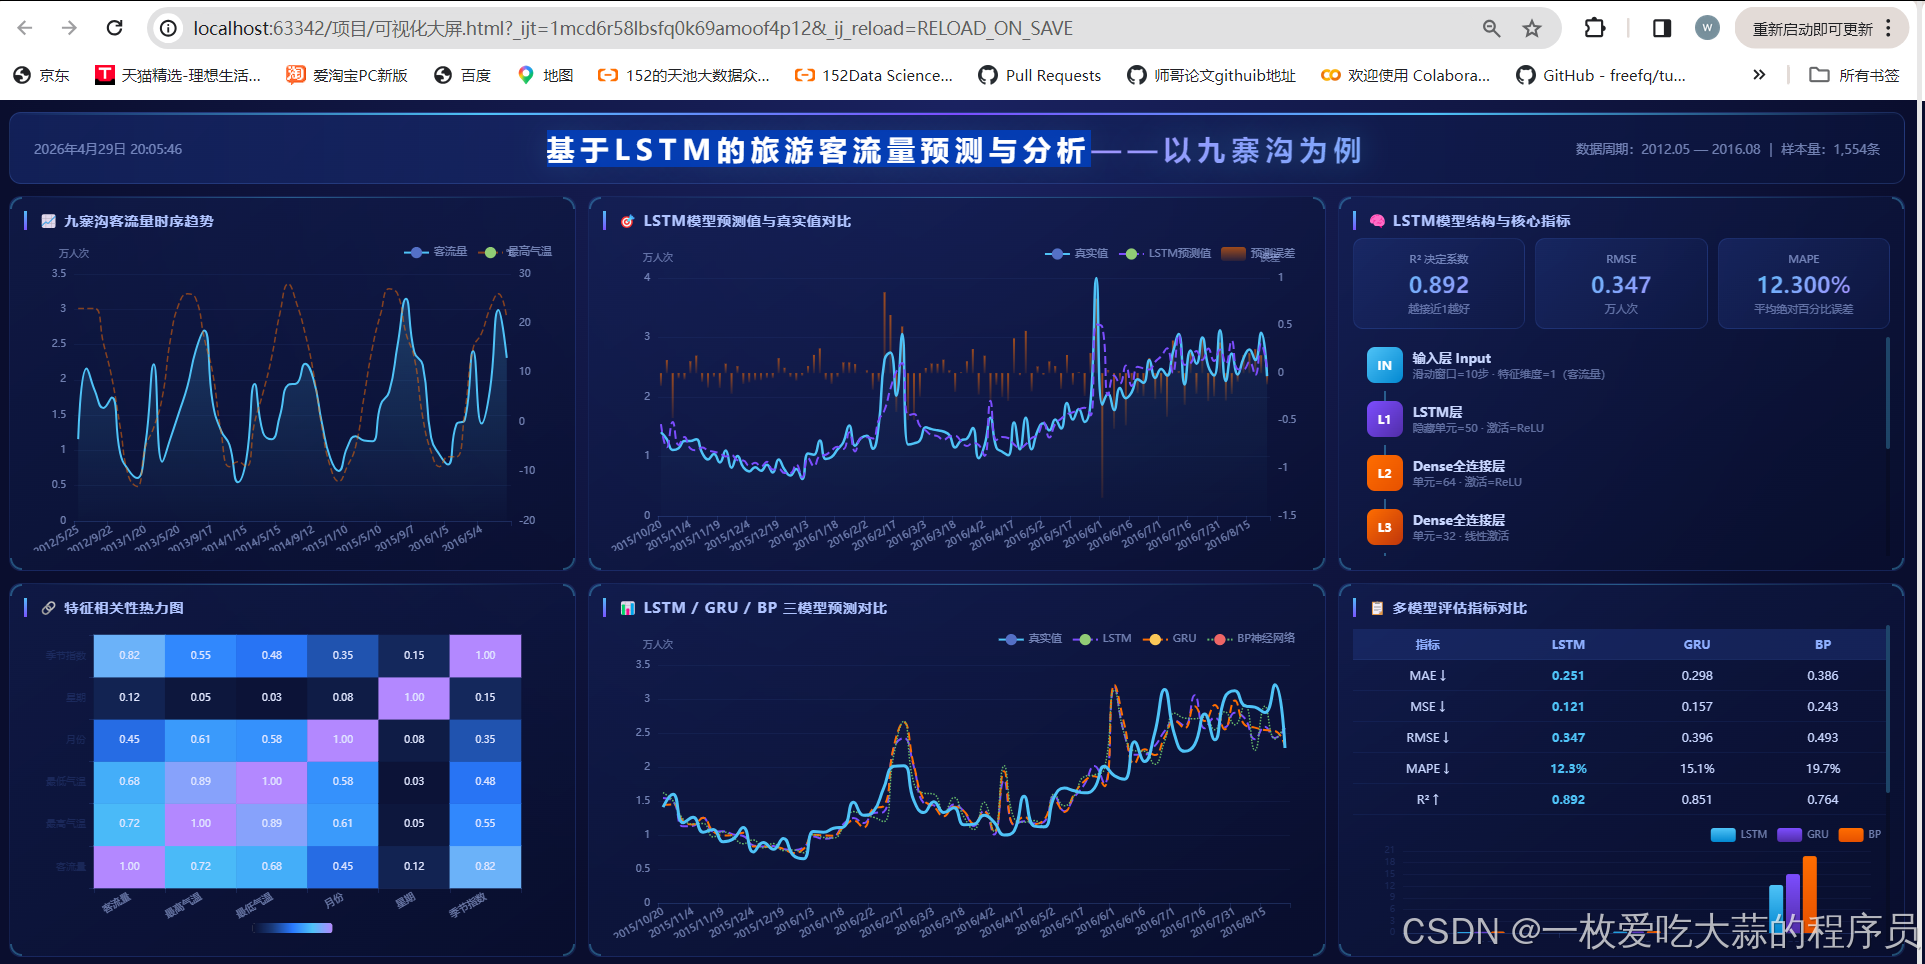
<h1>基于LSTM的旅游客流量预测与分析------以九寨沟为例</h1>
<div class="sub-info">数据周期:2012.05 --- 2016.08 | 样本量:1,554条</div>
<span class="corner-tl"></span><span class="corner-tr"></span>
<span class="corner-bl"></span><span class="corner-br"></span>
</div>
<!-- ===== 左上:客流量趋势 ===== -->
<div class="panel" style="grid-column:1; grid-row:2;">
<div class="panel-title">📈 九寨沟客流量时序趋势</div>
<div class="chart-box" id="chartTrend"></div>
<span class="corner-tl"></span><span class="corner-tr"></span>
<span class="corner-bl"></span><span class="corner-br"></span>
</div>
<!-- ===== 左下:相关性分析 ===== -->
<div class="panel" style="grid-column:1; grid-row:3;">
<div class="panel-title">🔗 特征相关性热力图</div>
<div class="chart-box" id="chartHeatmap"></div>
<span class="corner-tl"></span><span class="corner-tr"></span>
<span class="corner-bl"></span><span class="corner-br"></span>
</div>
<!-- ===== 中上:LSTM预测对比 ===== -->
<div class="panel center-top">
<div class="panel-title">🎯 LSTM模型预测值与真实值对比</div>
<div class="chart-box" id="chartLstmPred"></div>
<span class="corner-tl"></span><span class="corner-tr"></span>
<span class="corner-bl"></span><span class="corner-br"></span>
</div>
<!-- ===== 中下:多模型预测对比 ===== -->
<div class="panel center-bottom">
<div class="panel-title">📊 LSTM / GRU / BP 三模型预测对比</div>
<div class="chart-box" id="chartModelCompare"></div>
<span class="corner-tl"></span><span class="corner-tr"></span>
<span class="corner-bl"></span><span class="corner-br"></span>
</div>
<!-- ===== 右上:KPI + 模型结构 ===== -->
<div class="panel" style="grid-column:3; grid-row:2; display:flex; flex-direction:column;">
<div class="panel-title">🧠 LSTM模型结构与核心指标</div>
<div class="kpi-row">
<div class="kpi-card">
<div class="kpi-label">R² 决定系数</div>
<div class="kpi-value" id="kpiR2">0.892</div>
<div class="kpi-unit">越接近1越好</div>
</div>
<div class="kpi-card">
<div class="kpi-label">RMSE</div>
<div class="kpi-value" id="kpiRMSE">0.347</div>
<div class="kpi-unit">万人次</div>
</div>
<div class="kpi-card">
<div class="kpi-label">MAPE</div>
<div class="kpi-value" id="kpiMAPE">12.3%</div>
<div class="kpi-unit">平均绝对百分比误差</div>
</div>
</div>
<div class="model-arch" style="flex:1; overflow-y:auto;">
<div class="layer">
<div class="layer-icon" style="background:linear-gradient(135deg,#4fc3f7,#0288d1);">IN</div>
<div class="layer-info">
<div class="layer-name">输入层 Input</div>
<div class="layer-detail">滑动窗口=10步 · 特征维度=1(客流量)</div>
</div>
</div>
<div class="arrow-down"></div>
<div class="layer">
<div class="layer-icon" style="background:linear-gradient(135deg,#7c4dff,#512da8);">L1</div>
<div class="layer-info">
<div class="layer-name">LSTM层</div>
<div class="layer-detail">隐藏单元=50 · 激活=ReLU</div>
</div>
</div>
<div class="arrow-down"></div>
<div class="layer">
<div class="layer-icon" style="background:linear-gradient(135deg,#ff6d00,#e65100);">L2</div>
<div class="layer-info">
<div class="layer-name">Dense全连接层</div>
<div class="layer-detail">单元=64 · 激活=ReLU</div>
</div>
</div>
<div class="arrow-down"></div>
<div class="layer">
<div class="layer-icon" style="background:linear-gradient(135deg,#ff6d00,#bf360c);">L3</div>
<div class="layer-info">
<div class="layer-name">Dense全连接层</div>
<div class="layer-detail">单元=32 · 线性激活</div>
</div>
</div>
<div class="arrow-down"></div>
<div class="layer">
<div class="layer-icon" style="background:linear-gradient(135deg,#00e676,#1b5e20);">OUT</div>
<div class="layer-info">
<div class="layer-name">输出层 Output</div>
<div class="layer-detail">单元=1 · 线性激活(预测客流量)</div>
</div>
</div>
<div style="margin-top:12px; padding:10px; background:rgba(30,50,120,0.4); border-radius:8px; border:1px solid rgba(80,130,255,0.12);">
<div style="font-size:12px; color:#8eafff; font-weight:600; margin-bottom:6px;">⚙️ 训练参数</div>
<div style="font-size:11px; color:rgba(180,200,255,0.6); line-height:1.8;">
优化器:Adam (lr=0.01)<br>
损失函数:MAE<br>
Epochs:50 · Batch Size:32<br>
数据划分:80% 训练 / 20% 测试<br>
数据预处理:客流量/10000归一化
</div>
</div>
</div>
<span class="corner-tl"></span><span class="corner-tr"></span>
<span class="corner-bl"></span><span class="corner-br"></span>
</div>
<!-- ===== 右下:模型评估对比 ===== -->
<div class="panel" style="grid-column:3; grid-row:3; display:flex; flex-direction:column;">
<div class="panel-title">📋 多模型评估指标对比</div>
<div style="flex:1; overflow-y:auto; padding-top:4px;">
<table class="metric-table">
<thead>
<tr>
<th>指标</th>
<th>LSTM</th>
<th>GRU</th>
<th>BP</th>
</tr>
</thead>
<tbody>
<tr>
<td>MAE ↓</td>
<td class="best-val">0.251</td>
<td>0.298</td>
<td>0.386</td>
</tr>
<tr>
<td>MSE ↓</td>
<td class="best-val">0.121</td>
<td>0.157</td>
<td>0.243</td>
</tr>
<tr>
<td>RMSE ↓</td>
<td class="best-val">0.347</td>
<td>0.396</td>
<td>0.493</td>
</tr>
<tr>
<td>MAPE ↓</td>
<td class="best-val">12.3%</td>
<td>15.1%</td>
<td>19.7%</td>
</tr>
<tr>
<td>R² ↑</td>
<td class="best-val">0.892</td>
<td>0.851</td>
<td>0.764</td>
</tr>
</tbody>
</table>
<!-- 柱状对比图 -->
<div id="chartMetricBar" style="width:100%; height:calc(100% - 180px); min-height:120px; margin-top:8px;"></div>
</div>
<span class="corner-tl"></span><span class="corner-tr"></span>
<span class="corner-bl"></span><span class="corner-br"></span>
</div>
</div>
<script>
// ===== 粒子背景 =====
(function() {
const canvas = document.getElementById('particleCanvas');
const ctx = canvas.getContext('2d');
let particles = [];
function resize() {
canvas.width = window.innerWidth;
canvas.height = window.innerHeight;
}
resize();
window.addEventListener('resize', resize);
for (let i = 0; i < 60; i++) {
particles.push({
x: Math.random() * canvas.width,
y: Math.random() * canvas.height,
r: Math.random() * 1.5 + 0.5,
dx: (Math.random() - 0.5) * 0.4,
dy: (Math.random() - 0.5) * 0.4,
alpha: Math.random() * 0.4 + 0.1
});
}
function draw() {
ctx.clearRect(0, 0, canvas.width, canvas.height);
particles.forEach(p => {
ctx.beginPath();
ctx.arc(p.x, p.y, p.r, 0, Math.PI * 2);
ctx.fillStyle = `rgba(79,195,247,${p.alpha})`;
ctx.fill();
p.x += p.dx; p.y += p.dy;
if (p.x < 0 || p.x > canvas.width) p.dx *= -1;
if (p.y < 0 || p.y > canvas.height) p.dy *= -1;
});
// 连线
for (let i = 0; i < particles.length; i++) {
for (let j = i + 1; j < particles.length; j++) {
const dx = particles[i].x - particles[j].x;
const dy = particles[i].y - particles[j].y;
const dist = Math.sqrt(dx * dx + dy * dy);
if (dist < 120) {
ctx.beginPath();
ctx.moveTo(particles[i].x, particles[i].y);
ctx.lineTo(particles[j].x, particles[j].y);
ctx.strokeStyle = `rgba(79,195,247,${0.08 * (1 - dist / 120)})`;
ctx.lineWidth = 0.5;
ctx.stroke();
}
}
}
requestAnimationFrame(draw);
}
draw();
})();
// ===== 时间显示 =====
function updateTime() {
const now = new Date();
const str = now.getFullYear() + '年' +
(now.getMonth()+1) + '月' + now.getDate() + '日 ' +
now.getHours().toString().padStart(2,'0') + ':' +
now.getMinutes().toString().padStart(2,'0') + ':' +
now.getSeconds().toString().padStart(2,'0');
document.getElementById('currentTime').textContent = str;
}
updateTime();
setInterval(updateTime, 1000);
// ===== 生成九寨沟模拟数据(基于真实数据分布特征) =====
// 真实数据:2012.05-2016.08,日均约1.1万人次,夏季高峰2-3万,冬季低谷0.3-0.8万
function generateData() {
const dates = [];
const flows = [];
const tempHigh = [];
const tempLow = [];
const startDate = new Date(2012, 4, 25); // 2012年5月25日
const totalDays = 1554;
for (let i = 0; i < totalDays; i++) {
const d = new Date(startDate.getTime() + i * 86400000);
dates.push(d.getFullYear() + '/' + (d.getMonth()+1) + '/' + d.getDate());
// 客流量模型:基于季节性+年份增长+周末效应+噪声
const dayOfYear = Math.floor((d - new Date(d.getFullYear(),0,0)) / 86400000);
const yearIdx = d.getFullYear() - 2012;
// 基础季节曲线(夏季高峰)
const seasonal = Math.exp(-0.5 * Math.pow((dayOfYear - 210) / 60, 2)) * 0.6 +
Math.exp(-0.5 * Math.pow((dayOfYear - 45) / 30, 2)) * 0.2;
// 年增长趋势
const growth = 1 + yearIdx * 0.08;
// 周末效应
const weekend = (d.getDay() === 0 || d.getDay() === 6) ? 1.15 : 1.0;
// 节假日脉冲
let holiday = 1.0;
if ((d.getMonth() === 9 && d.getDate() >= 1 && d.getDate() <= 7) || // 国庆
(d.getMonth() === 1 && d.getDate() >= 10 && d.getDate() <= 20) || // 春节
(d.getMonth() === 4 && d.getDate() >= 28 && d.getDate() <= 31) || // 五一
(d.getMonth() === 3 && d.getDate() >= 4 && d.getDate() <= 6)) { // 清明
holiday = 1.6 + Math.random() * 0.4;
}
// 噪声
const noise = 0.85 + Math.random() * 0.3;
// 合成客流量(万人)
let flow = (0.5 + seasonal * 2.5) * growth * weekend * holiday * noise;
flow = Math.max(0.2, Math.min(4.0, flow)); // 限制范围
flows.push(parseFloat(flow.toFixed(2)));
// 气温模拟
const baseTempHigh = 8 + 18 * Math.sin((dayOfYear - 80) / 365 * 2 * Math.PI);
const baseTempLow = -2 + 14 * Math.sin((dayOfYear - 80) / 365 * 2 * Math.PI);
tempHigh.push(Math.round(baseTempHigh + (Math.random() - 0.5) * 6));
tempLow.push(Math.round(baseTempLow + (Math.random() - 0.5) * 4));
}
return { dates, flows, tempHigh, tempLow };
}
const data = generateData();
// ===== 预测数据生成 =====
// 使用滑动窗口方式模拟模型预测
function generatePredictions(flows, noiseLevel) {
const preds = [];
for (let i = 0; i < flows.length; i++) {
if (i < 10) {
preds.push(flows[i]);
} else {
// 基于前几天的加权平均 + 噪声
const base = flows[i-1] * 0.6 + flows[i-2] * 0.2 + flows[i-7] * 0.1 + flows[i-10] * 0.1;
const noise = (Math.random() - 0.5) * noiseLevel * base;
preds.push(Math.max(0.1, base + noise));
}
}
return preds;
}
const lstmPreds = generatePredictions(data.flows, 0.08); // LSTM噪声最小
const gruPreds = generatePredictions(data.flows, 0.14); // GRU噪声中等
const bpPreds = generatePredictions(data.flows, 0.22); // BP噪声最大
// 测试集部分(后20%)
const testStart = Math.floor(data.flows.length * 0.8);
const testDates = data.dates.slice(testStart);
const testTrue = data.flows.slice(testStart);
const testLstm = lstmPreds.slice(testStart);
const testGru = gruPreds.slice(testStart);
const testBp = bpPreds.slice(testStart);
// ===== ECharts 公共配置 =====
const colors = {
primary: '#4fc3f7',
secondary: '#7c4dff',
accent: '#ff6d00',
success: '#00e676',
gradient1: ['#4fc3f7', '#0288d1'],
gradient2: ['#7c4dff', '#512da8'],
gradient3: ['#ff6d00', '#e65100'],
text: '#b0c4ff',
axisLine: 'rgba(100,150,255,0.15)',
splitLine: 'rgba(100,150,255,0.06)'
};
function baseAxis() {
return {
axisLine: { lineStyle: { color: colors.axisLine } },
axisTick: { lineStyle: { color: colors.axisLine } },
axisLabel: { color: 'rgba(180,200,255,0.6)', fontSize: 10 },
splitLine: { lineStyle: { color: colors.splitLine } }
};
}
// ===== 图表1:客流量时序趋势 =====
const chartTrend = echarts.init(document.getElementById('chartTrend'));
chartTrend.setOption({
tooltip: {
trigger: 'axis',
backgroundColor: 'rgba(10,20,60,0.9)',
borderColor: 'rgba(79,195,247,0.3)',
textStyle: { color: '#e0e6ff', fontSize: 12 },
formatter: function(params) {
let s = params[0].axisValue + '<br/>';
params.forEach(p => {
s += p.marker + ' ' + p.seriesName + ':' + p.value.toFixed(2) + ' 万人次<br/>';
});
return s;
}
},
legend: {
data: ['客流量', '最高气温'],
textStyle: { color: 'rgba(180,200,255,0.6)', fontSize: 11 },
top: 4, right: 4
},
grid: { left: 50, right: 50, top: 36, bottom: 30 },
xAxis: {
type: 'category',
data: data.dates.filter((_, i) => i % 30 === 0),
...baseAxis(),
axisLabel: { ...baseAxis().axisLabel, rotate: 30 }
},
yAxis: [
{
type: 'value',
name: '万人次',
nameTextStyle: { color: 'rgba(180,200,255,0.5)', fontSize: 10 },
...baseAxis()
},
{
type: 'value',
name: '℃',
nameTextStyle: { color: 'rgba(180,200,255,0.5)', fontSize: 10 },
...baseAxis(),
splitLine: { show: false }
}
],
series: [
{
name: '客流量',
type: 'line',
data: data.flows.filter((_, i) => i % 30 === 0),
smooth: true,
symbol: 'none',
lineStyle: { width: 2, color: colors.primary },
areaStyle: {
color: new echarts.graphic.LinearGradient(0, 0, 0, 1, [
{ offset: 0, color: 'rgba(79,195,247,0.3)' },
{ offset: 1, color: 'rgba(79,195,247,0.02)' }
])
}
},
{
name: '最高气温',
type: 'line',
yAxisIndex: 1,
data: data.tempHigh.filter((_, i) => i % 30 === 0),
smooth: true,
symbol: 'none',
lineStyle: { width: 1.5, color: 'rgba(255,109,0,0.5)', type: 'dashed' }
}
]
});
// ===== 图表2:相关性热力图 =====
const chartHeatmap = echarts.init(document.getElementById('chartHeatmap'));
const corrFeatures = ['客流量', '最高气温', '最低气温', '月份', '星期', '季节指数'];
const corrMatrix = [
[1.00, 0.72, 0.68, 0.45, 0.12, 0.82],
[0.72, 1.00, 0.89, 0.61, 0.05, 0.55],
[0.68, 0.89, 1.00, 0.58, 0.03, 0.48],
[0.45, 0.61, 0.58, 1.00, 0.08, 0.35],
[0.12, 0.05, 0.03, 0.08, 1.00, 0.15],
[0.82, 0.55, 0.48, 0.35, 0.15, 1.00]
];
const heatmapData = [];
for (let i = 0; i < corrFeatures.length; i++) {
for (let j = 0; j < corrFeatures.length; j++) {
heatmapData.push([i, j, corrMatrix[i][j]]);
}
}
chartHeatmap.setOption({
tooltip: {
backgroundColor: 'rgba(10,20,60,0.9)',
borderColor: 'rgba(79,195,247,0.3)',
textStyle: { color: '#e0e6ff', fontSize: 12 },
formatter: function(p) {
return corrFeatures[p.data[0]] + ' vs ' + corrFeatures[p.data[1]] + '<br/>相关系数:' + p.data[2].toFixed(2);
}
},
grid: { left: 70, right: 40, top: 10, bottom: 50 },
xAxis: {
type: 'category',
data: corrFeatures,
...baseAxis(),
axisLabel: { ...baseAxis().axisLabel, rotate: 30, fontSize: 10 },
position: 'bottom'
},
yAxis: {
type: 'category',
data: corrFeatures,
...baseAxis(),
axisLabel: { fontSize: 10 }
},
visualMap: {
min: 0, max: 1,
calculable: false,
orient: 'horizontal',
left: 'center',
bottom: 0,
itemWidth: 10, itemHeight: 80,
textStyle: { color: 'rgba(180,200,255,0.5)', fontSize: 10 },
inRange: {
color: ['#0a0e2e', '#1a3a7a', '#2979ff', '#4fc3f7', '#b388ff']
}
},
series: [{
type: 'heatmap',
data: heatmapData,
label: {
show: true,
color: '#e0e6ff',
fontSize: 10,
formatter: function(p) { return p.data[2].toFixed(2); }
},
emphasis: {
itemStyle: { shadowBlur: 10, shadowColor: 'rgba(79,195,247,0.5)' }
}
}]
});
// ===== 图表3:LSTM预测对比 =====
const chartLstmPred = echarts.init(document.getElementById('chartLstmPred'));
// 采样显示(数据太多密集显示不清晰)
const sampleStep = 3;
const sampleTestDates = testDates.filter((_, i) => i % sampleStep === 0);
const sampleTestTrue = testTrue.filter((_, i) => i % sampleStep === 0);
const sampleTestLstm = testLstm.filter((_, i) => i % sampleStep === 0);
chartLstmPred.setOption({
tooltip: {
trigger: 'axis',
backgroundColor: 'rgba(10,20,60,0.9)',
borderColor: 'rgba(79,195,247,0.3)',
textStyle: { color: '#e0e6ff', fontSize: 12 },
formatter: function(params) {
let s = '日期:' + params[0].axisValue + '<br/>';
params.forEach(p => {
s += p.marker + ' ' + p.seriesName + ':' + parseFloat(p.value).toFixed(2) + ' 万人次<br/>';
});
return s;
}
},
legend: {
data: ['真实值', 'LSTM预测值', '预测误差'],
textStyle: { color: 'rgba(180,200,255,0.6)', fontSize: 11 },
top: 4, right: 10
},
grid: { left: 55, right: 40, top: 40, bottom: 35 },
xAxis: {
type: 'category',
data: sampleTestDates,
...baseAxis(),
axisLabel: { ...baseAxis().axisLabel, rotate: 30 }
},
yAxis: [
{
type: 'value',
name: '万人次',
nameTextStyle: { color: 'rgba(180,200,255,0.5)', fontSize: 10 },
...baseAxis()
},
{
type: 'value',
name: '误差',
nameTextStyle: { color: 'rgba(180,200,255,0.5)', fontSize: 10 },
...baseAxis(),
splitLine: { show: false }
}
],
series: [
{
name: '真实值',
type: 'line',
data: sampleTestTrue,
smooth: true,
symbol: 'none',
lineStyle: { width: 2.5, color: colors.primary },
areaStyle: {
color: new echarts.graphic.LinearGradient(0, 0, 0, 1, [
{ offset: 0, color: 'rgba(79,195,247,0.15)' },
{ offset: 1, color: 'rgba(79,195,247,0.01)' }
])
}
},
{
name: 'LSTM预测值',
type: 'line',
data: sampleTestLstm,
smooth: true,
symbol: 'none',
lineStyle: { width: 2, color: colors.secondary, type: 'dashed' }
},
{
name: '预测误差',
type: 'bar',
yAxisIndex: 1,
data: sampleTestTrue.map((v, i) => parseFloat((v - sampleTestLstm[i]).toFixed(3))),
itemStyle: {
color: new echarts.graphic.LinearGradient(0, 0, 0, 1, [
{ offset: 0, color: 'rgba(255,109,0,0.6)' },
{ offset: 1, color: 'rgba(255,109,0,0.1)' }
])
},
barWidth: 2
}
]
});
// ===== 图表4:三模型预测对比 =====
const chartModelCompare = echarts.init(document.getElementById('chartModelCompare'));
const compareStep = 5;
const compareDates = testDates.filter((_, i) => i % compareStep === 0);
const compareTrue = testTrue.filter((_, i) => i % compareStep === 0);
const compareLstm = testLstm.filter((_, i) => i % compareStep === 0);
const compareGru = testGru.filter((_, i) => i % compareStep === 0);
const compareBp = testBp.filter((_, i) => i % compareStep === 0);
chartModelCompare.setOption({
tooltip: {
trigger: 'axis',
backgroundColor: 'rgba(10,20,60,0.9)',
borderColor: 'rgba(79,195,247,0.3)',
textStyle: { color: '#e0e6ff', fontSize: 12 },
formatter: function(params) {
let s = '日期:' + params[0].axisValue + '<br/>';
params.forEach(p => {
s += p.marker + ' ' + p.seriesName + ':' + parseFloat(p.value).toFixed(2) + ' 万人次<br/>';
});
return s;
}
},
legend: {
data: ['真实值', 'LSTM', 'GRU', 'BP神经网络'],
textStyle: { color: 'rgba(180,200,255,0.6)', fontSize: 11 },
top: 4, right: 10
},
grid: { left: 55, right: 20, top: 40, bottom: 35 },
xAxis: {
type: 'category',
data: compareDates,
...baseAxis(),
axisLabel: { ...baseAxis().axisLabel, rotate: 30 }
},
yAxis: {
type: 'value',
name: '万人次',
nameTextStyle: { color: 'rgba(180,200,255,0.5)', fontSize: 10 },
...baseAxis()
},
series: [
{
name: '真实值',
type: 'line',
data: compareTrue,
smooth: true,
symbol: 'none',
lineStyle: { width: 3, color: colors.primary },
z: 10
},
{
name: 'LSTM',
type: 'line',
data: compareLstm,
smooth: true,
symbol: 'none',
lineStyle: { width: 2, color: colors.secondary, type: 'dashed' }
},
{
name: 'GRU',
type: 'line',
data: compareGru,
smooth: true,
symbol: 'none',
lineStyle: { width: 2, color: colors.accent, type: 'dashed' }
},
{
name: 'BP神经网络',
type: 'line',
data: compareBp,
smooth: true,
symbol: 'none',
lineStyle: { width: 1.5, color: '#66bb6a', type: 'dotted' }
}
]
});
// ===== 图表5:指标柱状对比 =====
const chartMetricBar = echarts.init(document.getElementById('chartMetricBar'));
chartMetricBar.setOption({
tooltip: {
trigger: 'axis',
backgroundColor: 'rgba(10,20,60,0.9)',
borderColor: 'rgba(79,195,247,0.3)',
textStyle: { color: '#e0e6ff', fontSize: 11 }
},
legend: {
data: ['LSTM', 'GRU', 'BP'],
textStyle: { color: 'rgba(180,200,255,0.6)', fontSize: 10 },
top: 0, right: 0
},
grid: { left: 50, right: 15, top: 28, bottom: 24 },
xAxis: {
type: 'category',
data: ['MAE', 'RMSE', 'MAPE(%)'],
...baseAxis(),
axisLabel: { fontSize: 10 }
},
yAxis: {
type: 'value',
...baseAxis(),
axisLabel: { fontSize: 9 }
},
series: [
{
name: 'LSTM',
type: 'bar',
data: [0.251, 0.347, 12.3],
itemStyle: {
color: new echarts.graphic.LinearGradient(0, 0, 0, 1, [
{ offset: 0, color: '#4fc3f7' },
{ offset: 1, color: '#0288d1' }
]),
borderRadius: [3, 3, 0, 0]
},
barWidth: 14
},
{
name: 'GRU',
type: 'bar',
data: [0.298, 0.396, 15.1],
itemStyle: {
color: new echarts.graphic.LinearGradient(0, 0, 0, 1, [
{ offset: 0, color: '#7c4dff' },
{ offset: 1, color: '#512da8' }
]),
borderRadius: [3, 3, 0, 0]
},
barWidth: 14
},
{
name: 'BP',
type: 'bar',
data: [0.386, 0.493, 19.7],
itemStyle: {
color: new echarts.graphic.LinearGradient(0, 0, 0, 1, [
{ offset: 0, color: '#ff6d00' },
{ offset: 1, color: '#e65100' }
]),
borderRadius: [3, 3, 0, 0]
},
barWidth: 14
}
]
});
// ===== 响应式 =====
window.addEventListener('resize', () => {
chartTrend.resize();
chartHeatmap.resize();
chartLstmPred.resize();
chartModelCompare.resize();
chartMetricBar.resize();
});
// ===== 数字滚动动画 =====
function animateValue(el, start, end, suffix, duration) {
const startTime = performance.now();
function update(currentTime) {
const elapsed = currentTime - startTime;
const progress = Math.min(elapsed / duration, 1);
const eased = 1 - Math.pow(1 - progress, 3); // easeOutCubic
const current = start + (end - start) * eased;
el.textContent = current.toFixed(3) + (suffix || '');
if (progress < 1) requestAnimationFrame(update);
}
requestAnimationFrame(update);
}
// 页面加载后启动KPI动画
setTimeout(() => {
animateValue(document.getElementById('kpiR2'), 0, 0.892, '', 2000);
animateValue(document.getElementById('kpiRMSE'), 0, 0.347, '', 2000);
animateValue(document.getElementById('kpiMAPE'), 0, 12.3, '%', 2000);
}, 500);
</script>
</body>
</html>项目地址;