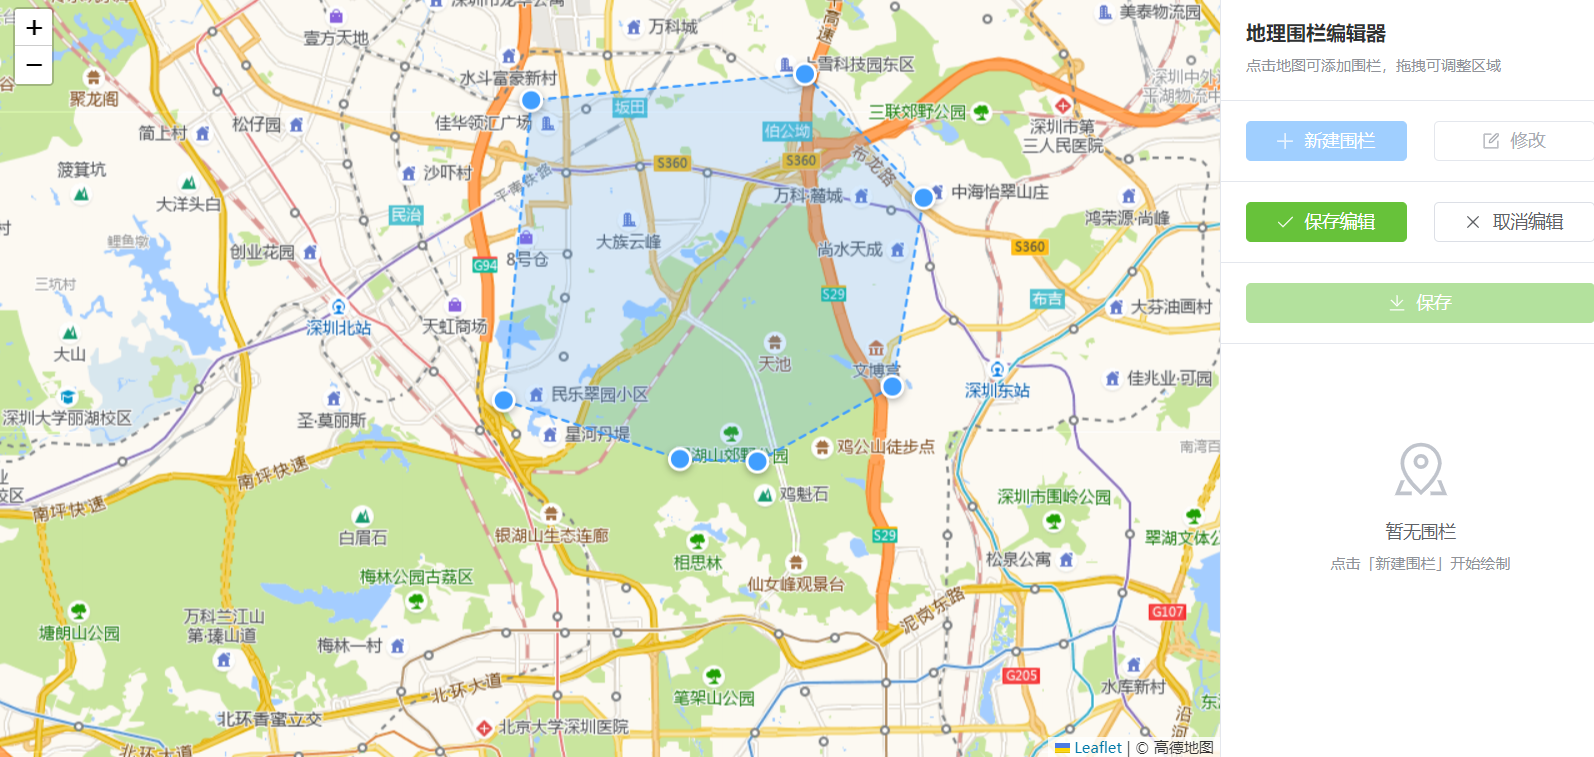
实现效果
代码
安装
javascript
npm install leaflet leaflet-draw
javascript
<script setup lang="ts">
import { ref, onMounted, onUnmounted, nextTick } from 'vue'
import L from 'leaflet'
import { ElMessage, ElMessageBox } from 'element-plus'
import 'leaflet/dist/leaflet.css';
import 'leaflet-draw';
import 'leaflet-draw/dist/leaflet.draw.css';
// 围栏数据
interface Geofence {
id: number
name: string
coordinates: [number, number][]
color: string
}
// 状态
const mapContainer = ref<HTMLElement>()
const map = ref<L.Map | null>(null)
const mapLoading = ref(true)
const mapError = ref('')
const geofences = ref<Geofence[]>([])
const currentGeofence = ref<Geofence | null>(null)
const isDrawing = ref(false)
const isEditing = ref(false)
const drawingPoints = ref<[number, number][]>([])
const tempPolyline = ref<L.Polyline | null>(null)
const tempPolygon = ref<L.Polygon | null>(null)
const polygonLayers = ref<Map<number, L.Polygon>>(new Map())
const drawingMarkers = ref<L.Marker[]>([])
const nextId = ref(1)
// 颜色列表
const colors = ['#409EFF', '#67C23A', '#E6A23C', '#F56C6C', '#909399', '#8B5CF6']
// 闭合阈值(米):当新点与第一个点距离小于此值时自动完成绘制
const CLOSE_THRESHOLD = 30
// 计算两点之间的距离(米)
const calculateDistance = (p1: [number, number], p2: [number, number]): number => {
const R = 6371000 // 地球半径(米)
const lat1 = p1[0] * Math.PI / 180
const lat2 = p2[0] * Math.PI / 180
const deltaLat = (p2[0] - p1[0]) * Math.PI / 180
const deltaLng = (p2[1] - p1[1]) * Math.PI / 180
const a = Math.sin(deltaLat / 2) * Math.sin(deltaLat / 2) +
Math.cos(lat1) * Math.cos(lat2) *
Math.sin(deltaLng / 2) * Math.sin(deltaLng / 2)
const c = 2 * Math.atan2(Math.sqrt(a), Math.sqrt(1 - a))
return R * c
}
// 生成单个围栏的 GeoJSON
const generateGeoJSON = (geofence: Geofence) => {
// GeoJSON Polygon 坐标格式:[lng, lat],且首尾闭合
const coordinates = geofence.coordinates.map(p => [p[1], p[0]])
// 确保多边形闭合
if (coordinates.length > 0) {
const first = coordinates[0]
const last = coordinates[coordinates.length - 1]
if (first[0] !== last[0] || first[1] !== last[1]) {
coordinates.push([...first])
}
}
return {
type: 'Feature',
geometry: {
type: 'Polygon',
coordinates: [coordinates]
},
properties: {
id: geofence.id,
name: geofence.name,
color: geofence.color
}
}
}
// 保存所有围栏(输出 GeoJSON)
const saveAllGeofences = () => {
if (geofences.value.length === 0) {
ElMessage.warning('没有可保存的围栏')
return
}
const geojson = {
type: 'FeatureCollection',
features: geofences.value.map(generateGeoJSON)
}
console.log('=== GeoJSON 数据 ===')
console.log(JSON.stringify(geojson, null, 2))
ElMessage.success(`已保存 ${geofences.value.length} 个围栏,GeoJSON 已输出到控制台`)
}
// 初始化地图
const initMap = async () => {
await nextTick()
// 延迟确保 DOM 完全渲染
setTimeout(() => {
if (!mapContainer.value) {
mapError.value = '地图容器不存在'
mapLoading.value = false
console.error('地图容器不存在')
return
}
// 确保容器有高度
const container = mapContainer.value
console.log('地图容器尺寸:', container.clientWidth, 'x', container.clientHeight)
// 强制设置容器尺寸
container.style.width = '100%'
container.style.height = '100%'
container.style.minHeight = '600px'
container.style.backgroundColor = '#f0f2f5'
if (container.clientHeight === 0) {
container.style.height = '600px'
console.log('容器高度为0,已设置为600px')
}
// 深圳坐标
const SHENZHEN_LAT = 22.5431
const SHENZHEN_LNG = 114.0579
try {
console.log('开始初始化地图...')
map.value = L.map(container, {
center: [SHENZHEN_LAT, SHENZHEN_LNG],
zoom: 12,
zoomControl: true,
attributionControl: true
})
console.log('地图对象创建成功')
// 使用高德地图瓦片(开源数据,国内可访问)
const tileLayer = L.tileLayer(
'https://webrd0{s}.is.autonavi.com/appmaptile?lang=zh_cn&size=1&scale=1&style=8&x={x}&y={y}&z={z}',
{
attribution: '© 高德地图',
subdomains: ['1', '2', '3', '4'],
maxZoom: 18
}
)
// const tileLayer = L.tileLayer('http://t{s}.tianditu.gov.cn/vec_w/wmts?service=wmts&request=GetTile&version=1.0.0&LAYER=vec&tileMatrixSet=w&TileMatrix={z}&TileRow={y}&TileCol={x}&style=default&format=tiles&tk=YOUR_TDT_KEY', {
// subdomains: ['0', '1', '2', '3', '4', '5', '6', '7'],
// attribution: '© <a href="http://www.tianditu.gov.cn/">天地图</a>'
// }).addTo(map.value);
// L.tileLayer('http://t{s}.tianditu.gov.cn/cva_w/wmts?service=wmts&request=GetTile&version=1.0.0&LAYER=cva&tileMatrixSet=w&TileMatrix={z}&TileRow={y}&TileCol={x}&style=default&format=tiles&tk=YOUR_TDT_KEY', {
// subdomains: ['0', '1', '2', '3', '4', '5', '6', '7']
// }).addTo(map.value);
tileLayer.on('tileerror', (error) => {
console.warn('瓦片加载失败:', error)
})
tileLayer.addTo(map.value)
// 添加深圳中心点标记
const customIcon = L.divIcon({
className: 'custom-marker',
html: '<div style="background-color: #409EFF; width: 20px; height: 20px; border-radius: 50%; border: 3px solid white; box-shadow: 0 2px 6px rgba(0,0,0,0.3);"></div>',
iconSize: [20, 20],
iconAnchor: [10, 10]
})
L.marker([SHENZHEN_LAT, SHENZHEN_LNG], { icon: customIcon })
.addTo(map.value)
.bindPopup('<b>深圳市</b><br>地理围栏中心点')
.openPopup()
// 绑定地图点击事件
map.value.on('click', handleMapClick)
// 监听地图缩放,更新绘制点大小
map.value.on('zoomend', () => {
if (isDrawing.value) {
updateAllMarkerSizes()
}
})
// 监听地图加载完成
map.value.whenReady(() => {
mapLoading.value = false
console.log('地图加载完成,使用高德瓦片')
})
} catch (error) {
mapError.value = '地图初始化失败: ' + (error as Error).message
mapLoading.value = false
console.error('地图初始化失败:', error)
}
}, 100)
}
// 更新所有标记位置
const updateMarkersPosition = () => {
drawingMarkers.value.forEach((marker, index) => {
if (drawingPoints.value[index]) {
marker.setLatLng(drawingPoints.value[index])
}
})
}
// 获取当前缩放级别下的标记大小
const getMarkerSize = (): number => {
if (!map.value) return 16
const zoom = map.value.getZoom()
// 基础大小 16px,在 zoom 12 时;缩放时按比例变化
return Math.max(8, Math.min(32, Math.round(16 * Math.pow(1.2, zoom - 12))))
}
// 创建可拖拽标记
const createDraggableMarker = (latlng: [number, number], index: number) => {
if (!map.value) return null
const size = getMarkerSize()
const marker = L.marker(latlng, {
draggable: true,
icon: L.divIcon({
className: 'draggable-point',
html: `<div class="draw-point" style="
width: ${size}px;
height: ${size}px;
background-color: #409EFF;
border: 3px solid white;
border-radius: 50%;
box-shadow: 0 2px 6px rgba(0,0,0,0.3);
cursor: move;
"></div>`,
iconSize: [size, size],
iconAnchor: [size / 2, size / 2]
})
}).addTo(map.value)
// 拖拽开始
marker.on('dragstart', () => {
marker.setZIndexOffset(1000)
})
// 拖拽中
marker.on('drag', (e: L.LeafletMouseEvent) => {
const newLatLng = e.latlng
drawingPoints.value[index] = [newLatLng.lat, newLatLng.lng]
updateTempShape(false)
})
// 拖拽结束
marker.on('dragend', (e: L.LeafletMouseEvent) => {
marker.setZIndexOffset(0)
drawingPoints.value[index] = [e.latlng.lat, e.latlng.lng]
updateTempShape(true)
})
return marker
}
// 更新所有标记大小(缩放时调用)
const updateAllMarkerSizes = () => {
const size = getMarkerSize()
drawingMarkers.value.forEach(marker => {
marker.setIcon(L.divIcon({
className: 'draggable-point',
html: `<div class="draw-point" style="
width: ${size}px;
height: ${size}px;
background-color: #409EFF;
border: 3px solid white;
border-radius: 50%;
box-shadow: 0 2px 6px rgba(0,0,0,0.3);
cursor: move;
"></div>`,
iconSize: [size, size],
iconAnchor: [size / 2, size / 2]
}))
})
}
// 地图点击 - 添加绘制点
const handleMapClick = (e: L.LeafletMouseEvent) => {
if (!isDrawing.value || !map.value) return
const latlng: [number, number] = [e.latlng.lat, e.latlng.lng]
// 检查是否与第一个点重合(自动闭合)
if (drawingPoints.value.length >= 3) {
const firstPoint = drawingPoints.value[0]
const distance = calculateDistance(latlng, firstPoint)
if (distance < CLOSE_THRESHOLD) {
// 自动闭合:不添加新点,直接完成绘制
finishDrawing()
return
}
}
const index = drawingPoints.value.length
drawingPoints.value.push(latlng)
// 创建可拖拽标记
const marker = createDraggableMarker(latlng, index)
if (marker) {
drawingMarkers.value.push(marker)
}
// 更新临时线条
updateTempShape(true)
}
// 更新临时形状
const updateTempShape = (updateMarkers: boolean = true) => {
if (!map.value) return
// 清除旧的
if (tempPolyline.value) {
tempPolyline.value.remove()
}
if (tempPolygon.value) {
tempPolygon.value.remove()
}
if (updateMarkers) {
updateMarkersPosition()
}
if (drawingPoints.value.length < 2) return
if (drawingPoints.value.length === 2) {
tempPolyline.value = L.polyline(drawingPoints.value, {
color: '#409EFF',
weight: 3,
dashArray: '5, 5'
}).addTo(map.value)
} else {
tempPolygon.value = L.polygon(drawingPoints.value, {
color: '#409EFF',
weight: 2,
fillColor: '#409EFF',
fillOpacity: 0.2,
dashArray: '5, 5'
}).addTo(map.value)
}
}
// 开始新建围栏
const startNewGeofence = () => {
if (isDrawing.value) return
isDrawing.value = true
drawingPoints.value = []
currentGeofence.value = null
ElMessage.info('点击地图绘制围栏,首尾点靠近自动闭合')
}
// 完成绘制
const finishDrawing = () => {
if (!map.value || drawingPoints.value.length < 3) return
// 如果是编辑模式,保留原来的名称和颜色;否则使用新值
const isEditMode = isEditing.value
const originalName = currentGeofence.value?.name || `围栏${geofences.value.length + 1}`
const originalColor = currentGeofence.value?.color || colors[geofences.value.length % colors.length]
const color = isEditMode ? originalColor : colors[geofences.value.length % colors.length]
const name = isEditMode ? originalName : `围栏${geofences.value.length + 1}`
const newGeofence: Geofence = {
id: nextId.value++,
name,
coordinates: [...drawingPoints.value],
color
}
geofences.value.push(newGeofence)
drawGeofenceOnMap(newGeofence)
// 如果是编辑模式,更新当前选中的围栏为新围栏
if (isEditMode) {
currentGeofence.value = newGeofence
}
// 清除临时图形
clearTempShapes()
isDrawing.value = false
drawingPoints.value = []
ElMessage.success('围栏绘制完成')
}
// 在地图上绘制围栏
const drawGeofenceOnMap = (geofence: Geofence) => {
if (!map.value) return
const polygon = L.polygon(geofence.coordinates, {
color: geofence.color,
weight: 2,
fillColor: geofence.color,
fillOpacity: 0.3
}).addTo(map.value)
// 绑定点击事件
polygon.on('click', () => {
if (!isDrawing.value) {
selectGeofence(geofence)
}
})
polygonLayers.value.set(geofence.id, polygon)
}
// 清除临时图形
const clearTempShapes = () => {
if (tempPolyline.value) {
tempPolyline.value.remove()
tempPolyline.value = null
}
if (tempPolygon.value) {
tempPolygon.value.remove()
tempPolygon.value = null
}
// 清除所有标记
drawingMarkers.value.forEach(marker => {
marker.remove()
})
drawingMarkers.value = []
}
// 选择围栏
const selectGeofence = (geofence: Geofence) => {
if (isDrawing.value || isEditing.value) return
currentGeofence.value = geofence
// 高亮显示
const layer = polygonLayers.value.get(geofence.id)
if (layer && map.value) {
map.value.fitBounds(layer.getBounds(), { padding: [50, 50] })
}
}
// 修改围栏
const editGeofence = () => {
if (!currentGeofence.value) {
ElMessage.warning('请先选择一个围栏')
return
}
isEditing.value = true
isDrawing.value = true
drawingPoints.value = [...currentGeofence.value.coordinates]
// 删除旧的
const oldLayer = polygonLayers.value.get(currentGeofence.value.id)
if (oldLayer) {
oldLayer.remove()
polygonLayers.value.delete(currentGeofence.value.id)
}
// 移除数据,但不重置 currentGeofence,以便 finishDrawing 中恢复
const editingGeofence = currentGeofence.value
geofences.value = geofences.value.filter(g => g.id !== editingGeofence.id)
// 为已有的点创建可拖拽标记
drawingPoints.value.forEach((latlng, index) => {
const marker = createDraggableMarker(latlng, index)
if (marker) {
drawingMarkers.value.push(marker)
}
})
updateTempShape(true)
ElMessage.info('重新绘制围栏,首尾点靠近自动闭合')
}
// 保存编辑
const saveEdit = () => {
if (isDrawing.value && drawingPoints.value.length >= 3) {
finishDrawing()
isEditing.value = false
} else if (isDrawing.value) {
ElMessage.warning('请完成围栏绘制')
} else {
ElMessage.success('保存成功')
}
}
// 取消编辑
const cancelEdit = () => {
if (isEditing.value && currentGeofence.value) {
// 恢复原来的围栏
geofences.value.push(currentGeofence.value)
drawGeofenceOnMap(currentGeofence.value)
}
clearTempShapes()
isDrawing.value = false
isEditing.value = false
drawingPoints.value = []
currentGeofence.value = null
}
// 删除围栏
const deleteGeofence = async (geofence: Geofence) => {
try {
await ElMessageBox.confirm('确定要删除该围栏吗?', '提示', {
confirmButtonText: '确定',
cancelButtonText: '取消',
type: 'warning'
})
const layer = polygonLayers.value.get(geofence.id)
if (layer) {
layer.remove()
polygonLayers.value.delete(geofence.id)
}
geofences.value = geofences.value.filter(g => g.id !== geofence.id)
if (currentGeofence.value?.id === geofence.id) {
currentGeofence.value = null
}
ElMessage.success('删除成功')
} catch {
// 取消删除
}
}
// 定位围栏
const locateGeofence = (geofence: Geofence) => {
selectGeofence(geofence)
}
onMounted(() => {
initMap()
})
onUnmounted(() => {
if (map.value) {
map.value.remove()
map.value = null
}
})
</script>
<template>
<div class="geofence-page">
<div class="geofence-container">
<!-- 地图区域 -->
<div class="map-wrapper">
<div v-if="mapLoading" class="map-loading">
<Icon icon="ep:loading" class="loading-icon" />
<span>地图加载中...</span>
</div>
<div v-if="mapError" class="map-error">
<Icon icon="ep:warning-filled" class="error-icon" />
<span>{{ mapError }}</span>
</div>
<div ref="mapContainer" class="map-container" ></div>
</div>
<!-- 侧边栏 -->
<div class="sidebar">
<div class="sidebar-header">
<h3 class="sidebar-title">地理围栏编辑器</h3>
<p class="sidebar-subtitle">点击地图可添加围栏,拖拽可调整区域</p>
</div>
<div class="sidebar-actions">
<el-button
type="primary"
:disabled="isDrawing"
@click="startNewGeofence"
>
<Icon icon="ep:plus" class="mr-5px" /> 新建围栏
</el-button>
<el-button
:disabled="!currentGeofence || isDrawing"
@click="editGeofence"
>
<Icon icon="ep:edit" class="mr-5px" /> 修改
</el-button>
</div>
<div class="sidebar-actions" v-if="isDrawing">
<el-button type="success" @click="saveEdit">
<Icon icon="ep:check" class="mr-5px" /> 保存编辑
</el-button>
<el-button @click="cancelEdit">
<Icon icon="ep:close" class="mr-5px" /> 取消编辑
</el-button>
</div>
<div class="sidebar-actions">
<el-button
type="success"
:disabled="geofences.length === 0"
@click="saveAllGeofences"
>
<Icon icon="ep:download" class="mr-5px" /> 保存
</el-button>
</div>
<div class="geofence-list">
<div v-if="geofences.length === 0" class="empty-state">
<Icon icon="ep:map-location" :size="48" class="empty-icon" />
<p class="empty-text">暂无围栏</p>
<p class="empty-tip">点击「新建围栏」开始绘制</p>
</div>
<div v-else class="list-content">
<div
v-for="item in geofences"
:key="item.id"
class="geofence-item"
:class="{ active: currentGeofence?.id === item.id }"
@click="locateGeofence(item)"
>
<div class="geofence-info">
<div class="geofence-color" :style="{ backgroundColor: item.color }" ></div>
<span class="geofence-name">{{ item.name }}</span>
</div>
<div class="geofence-actions">
<el-button
link
type="danger"
size="small"
@click.stop="deleteGeofence(item)"
>
<Icon icon="ep:delete" />
</el-button>
</div>
</div>
</div>
</div>
</div>
</div>
</div>
</template>
<style scoped lang="scss">
.geofence-page {
height: calc(100vh - 84px);
padding: 0;
margin: 0;
}
.geofence-container {
display: flex;
height: 100%;
background-color: #fff;
}
.map-wrapper {
flex: 1;
position: relative;
height: 100%;
min-height: 600px;
}
.map-loading,
.map-error {
position: absolute;
top: 50%;
left: 50%;
transform: translate(-50%, -50%);
display: flex;
flex-direction: column;
align-items: center;
gap: 12px;
z-index: 10;
padding: 20px;
background: rgba(255, 255, 255, 0.9);
border-radius: 8px;
box-shadow: 0 2px 12px rgba(0, 0, 0, 0.1);
}
.loading-icon {
font-size: 32px;
color: #409eff;
animation: rotate 1s linear infinite;
}
.error-icon {
font-size: 32px;
color: #f56c6c;
}
@keyframes rotate {
from {
transform: rotate(0deg);
}
to {
transform: rotate(360deg);
}
}
/* 确保地图容器高度 */
.map-container {
width: 100%;
height: 100%;
min-height: 600px;
position: relative;
z-index: 1;
}
.sidebar {
width: 320px;
border-left: 1px solid #e4e7ed;
background-color: #fff;
display: flex;
flex-direction: column;
}
.sidebar-header {
padding: 20px;
border-bottom: 1px solid #e4e7ed;
}
.sidebar-title {
margin: 0 0 8px;
font-size: 16px;
font-weight: 600;
color: #303133;
}
.sidebar-subtitle {
margin: 0;
font-size: 12px;
color: #909399;
}
.sidebar-actions {
padding: 16px 20px;
display: flex;
gap: 10px;
border-bottom: 1px solid #e4e7ed;
.el-button {
flex: 1;
}
}
.geofence-list {
flex: 1;
overflow-y: auto;
padding: 16px 20px;
}
.empty-state {
display: flex;
flex-direction: column;
align-items: center;
justify-content: center;
padding: 60px 0;
color: #909399;
}
.empty-icon {
margin-bottom: 16px;
color: #c0c4cc;
}
.empty-text {
margin: 0 0 8px;
font-size: 14px;
color: #606266;
}
.empty-tip {
margin: 0;
font-size: 12px;
color: #909399;
}
.list-content {
display: flex;
flex-direction: column;
gap: 8px;
}
.geofence-item {
display: flex;
align-items: center;
justify-content: space-between;
padding: 12px;
border-radius: 4px;
border: 1px solid #e4e7ed;
cursor: pointer;
transition: all 0.3s;
&:hover {
border-color: #409eff;
background-color: #f5f7fa;
}
&.active {
border-color: #409eff;
background-color: #ecf5ff;
}
}
.geofence-info {
display: flex;
align-items: center;
gap: 8px;
}
.geofence-color {
width: 12px;
height: 12px;
border-radius: 2px;
}
.geofence-name {
font-size: 14px;
color: #606266;
}
.geofence-actions {
display: flex;
gap: 4px;
}
:deep(.leaflet-container) {
font-family: inherit;
width: 100%;
height: 100%;
}
</style>注意:代码中使用的高德地图瓦片链接,存在较高的收费和法律合规风险,建议商业授权
也可以自己部署瓦片服务,资源下载地址https://download.geofabrik.de/