Prometheus容器配置与本机监控
bash
mkdir -p /dockerapp/prometheus/{data,config,rules}
chmod -R 777 /dockerapp/prometheus/data
chmod -R 777 /dockerapp/prometheus/rules
chmod -R 777 /dockerapp/prometheus/config
cd /dockerapp/prometheus/config
vim prometheus.yml
配置文件
global:
每60秒抓取一次数据
scrape_interval: 60s
evaluation_interval: 60s
scrape_timeout: 60s
scrape_configs:
- job_name: prometheus
static_configs:
- targets: "localhost:9090"
labels:
instance: prometheus
- job_name: node
static_configs:
- targets: "192.168.1.200:9090"
labels:
instance: 192.168.1.200
bash
docker run -d \
  --name prometheus \
  -p 9090:9090 \
  -v /dockerapp/prometheus/config/prometheus.yml:/etc/prometheus/prometheus.yml \
  -v /dockerapp/prometheus/data:/prometheus \
  -v /dockerapp/prometheus/rules:/etc/prometheus/rules \
  --restart=always \
  prom/prometheus \
  --config.file=/etc/prometheus/prometheus.yml \
  --storage.tsdb.path=/prometheus \
  --web.enable-lifecycle

# 拉取node_export给主机做端口方便监控(不做就又要开一个虚拟机做端口映射)

wget https://mirror.ghproxy.com/https://github.com/prometheus/node_exporter/releases/download/v1.8.2/node_exporter-1.8.2.linux-amd64.tar.gz
tar -zxvf node_exporter-1.8.2.linux-amd64.tar.gz
mv node_exporter-1.8.2.linux-amd64/node_exporter /usr/local/bin/
rm -rf node_exporter-1.8.2.linux-amd64*
cat > /etc/systemd/system/node-exporter.service <<EOF
[Unit]
Description=Node Exporter
After=network.target
[Service]
ExecStart=/usr/local/bin/node_exporter
Restart=always
[Install]
WantedBy=multi-user.target
EOF

systemctl daemon-reload
systemctl start node-exporter
systemctl enable node-exporter
这个时候访问主机IP:9090
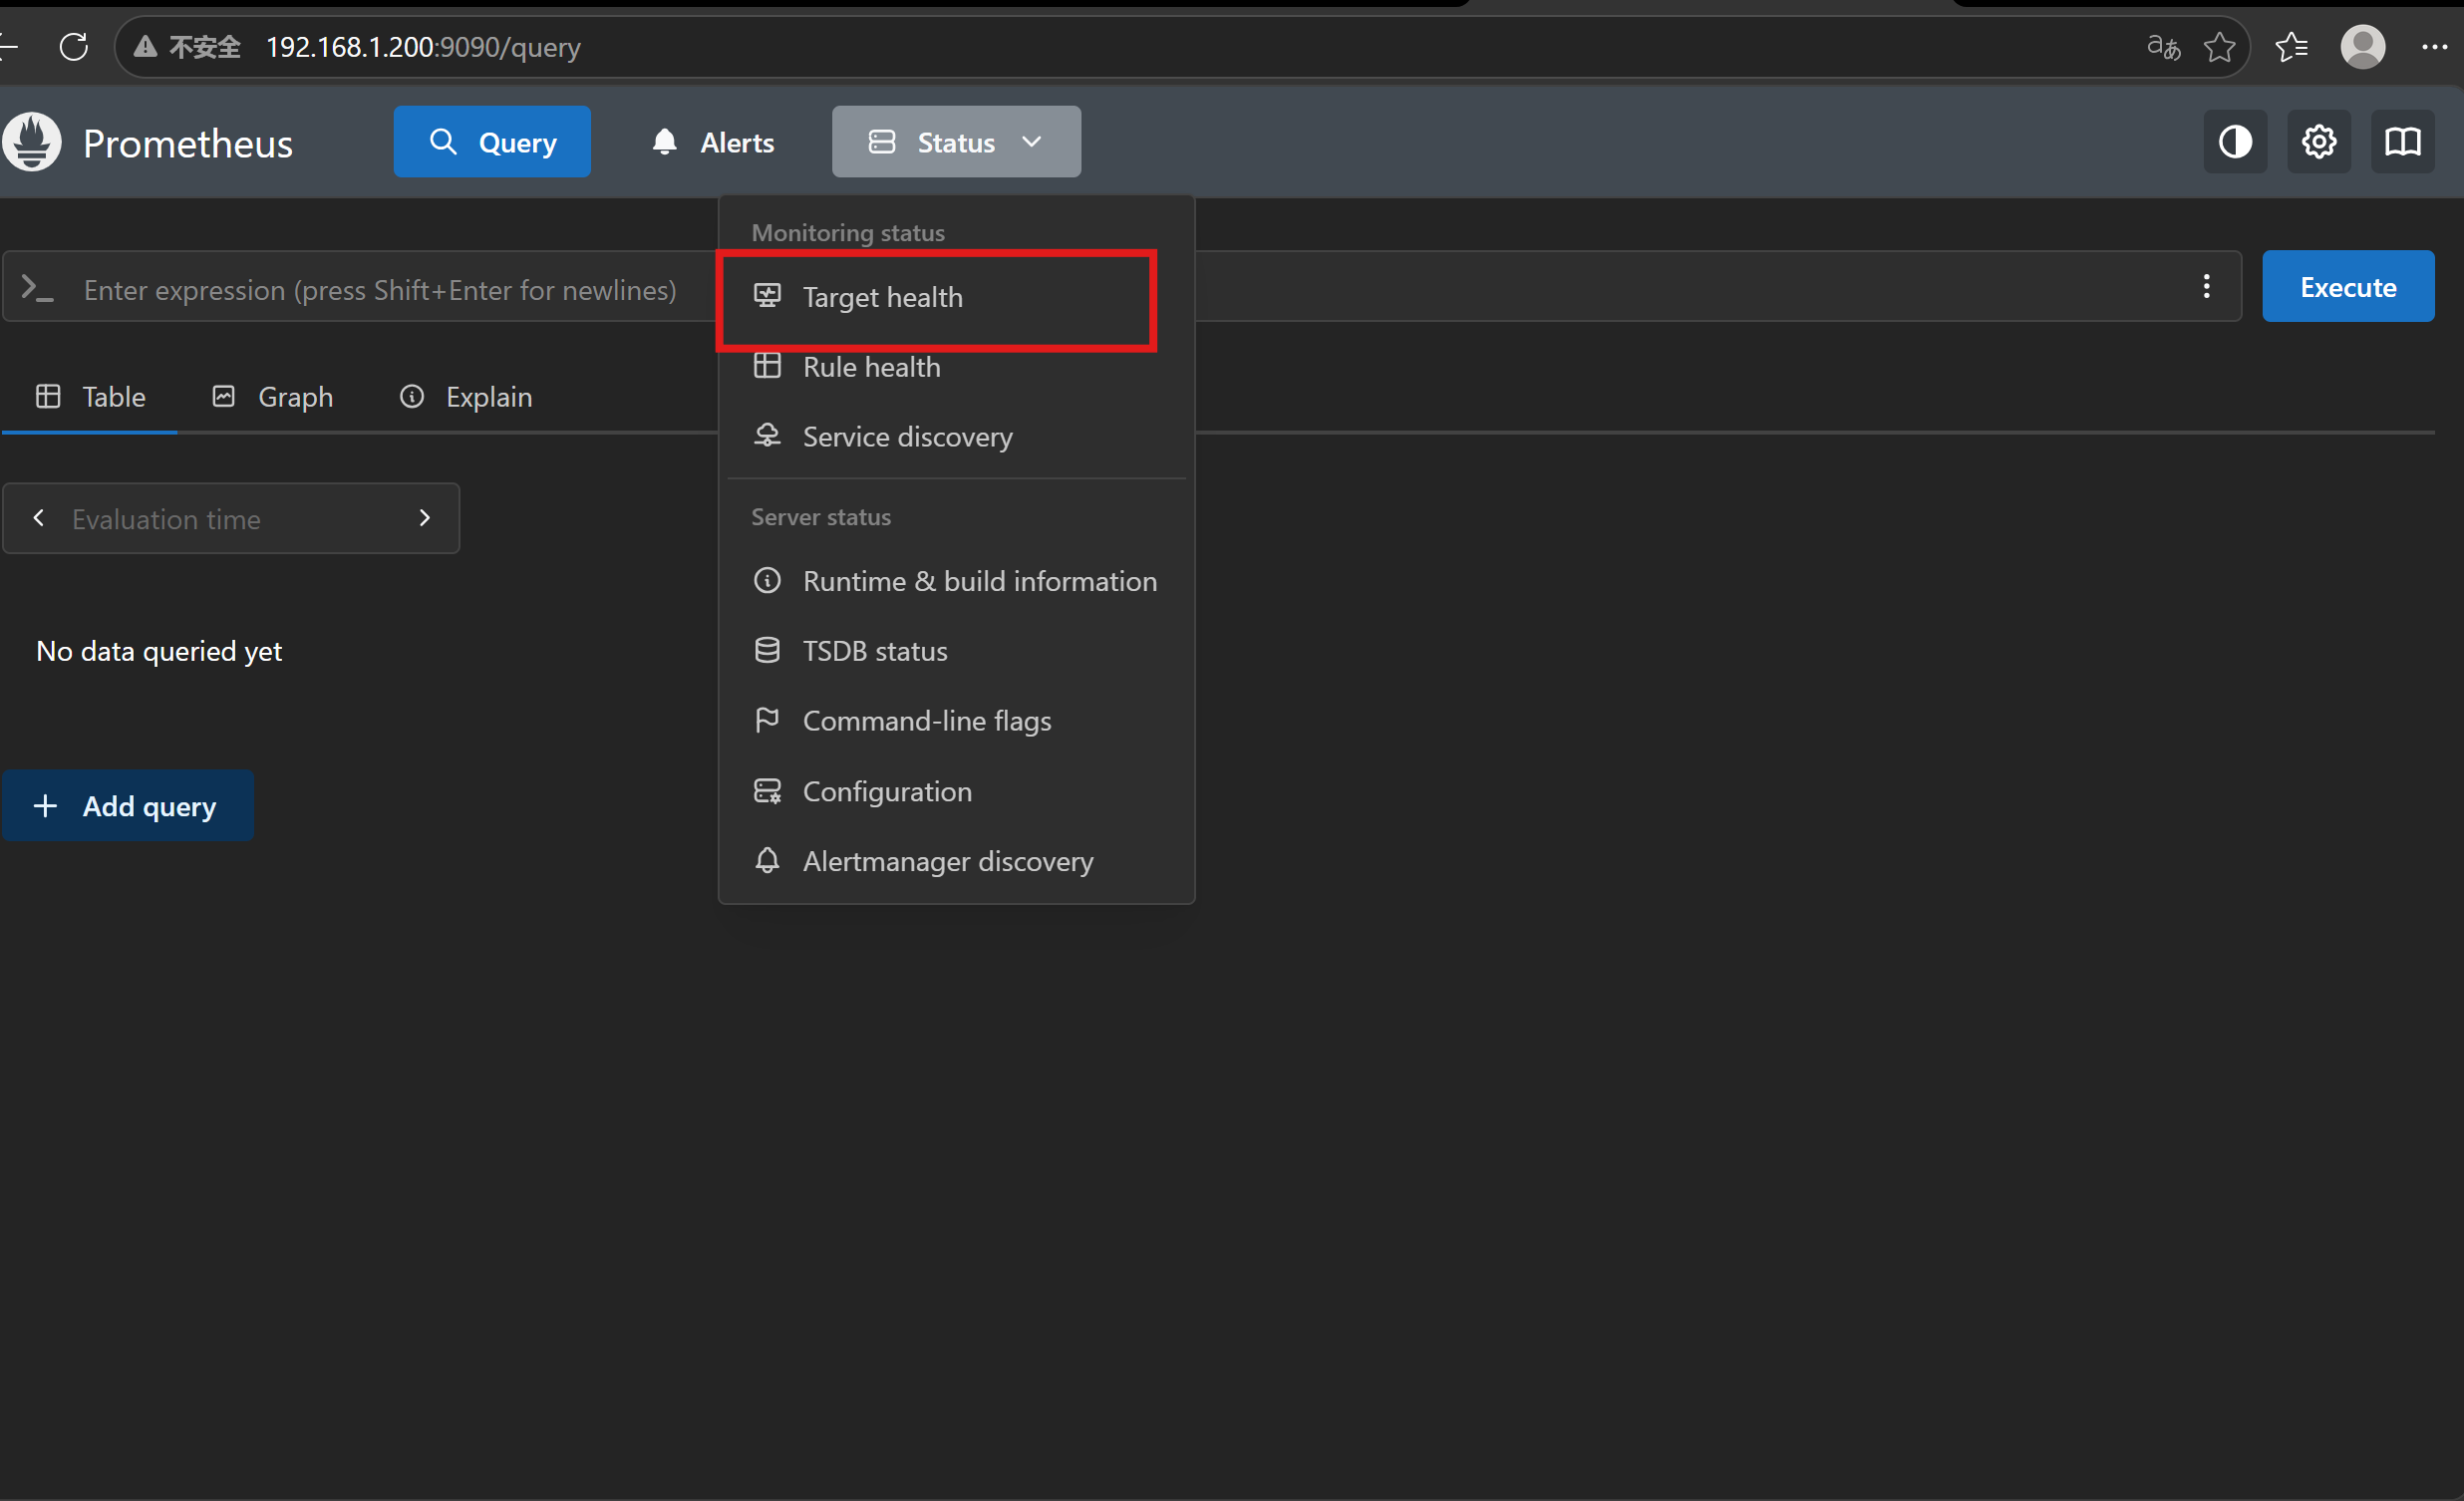
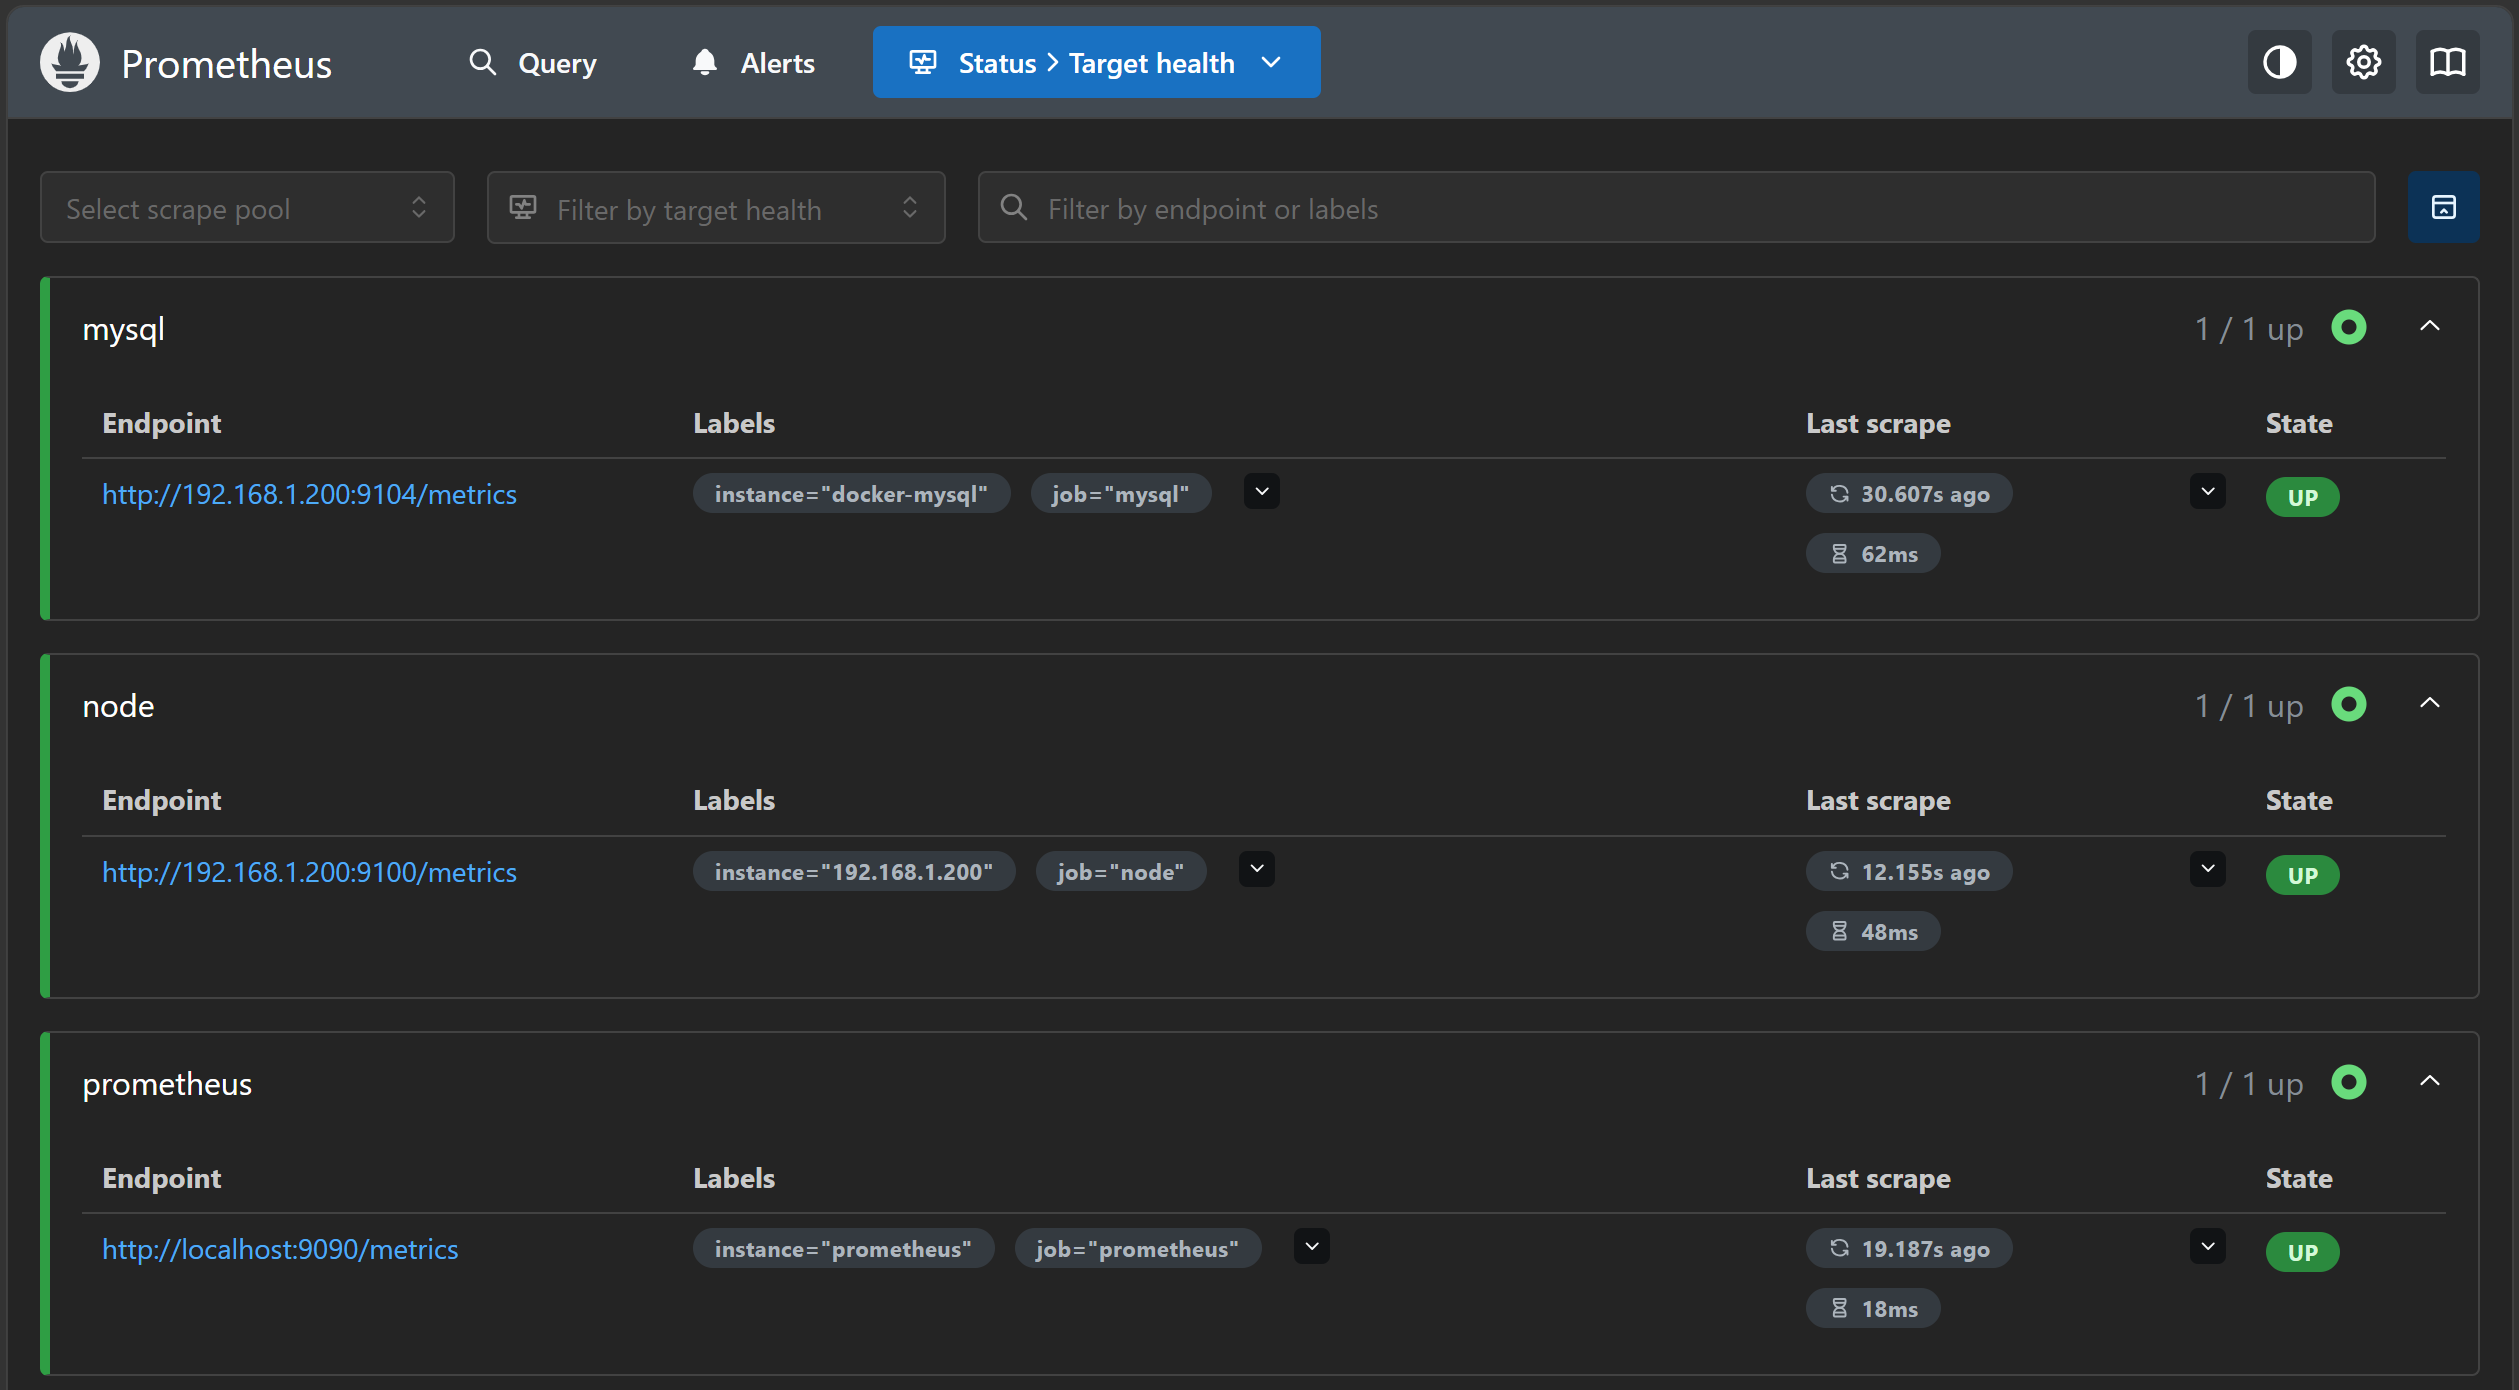
这里是我做到最后一步截的图,其实这里显示的是下面两个的up
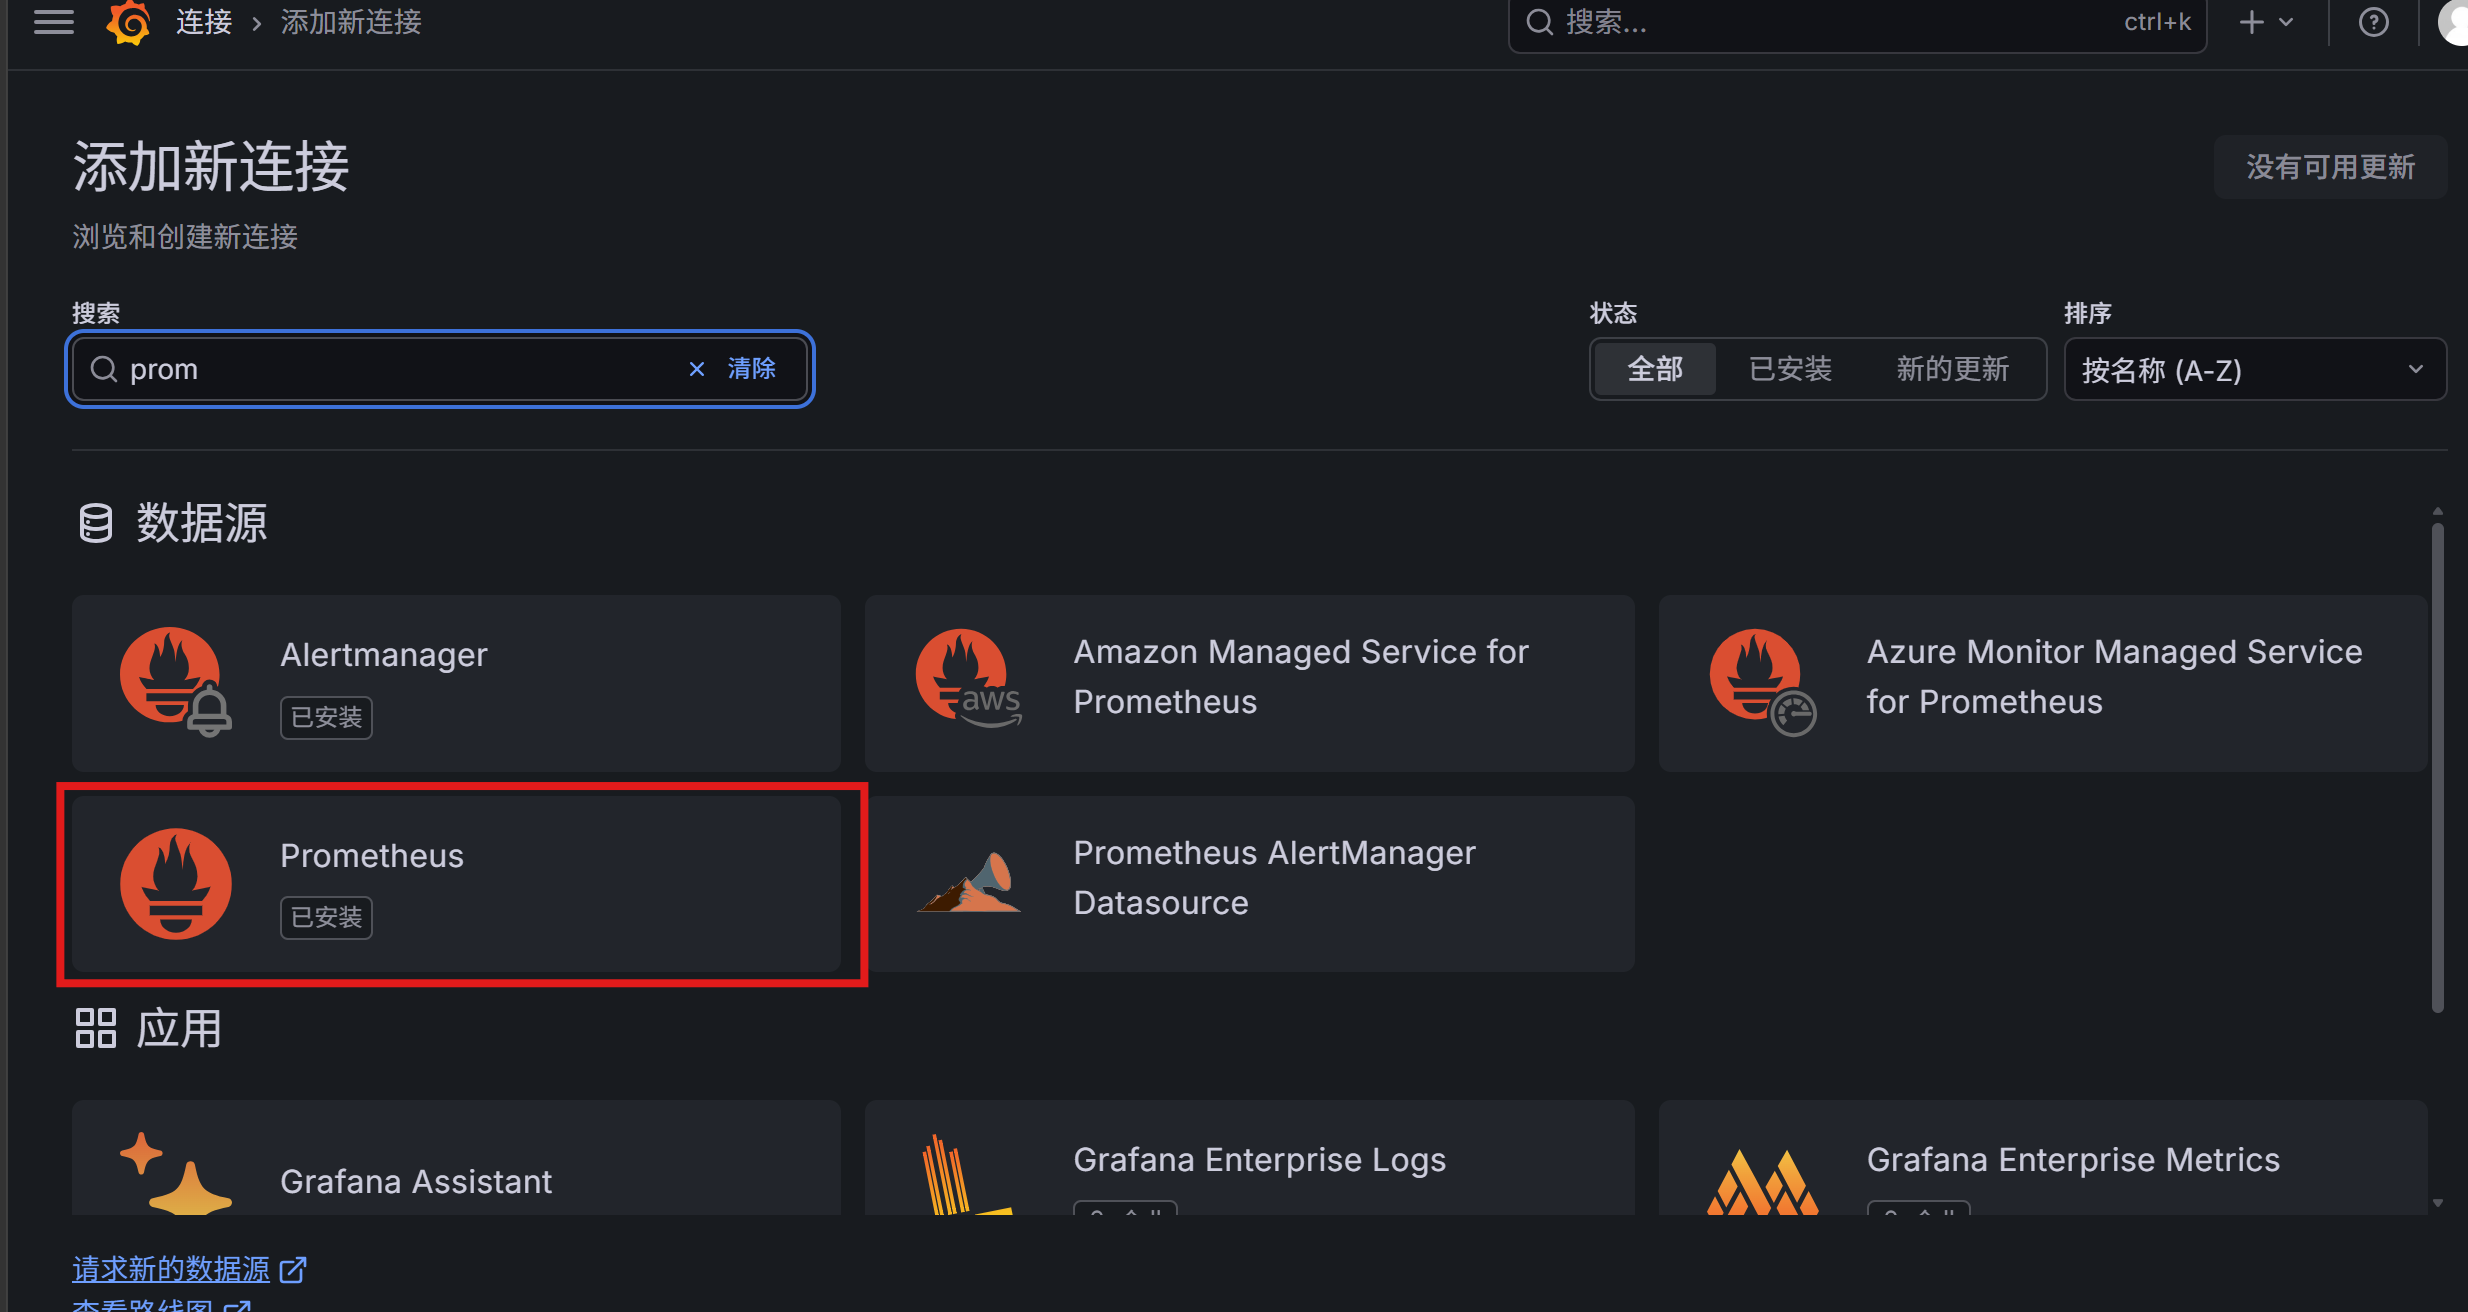
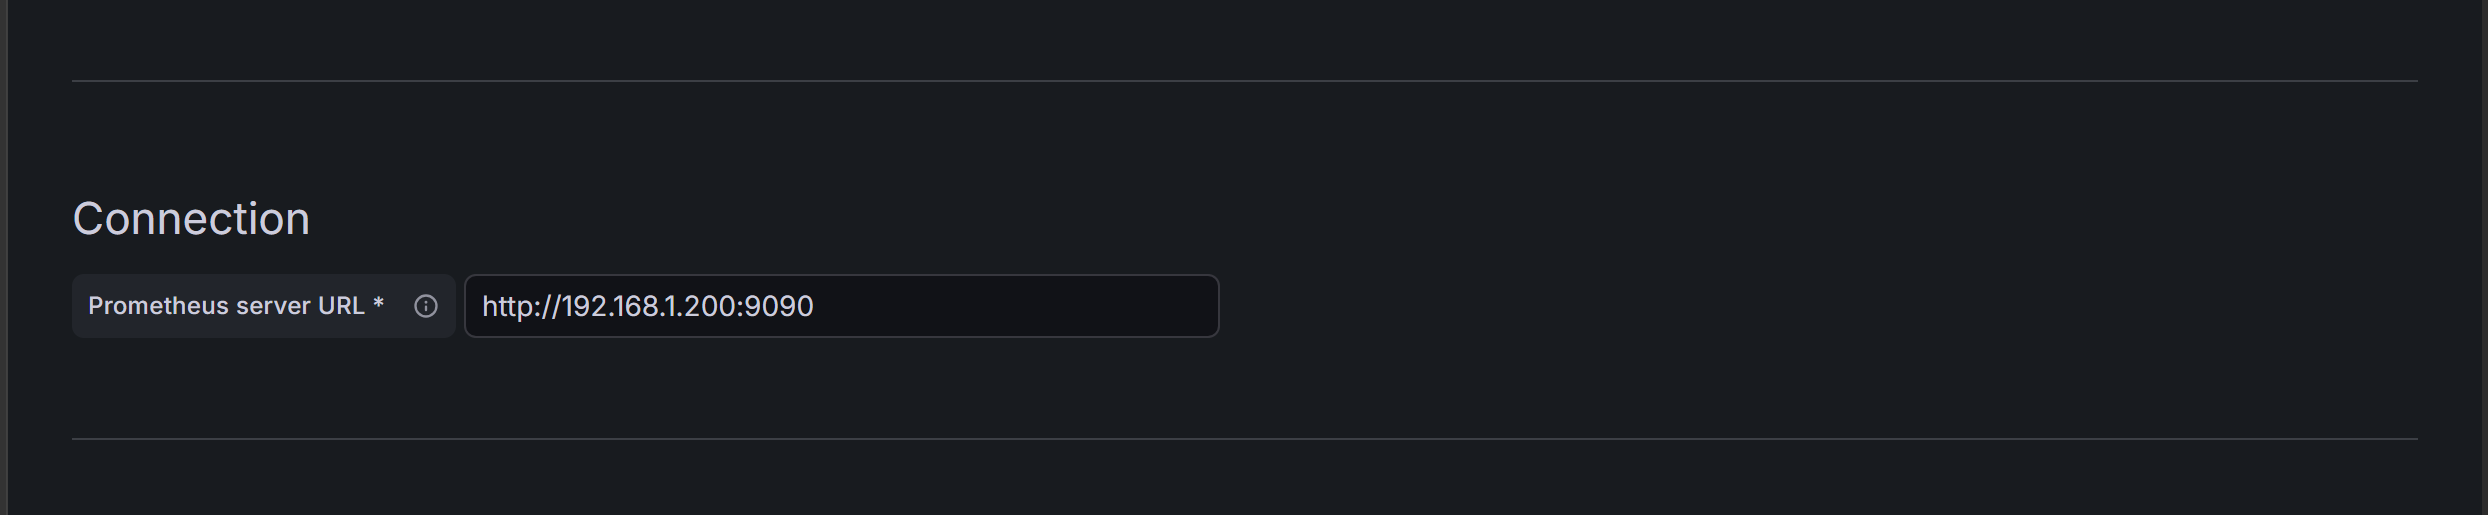
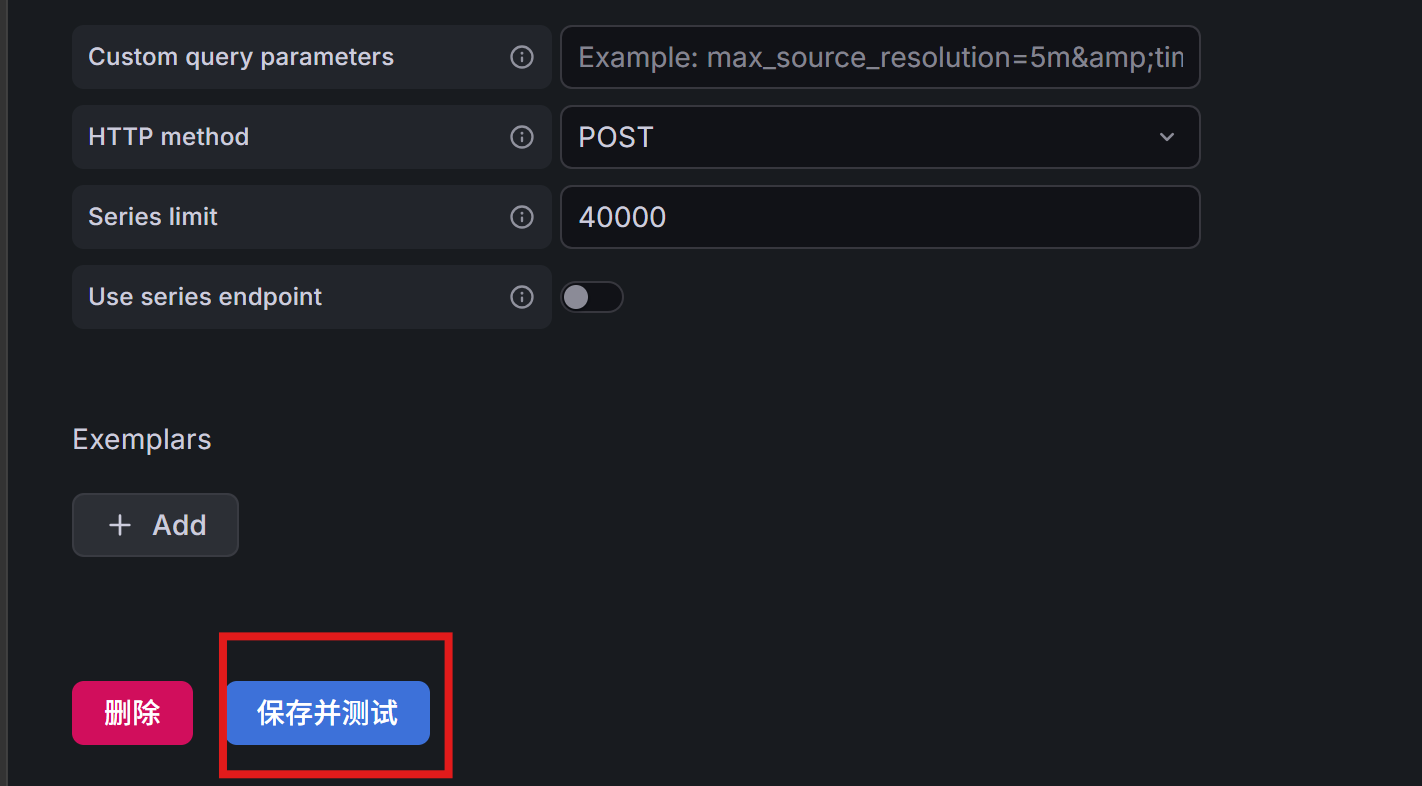
grafana容器的创建
bash
mkdir -p /dockerapp/grafana/{data,plugins,config}
chmod -R 777 /dockerapp/grafana/{data,plugins,config}
docker pull grafana/grafana
docker run --name grafana-tmp -d -p 3000:3000 grafana/grafana
docker cp grafana-tmp:/etc/grafana/grafana.ini /dockerapp/grafana/config/grafana.ini
docker stop grafana-tmp
docker rm grafana-tmp
docker run -d -p 3000:3000 --name=grafana -v /etc/localtime:/etc/localtime:ro -v /dockerapp/grafana/data:/var/lib/grafana -v /dockerapp/grafana/plugins/:/var/lib/grafana/plugins -v /dockerapp/grafana/config/grafana.ini:/etc/grafana/grafana.ini -e "GF_SECURITY_ADMIN_PASSWORD=admin" grafana/grafana
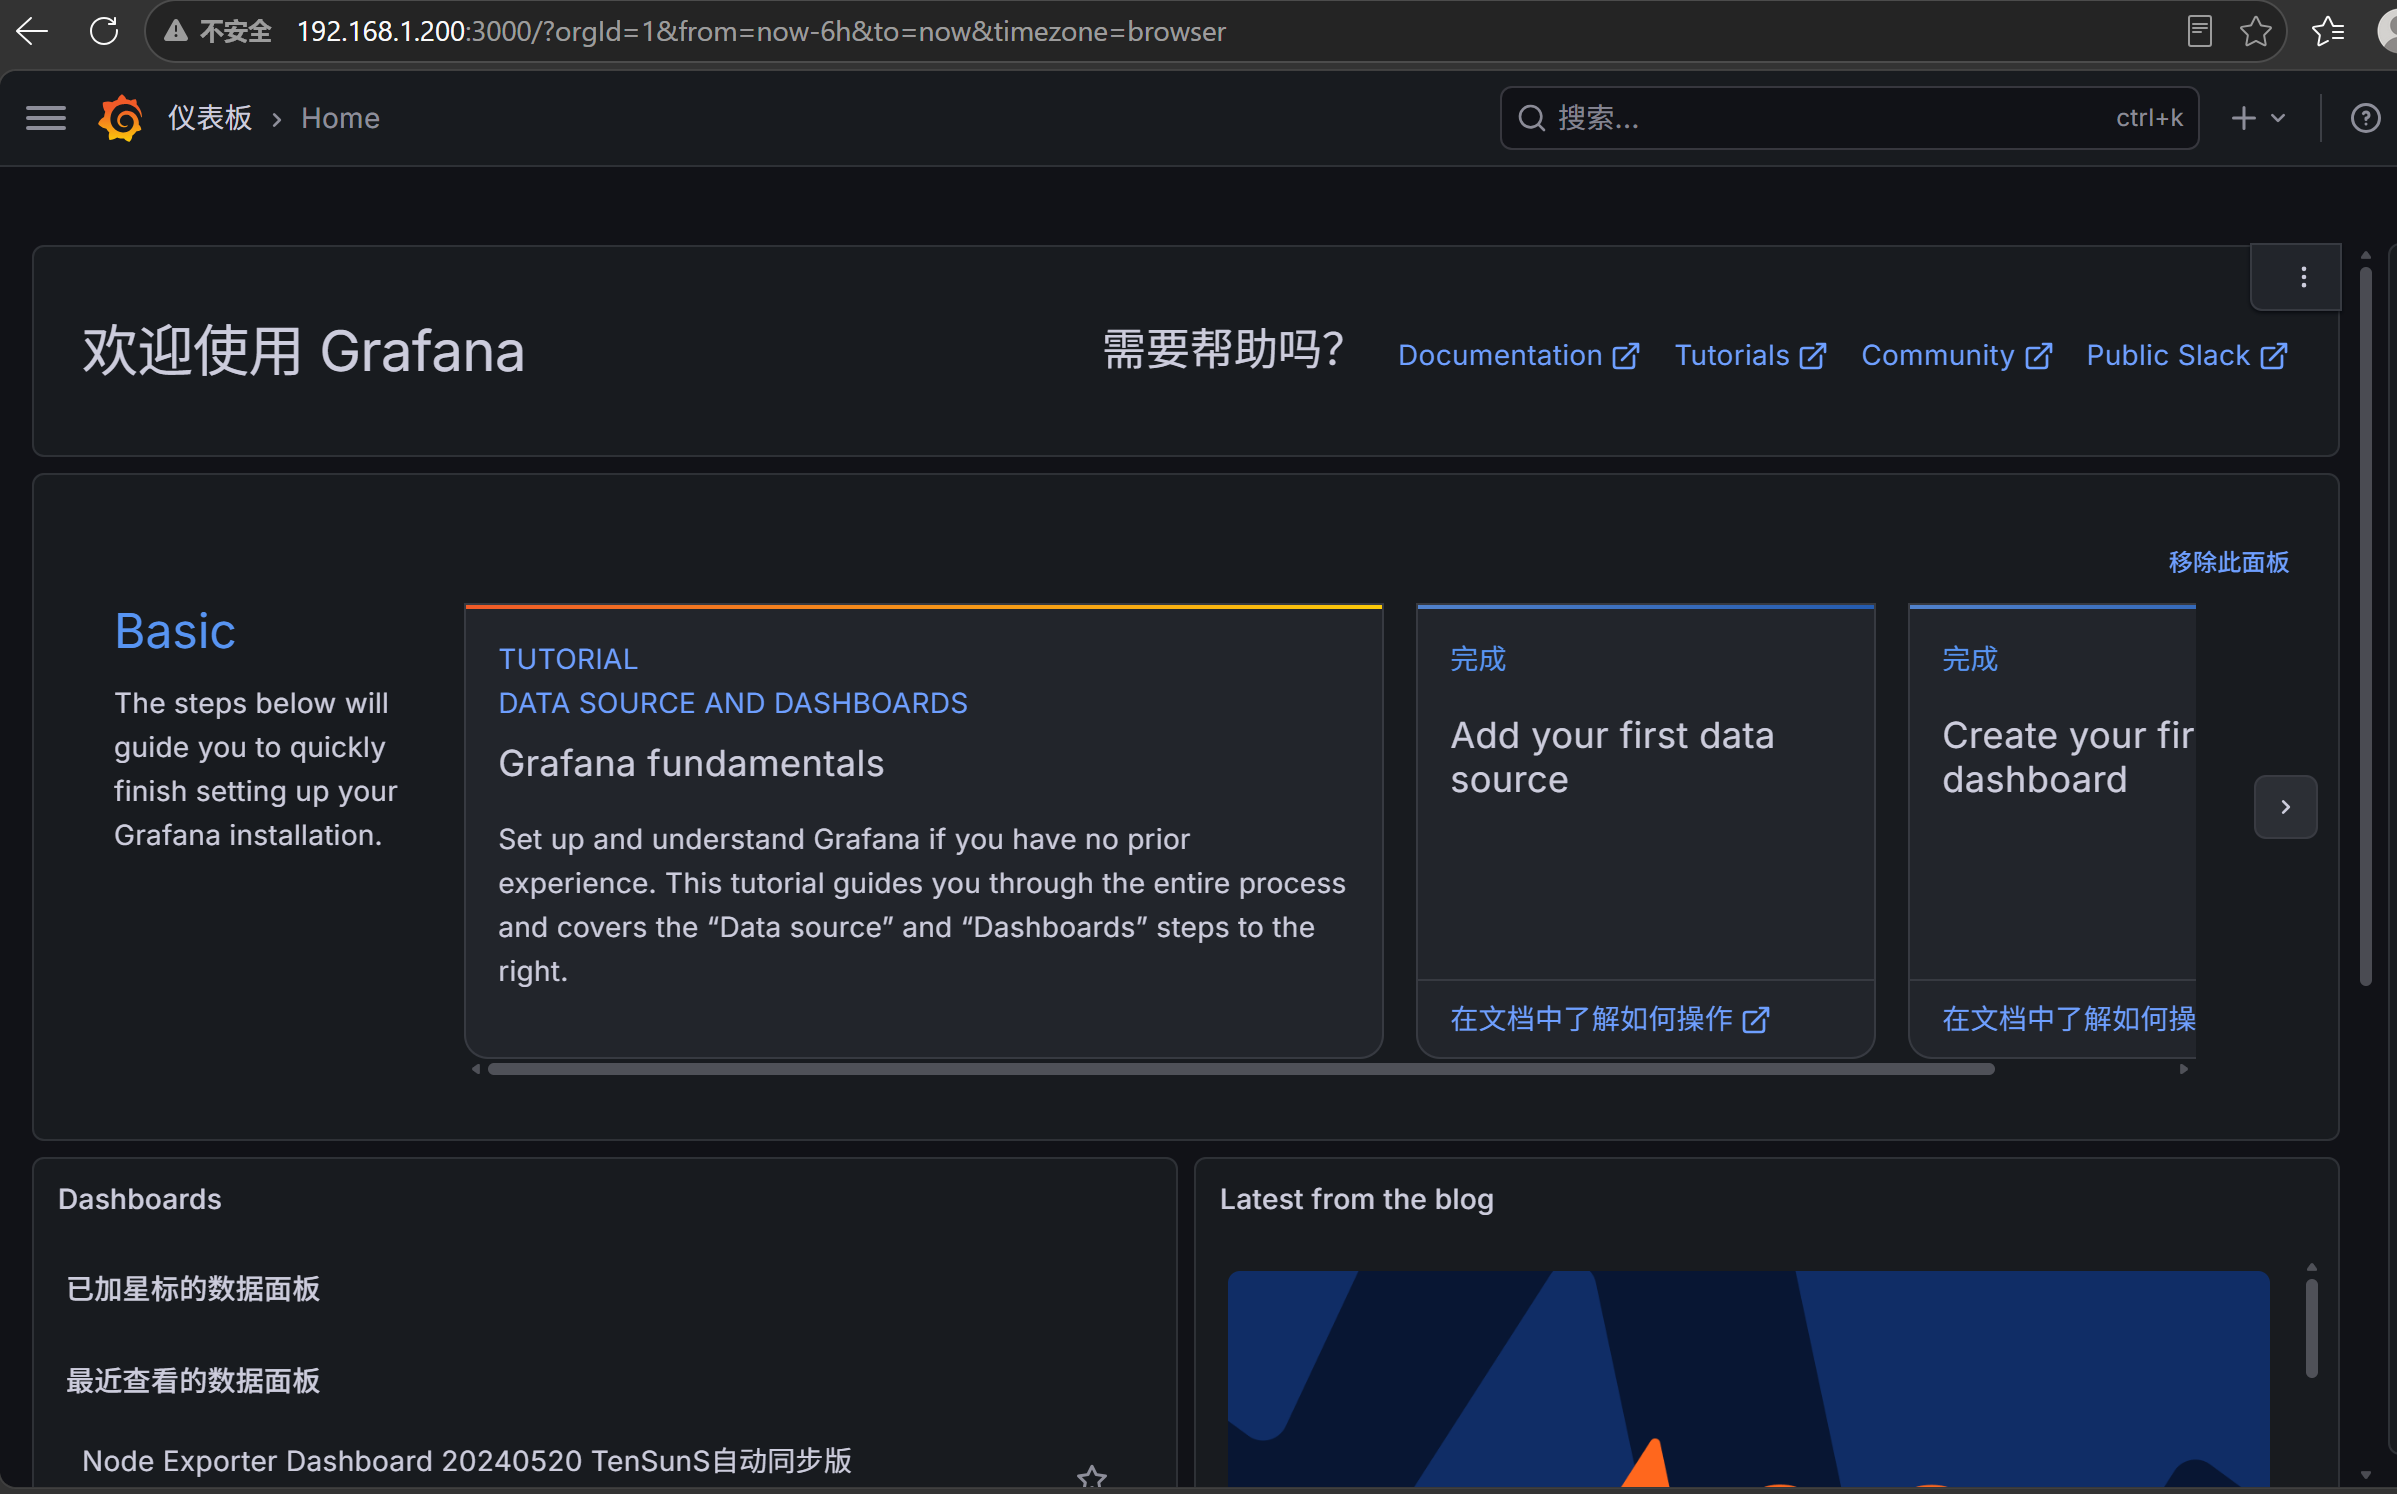
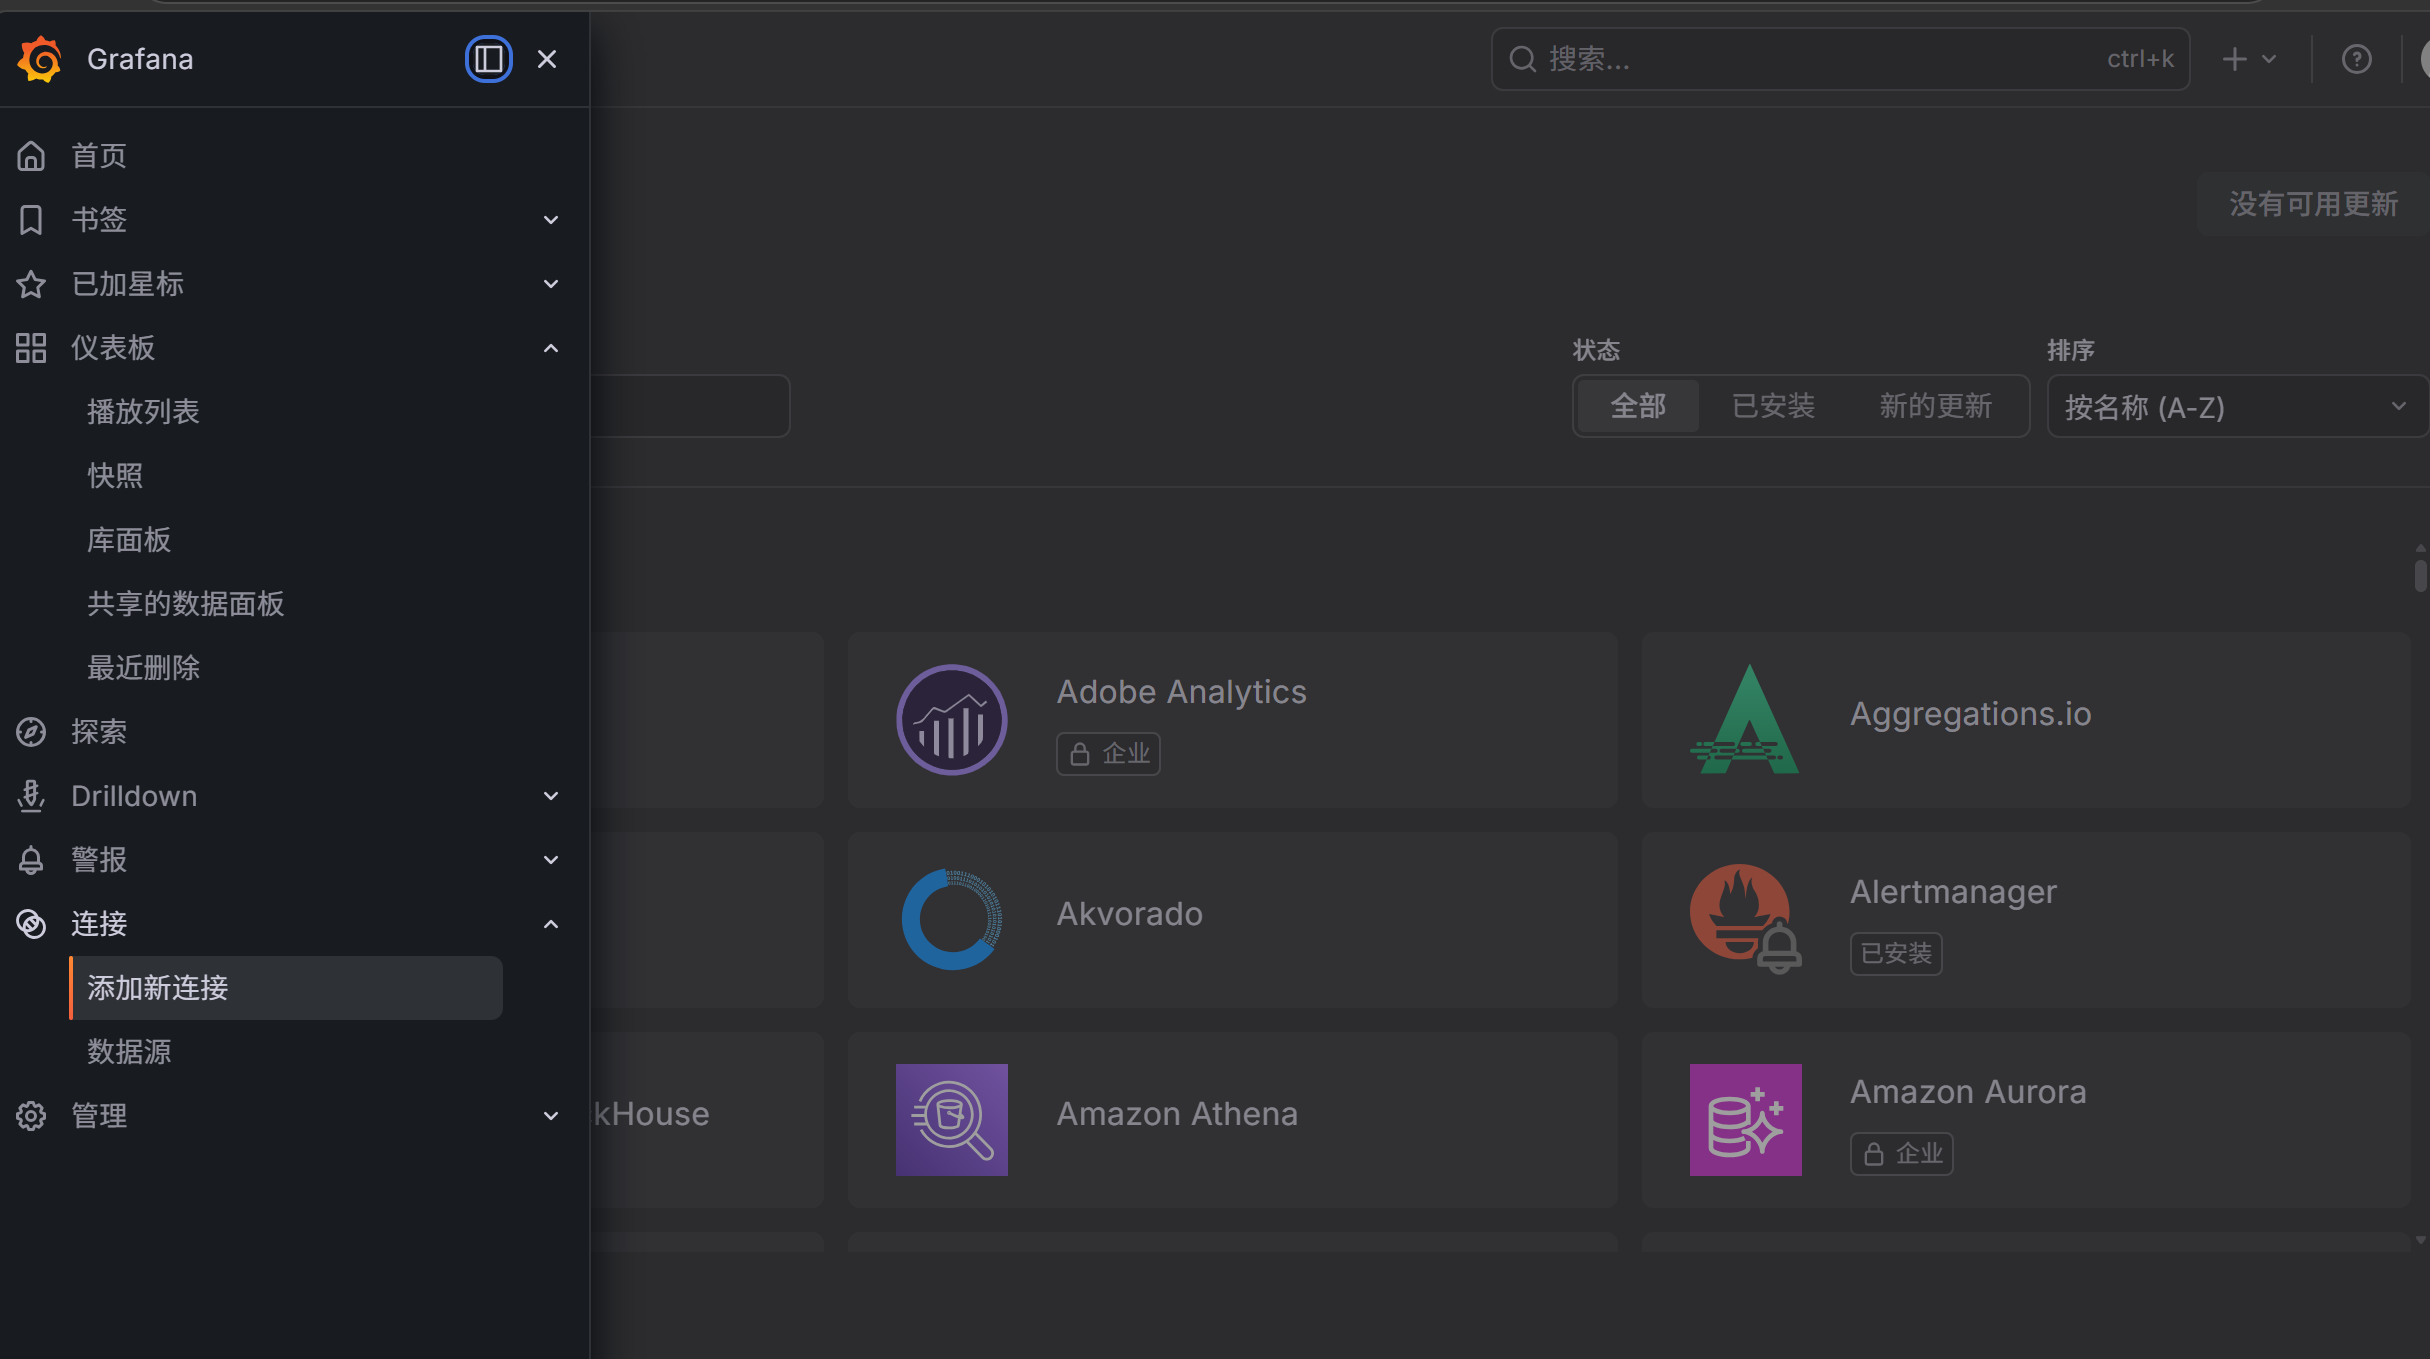
docker ps -a访问主机IP:3000就可以访问到grafana页面
加入MySQL到普罗米修斯(已有mysql容器和普罗米修斯容器)
docker exec -it mysql bash
mysql -uroot -p
CREATE USER 'exporter'@'%' IDENTIFIED WITH mysql_native_password BY '123456';
GRANT PROCESS, REPLICATION CLIENT ON *.* TO 'exporter'@'%';
GRANT SELECT ON performance_schema.* TO 'exporter'@'%';
GRANT SELECT ON sys.* TO 'exporter'@'%';
FLUSH PRIVILEGES;
bash
cat > /root/mysqld-exporter.cnf << EOF
[client]
user = exporter
password = 123456
host = 192.168.1.200
port = 3306
EOF
docker run -d \
--name mysqld-exporter \
--restart always \
-p 9104:9104 \
-v /root/mysqld-exporter.cnf:/.my.cnf \
prom/mysqld-exporter:v0.15.1

curl -X POST http://192.168.1.200:9090/-/reload