目录
[Metrics Server](#Metrics Server)
[安装Metrics Server](#安装Metrics Server)
[查看metrics-server Pod状态](#查看metrics-server Pod状态)
[测试 API 可用性](#测试 API 可用性)
[获取 Service 的访问地址](#获取 Service 的访问地址)
[安装压测工具(例如 hey 或 ab)](#安装压测工具(例如 hey 或 ab))
[多指标 HPA(CPU + 内存)](#多指标 HPA(CPU + 内存))
HPA概述
概念:
Kubernetes 的 Horizontal Pod Autoscaler (HPA) 是一个自动化的控制回路,其核心特点是能根据观察到的指标(如 CPU 利用率)自动调整 Pod 的副本数量。
核心机制与工作原理:
HPA 作为一个控制回路,周期性(默认 15 秒)地运行,其工作流程如下:
查询指标:从 metrics-server(资源指标)或自定义 API(自定义/外部指标)获取目标工作负载(如 Deployment)下所有 Pod 的指标数据。
计算期望副本数:根据所有 Pod 指标的平均值与设定的目标值进行比较,计算出一个期望的副本数。计算公式为:期望副本数 = ceil当前副本数 \* (当前指标平均值 / 期望指标值)。
执行扩缩容:将 spec.replicas 调整为计算出的期望副本数,但结果会受到 minReplicas 和 maxReplicas 的限制。
扩缩容特点:
快速扩容,谨慎缩容。默认值:扩容稳定窗口为 0 秒(立即扩容),缩容稳定窗口为 300 秒(5分钟)。窗口期内,HPA 会持续观察并记录多个期望副本数,缩容时,会从窗口内的所有期望值中选择最大的一个副本数,以避免因指标瞬时下降而误缩容。扩容时,则会选择最小的一个副本数,避免因指标瞬时飙升而过度扩容。
Metrics Server
Metrics Server是 Kubernetes 集群的"资源数据采集中心",专门负责收集所有 Node 和 Pod 的 CPU、内存实时使用数据,并通过标准 API 提供给 HPA、kubectl top 等组件使用。
安装Metrics Server
[root@k8s-master01 metrics]# kubectl apply -f https://github.com/kubernetes-sigs/metrics-server/releases/latest/download/components.yaml
serviceaccount/metrics-server created
clusterrole.rbac.authorization.k8s.io/system:aggregated-metrics-reader created
clusterrole.rbac.authorization.k8s.io/system:metrics-server created
rolebinding.rbac.authorization.k8s.io/metrics-server-auth-reader created
clusterrolebinding.rbac.authorization.k8s.io/metrics-server:system:auth-delegator created
clusterrolebinding.rbac.authorization.k8s.io/system:metrics-server created
service/metrics-server created
deployment.apps/metrics-server created
apiservice.apiregistration.k8s.io/v1beta1.metrics.k8s.io created
[root@k8s-master01 metrics]#
查看metrics-server Pod状态
READY(就绪):显示 1/1 表示容器已启动且健康检查通过,可以正常提供服务。如果显示 0/1,说明启动失败或健康检查未通过。
STATUS(状态):必须是 Running 才算正常。
[root@k8s-master01 metrics]# kubectl get pods -n kube-system | grep metrics-server
metrics-server-84c7d8c58-cw4fn             0/1     ImagePullBackOff   0              87s

[root@k8s-master01 metrics]# kubectl get pods -n kube-system | grep metrics-server
metrics-server-84c7d8c58-cw4fn             0/1     ImagePullBackOff   0              87s
[root@k8s-master01 metrics]# kubectl get pods -n kube-system | grep metrics-server
metrics-server-84c7d8c58-cw4fn             0/1     ErrImagePull   0              107s
[root@k8s-master01 metrics]# kubectl get pods -n kube-system | grep metrics-server
metrics-server-84c7d8c58-cw4fn             0/1     ImagePullBackOff   0              113s
[root@k8s-master01 metrics]#
从结果看,不是1/1 Running,说明不正常。
经检查发现镜像下载不下来,编辑镜像地址
[root@k8s-master01 metrics]# kubectl edit deployment metrics-server -n kube-system
deployment.apps/metrics-server edited
[root@k8s-master01 metrics]#
把原来的镜像
registry.k8s.io/metrics-server/metrics-server:v0.8.1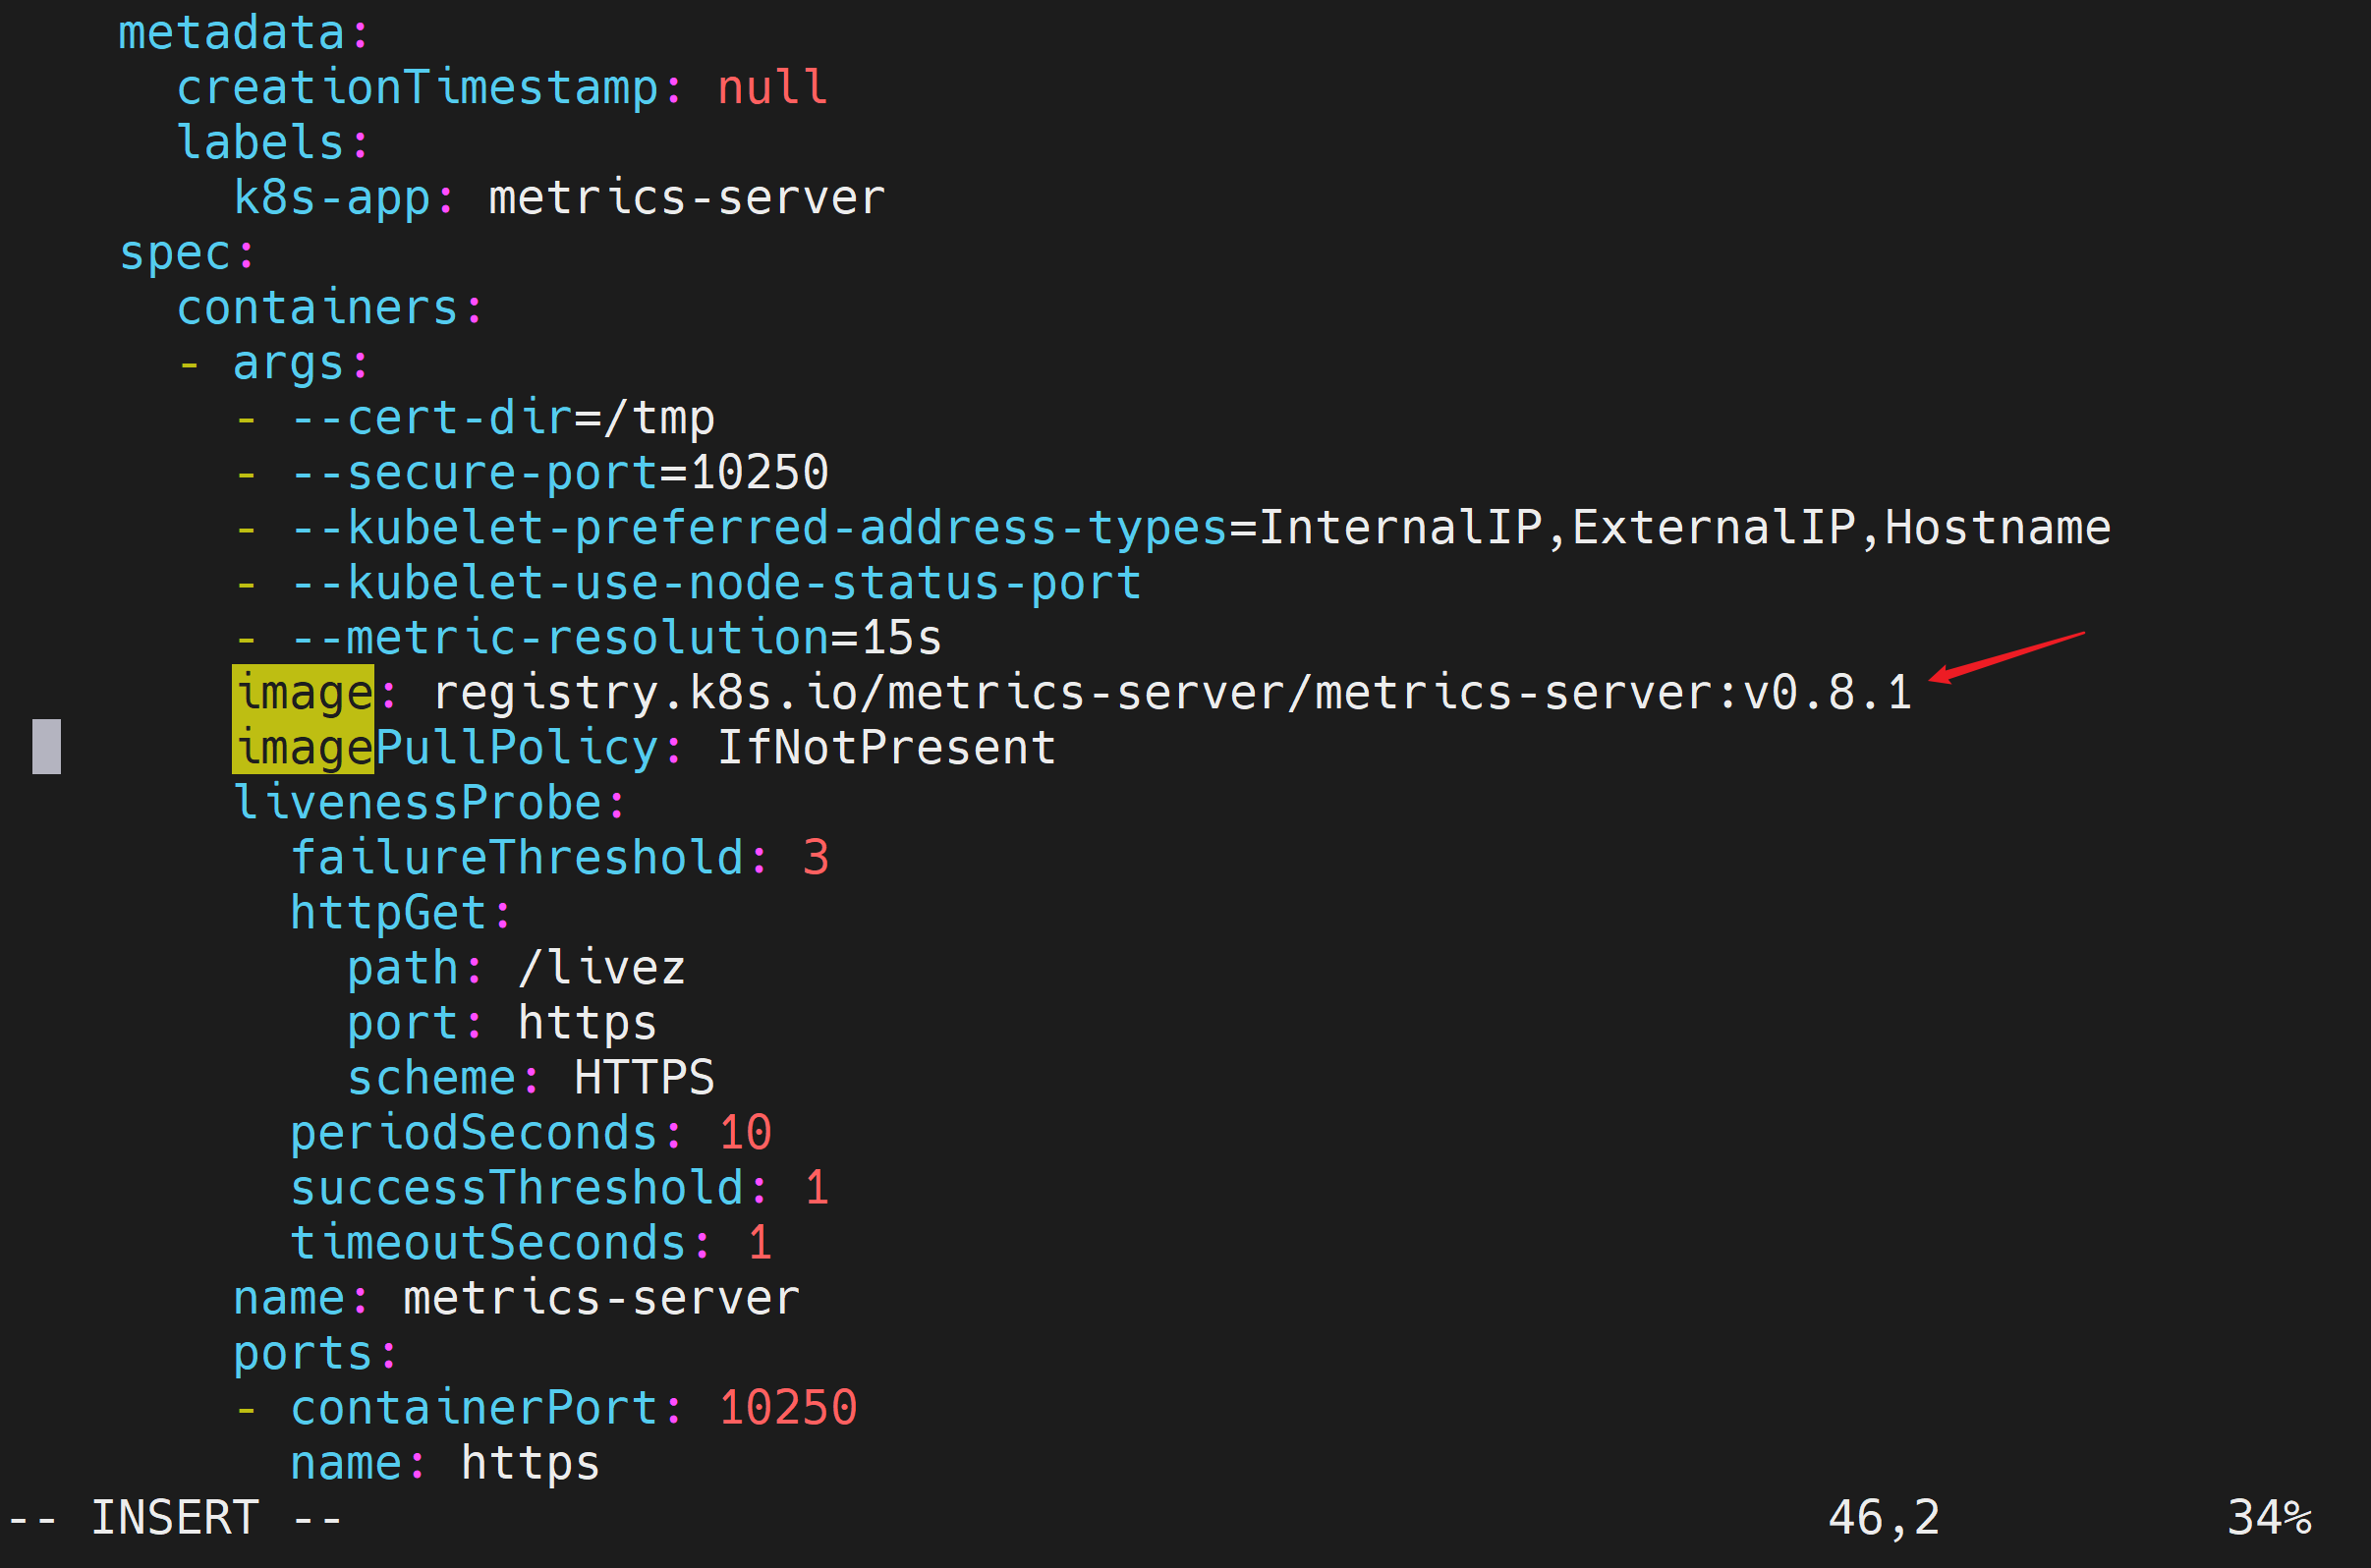
修改为如下镜像地址
registry.cn-hangzhou.aliyuncs.com/google_containers/metrics-server:v0.8.1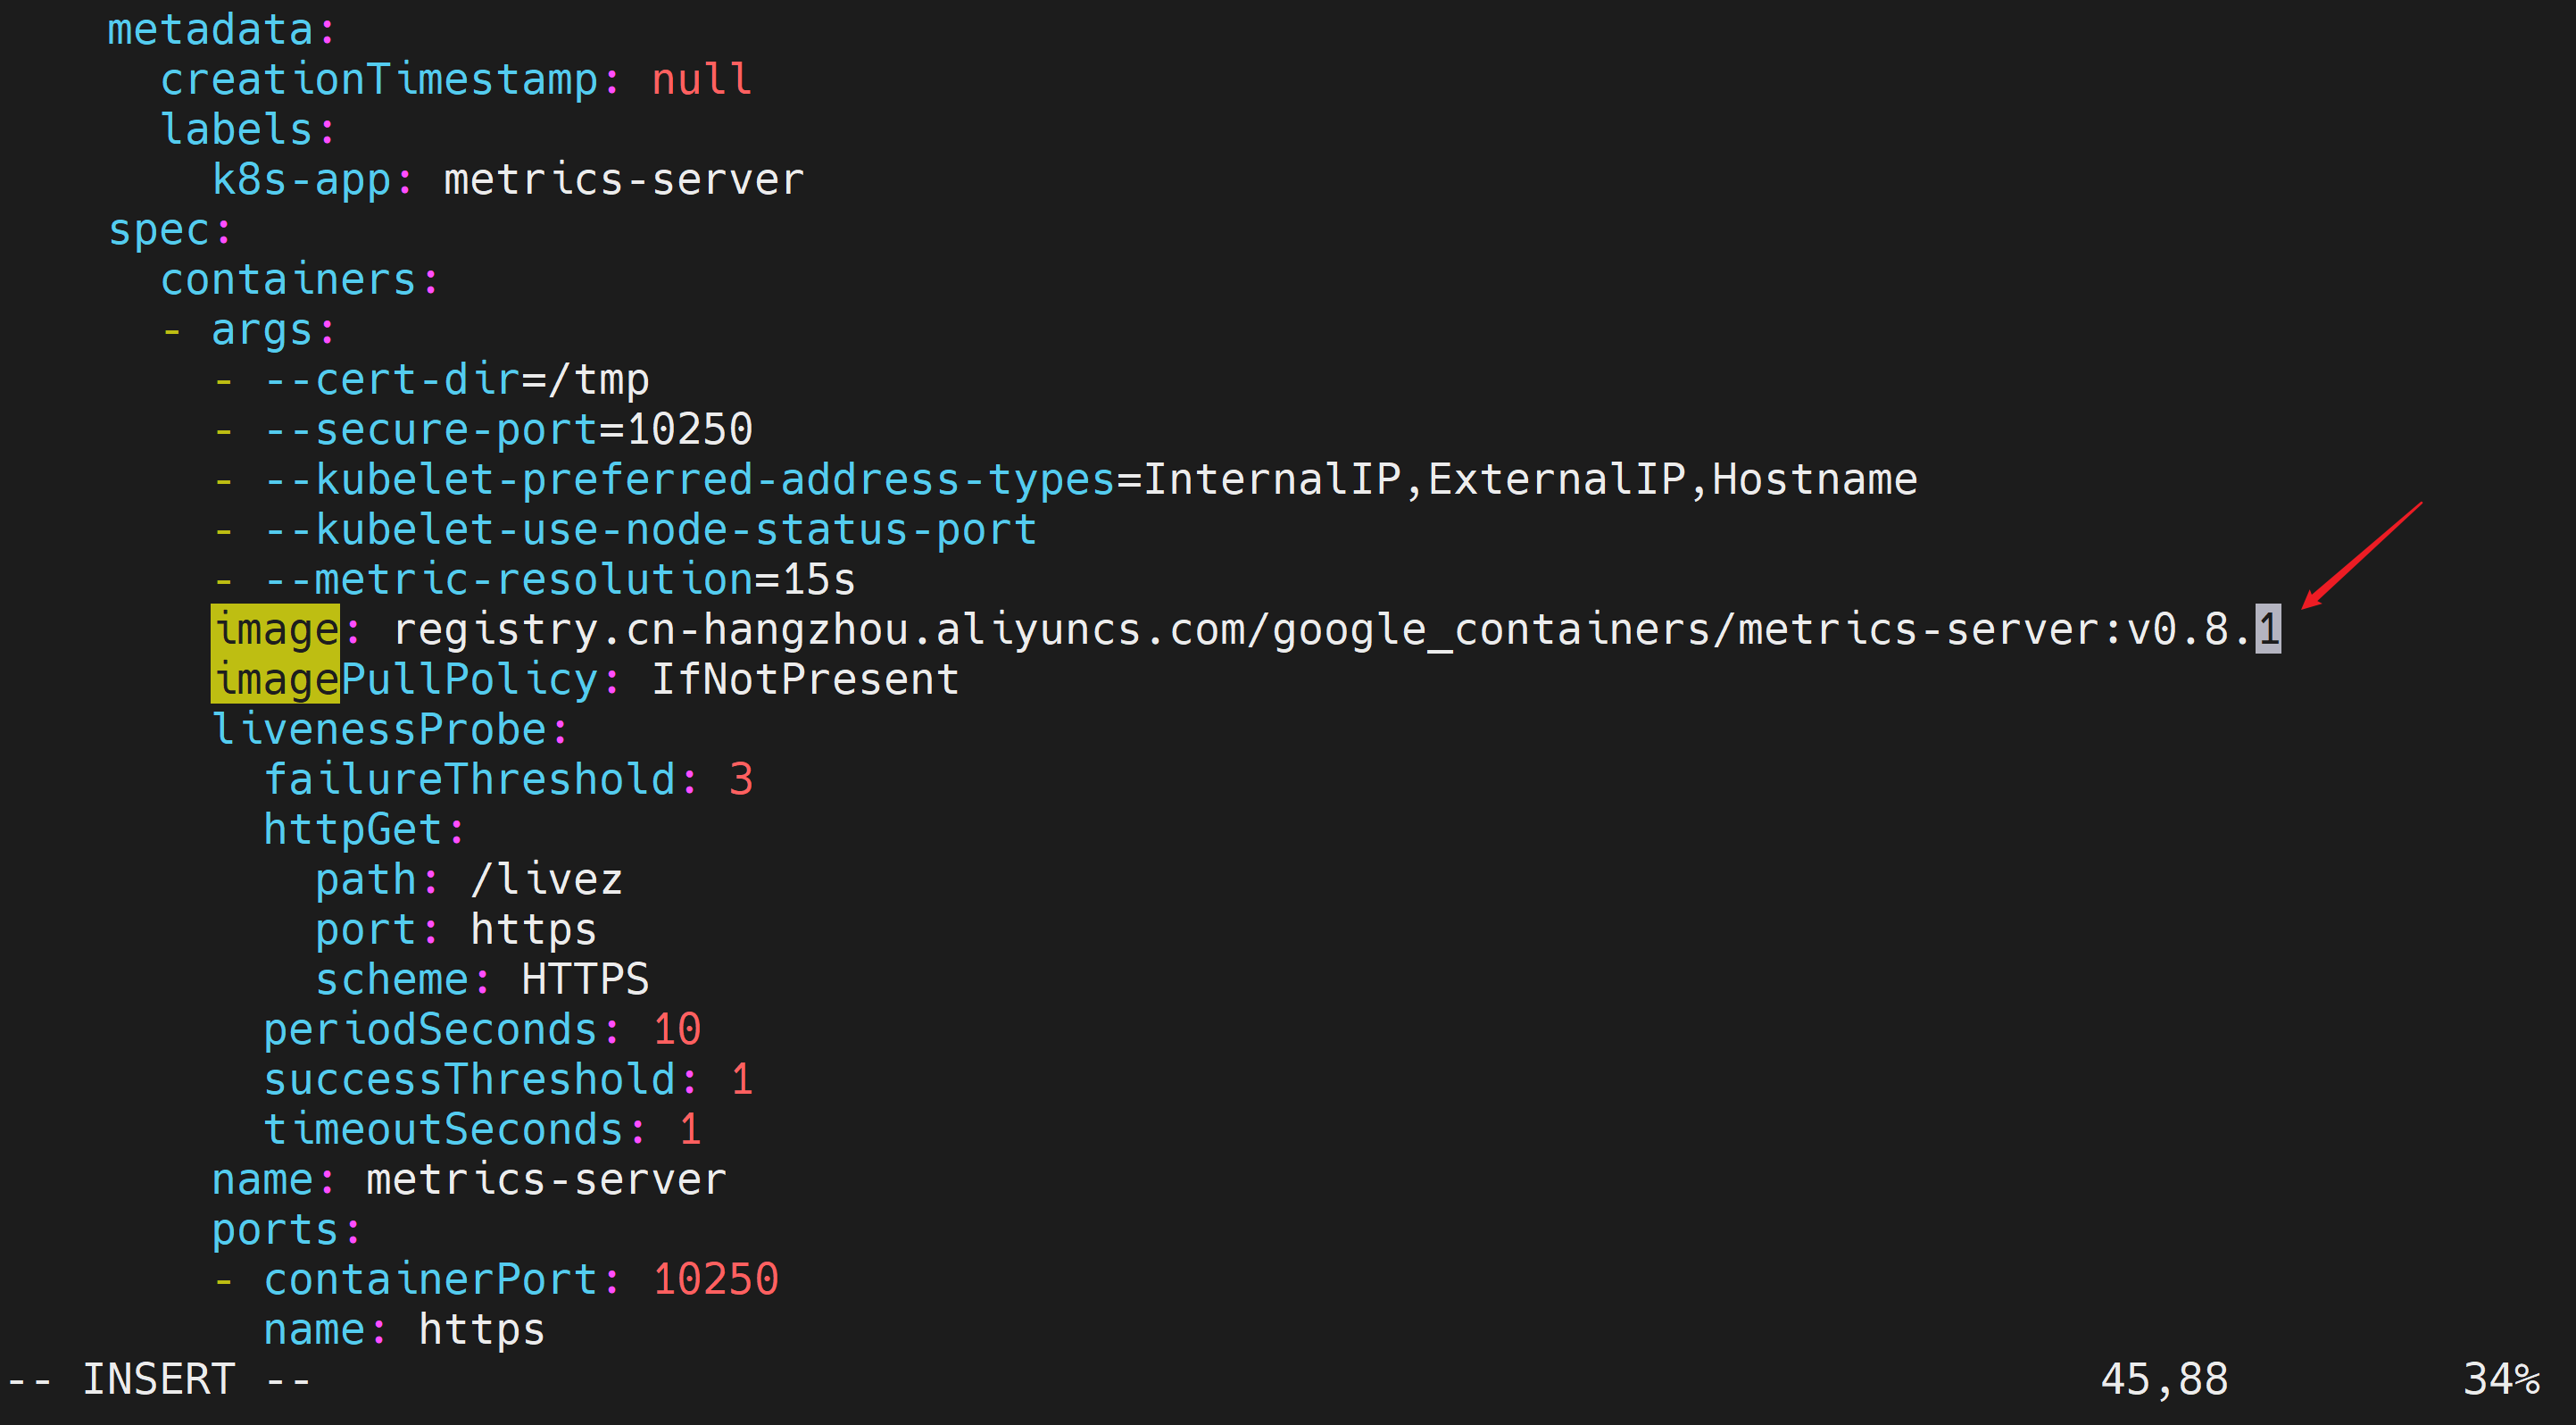
保存退出(和vi命令保存方法一致)
查看metrics-server Pod状态
[root@k8s-master01 metrics]# kubectl get pods -n kube-system | grep metrics-server
metrics-server-7cdb4f6f76-vh96m            0/1     Running            0              51s
metrics-server-84c7d8c58-bx7dh             0/1     ImagePullBackOff   0              5m48s
[root@k8s-master01 metrics]# kubectl get pods -n kube-system | grep metrics-server
metrics-server-7cdb4f6f76-vh96m            0/1     Running            0              52s
metrics-server-84c7d8c58-bx7dh             0/1     ImagePullBackOff   0              5m49s
[root@k8s-master01 metrics]# kubectl get pods -n kube-system | grep metrics-server
metrics-server-7cdb4f6f76-vh96m            0/1     Running            0              53s
metrics-server-84c7d8c58-bx7dh             0/1     ImagePullBackOff   0              5m50s
[root@k8s-master01 metrics]# kubectl get pods -n kube-system | grep metrics-server
metrics-server-7cdb4f6f76-vh96m            0/1     Running            0              54s
metrics-server-84c7d8c58-bx7dh             0/1     ImagePullBackOff   0              5m51s
[root@k8s-master01 metrics]# kubectl get pods -n kube-system | grep metrics-server
metrics-server-7cdb4f6f76-vh96m            0/1     Running            0              55s
metrics-server-84c7d8c58-bx7dh             0/1     ImagePullBackOff   0              5m52s
[root@k8s-master01 metrics]# kubectl delete pod metrics-server-84c7d8c58-bx7dh -n kube-system
pod "metrics-server-84c7d8c58-bx7dh" deleted
[root@k8s-master01 metrics]# kubectl delete rs metrics-server-84c7d8c58 -n kube-system
replicaset.apps "metrics-server-84c7d8c58" deleted
[root@k8s-master01 metrics]# kubectl get pods -n kube-system | grep metrics-server
metrics-server-7cdb4f6f76-vh96m            0/1     Running   0              3m51s
看到0/1 Running,说明未就绪
排查问题
[root@k8s-master01 metrics]# kubectl describe pod metrics-server-7cdb4f6f76-vh96m -n kube-system
Name:                 metrics-server-7cdb4f6f76-vh96m
Namespace:            kube-system
Priority:             2000000000
Priority Class Name:  system-cluster-critical
Service Account:      metrics-server
Node:                 k8s-node01/192.168.204.102
Start Time:           Sun, 14 Jun 2026 00:18:53 +0800
Labels:               k8s-app=metrics-server
                      pod-template-hash=7cdb4f6f76
Annotations:          cni.projectcalico.org/containerID: 2254575903eb886a815025558f386b5310c595692be2921f8f5cab844afc8cc8
                      cni.projectcalico.org/podIP: 10.244.85.247/32
                      cni.projectcalico.org/podIPs: 10.244.85.247/32
Status:               Running
IP:                   10.244.85.247
IPs:
  IP:           10.244.85.247
Controlled By:  ReplicaSet/metrics-server-7cdb4f6f76
Containers:
  metrics-server:
    Container ID:    docker://074410d0608036ec8bb65949128b6cae70890f8cc7bf5be4b196dd246958b602
    Image:           registry.cn-hangzhou.aliyuncs.com/google_containers/metrics-server:v0.8.1
    Image ID:        docker-pullable://registry.cn-hangzhou.aliyuncs.com/google_containers/metrics-server@sha256:24301f788bfea02750c8a4a522c0bdf36ab83edf99780bc843ec23a5706610a0
    Port:            10250/TCP
    Host Port:       0/TCP
    SeccompProfile:  RuntimeDefault
    Args:
      --cert-dir=/tmp
      --secure-port=10250
      --kubelet-preferred-address-types=InternalIP,ExternalIP,Hostname
      --kubelet-use-node-status-port
      --metric-resolution=15s
    State:          Running
      Started:      Sun, 14 Jun 2026 00:18:54 +0800
    Ready:          False
    Restart Count:  0
    Requests:
      cpu:        100m
      memory:     200Mi
    Liveness:     http-get https://:https/livez delay=0s timeout=1s period=10s #success=1 #failure=3
    Readiness:    http-get https://:https/readyz delay=20s timeout=1s period=10s #success=1 #failure=3
    Environment:  <none>
    Mounts:
      /tmp from tmp-dir (rw)
      /var/run/secrets/kubernetes.io/serviceaccount from kube-api-access-qtpcs (ro)
Conditions:
  Type                        Status
  PodReadyToStartContainers   True
  Initialized                 True
  Ready                       False
  ContainersReady             False
  PodScheduled                True
Volumes:
  tmp-dir:
    Type:       EmptyDir (a temporary directory that shares a pod's lifetime)
    Medium:
    SizeLimit:  <unset>
  kube-api-access-qtpcs:
    Type:                    Projected (a volume that contains injected data from multiple sources)
    TokenExpirationSeconds:  3607
    ConfigMapName:           kube-root-ca.crt
    ConfigMapOptional:       <nil>
    DownwardAPI:             true
QoS Class:                   Burstable
Node-Selectors:              kubernetes.io/os=linux
Tolerations:                 node.kubernetes.io/not-ready:NoExecute op=Exists for 300s
                             node.kubernetes.io/unreachable:NoExecute op=Exists for 300s
Events:
  Type     Reason     Age                   From               Message
  ----     ------     ----                  ----               -------
  Normal   Scheduled  5m                    default-scheduler  Successfully assigned kube-system/metrics-server-7cdb4f6f76-vh96m to k8s-node01
  Normal   Pulled     5m                    kubelet            Container image "registry.cn-hangzhou.aliyuncs.com/google_containers/metrics-server:v0.8.1" already present on machine
  Normal   Created    5m                    kubelet            Created container metrics-server
  Normal   Started    4m59s                 kubelet            Started container metrics-server
  Warning  Unhealthy  90s (x22 over 4m40s)  kubelet            Readiness probe failed: HTTP probe failed with statuscode: 500
[root@k8s-master01 metrics]#
发现Readiness probe failed: HTTP probe failed with statuscode: 500问题,说明Kubernetes 对 Metrics Server 的健康检查(/readyz 接口)发出了请求,但 Metrics Server 返回500错误。
编辑metrics-server部署资源配置
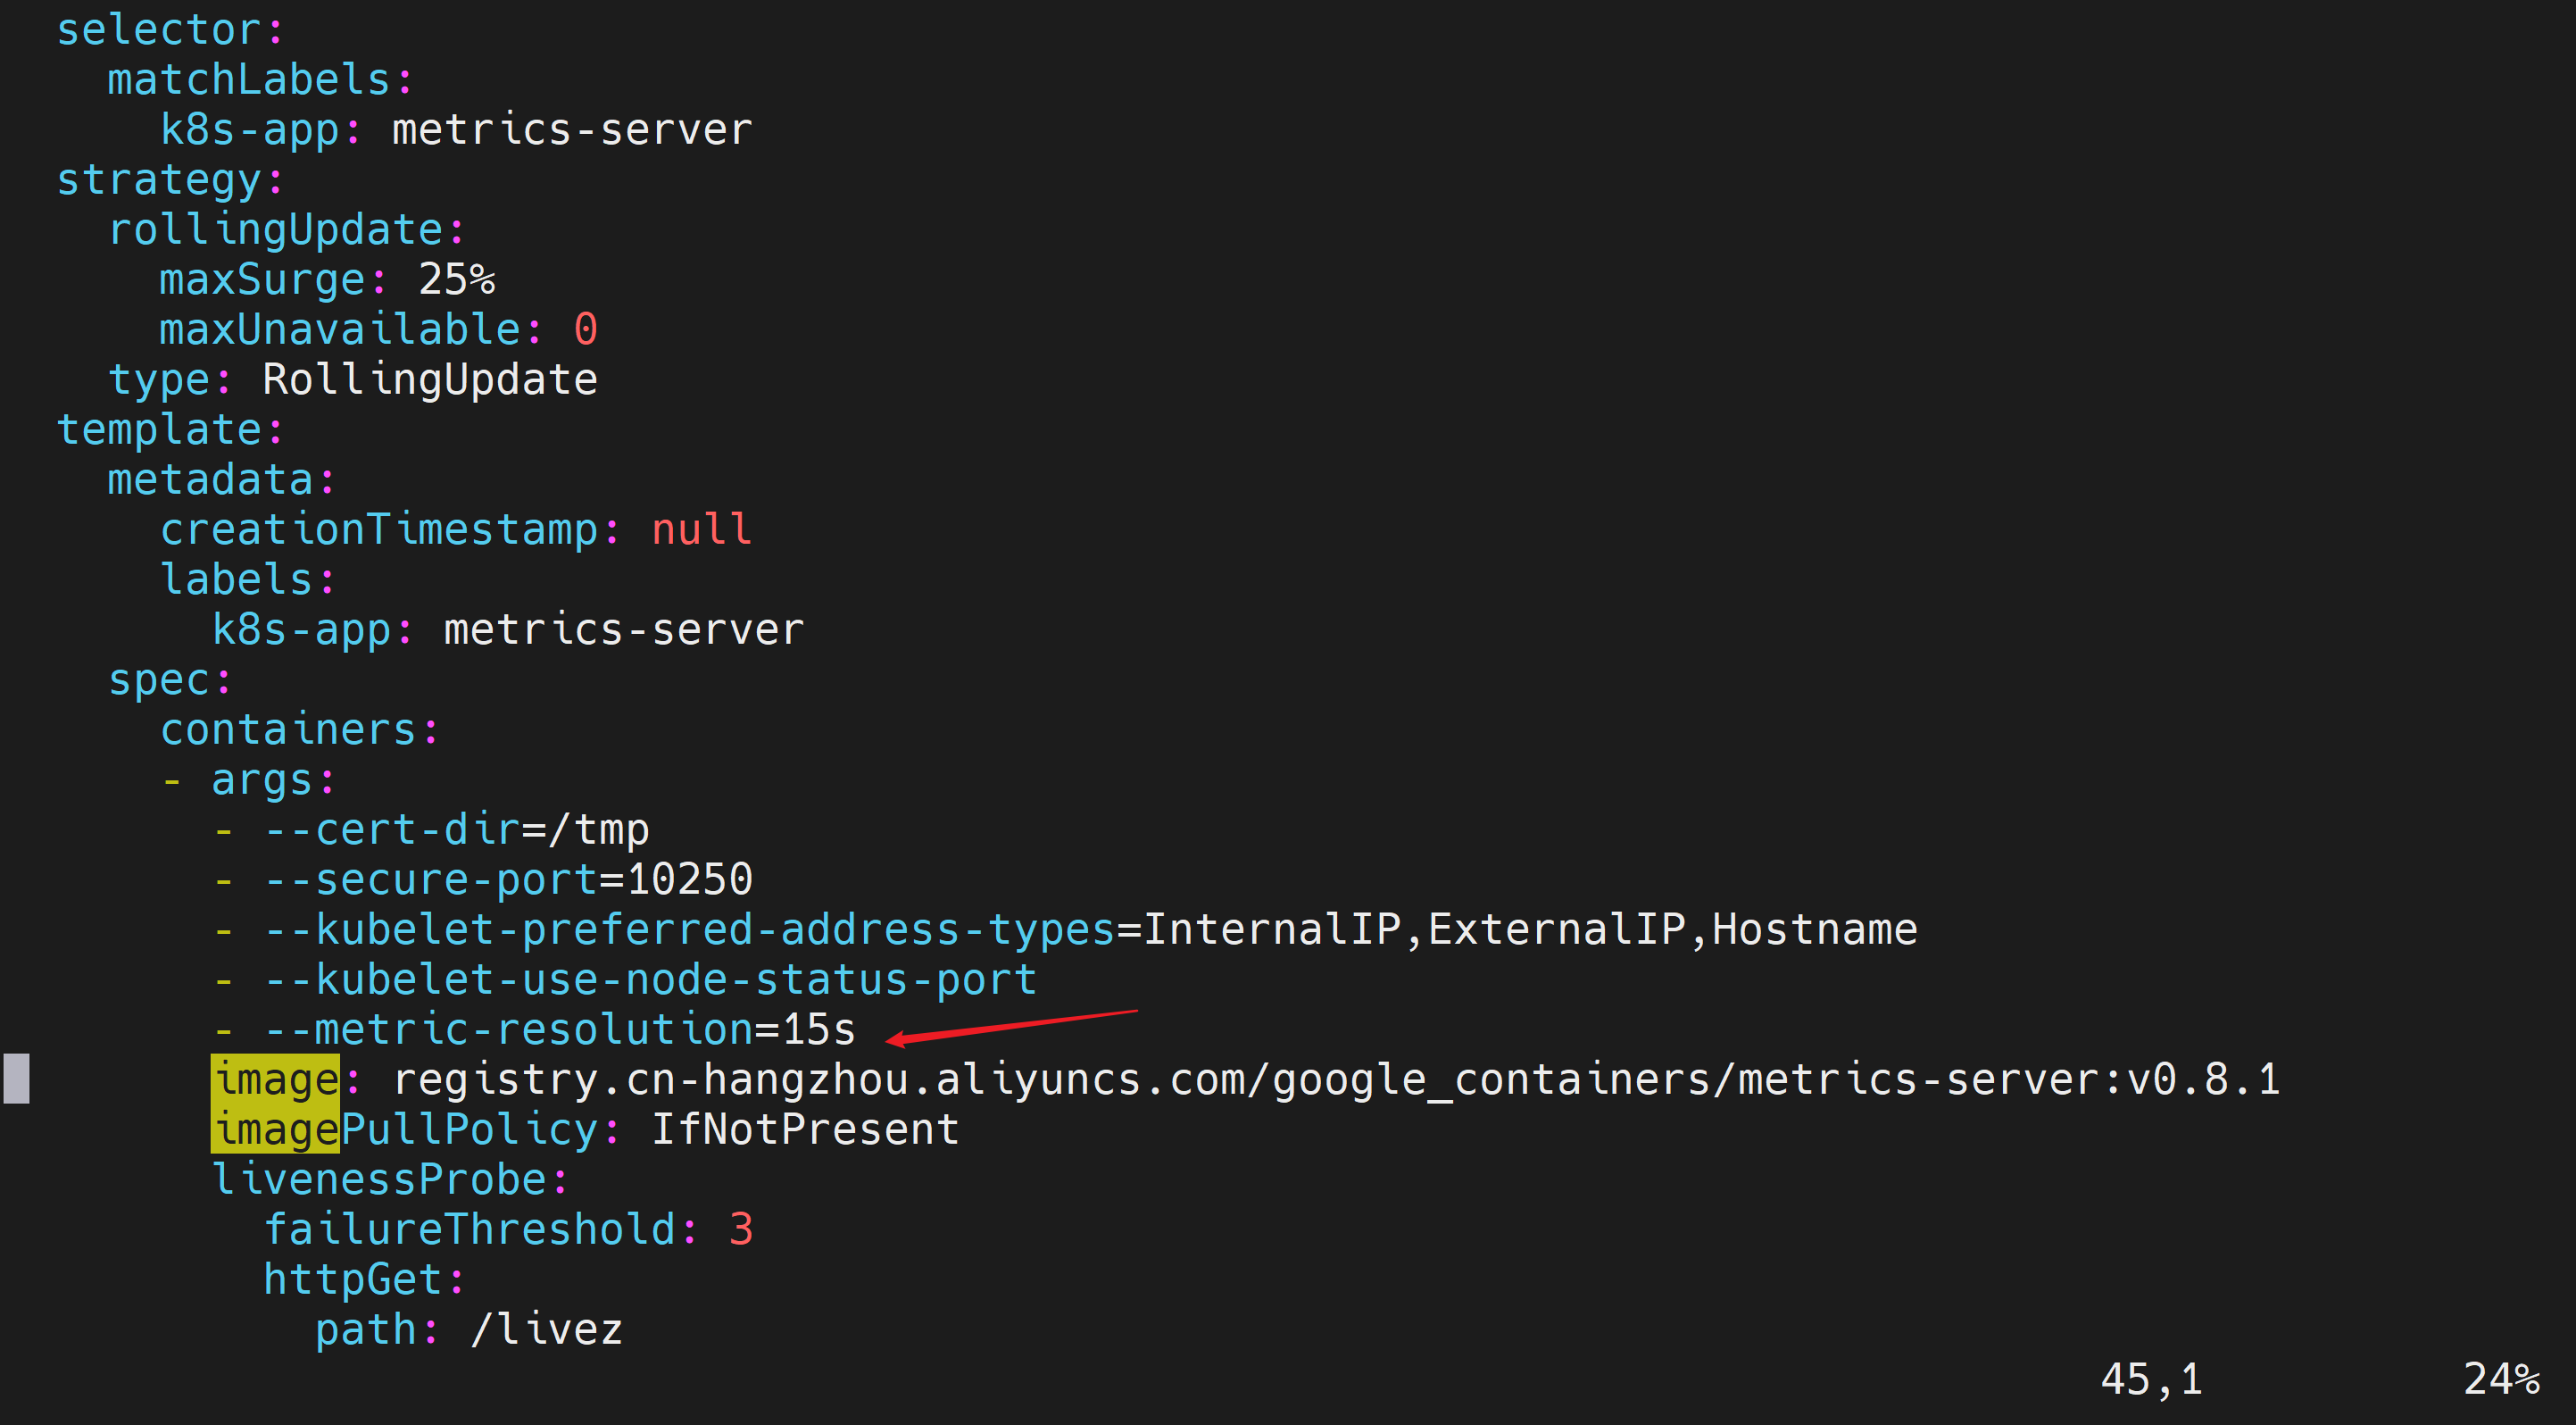
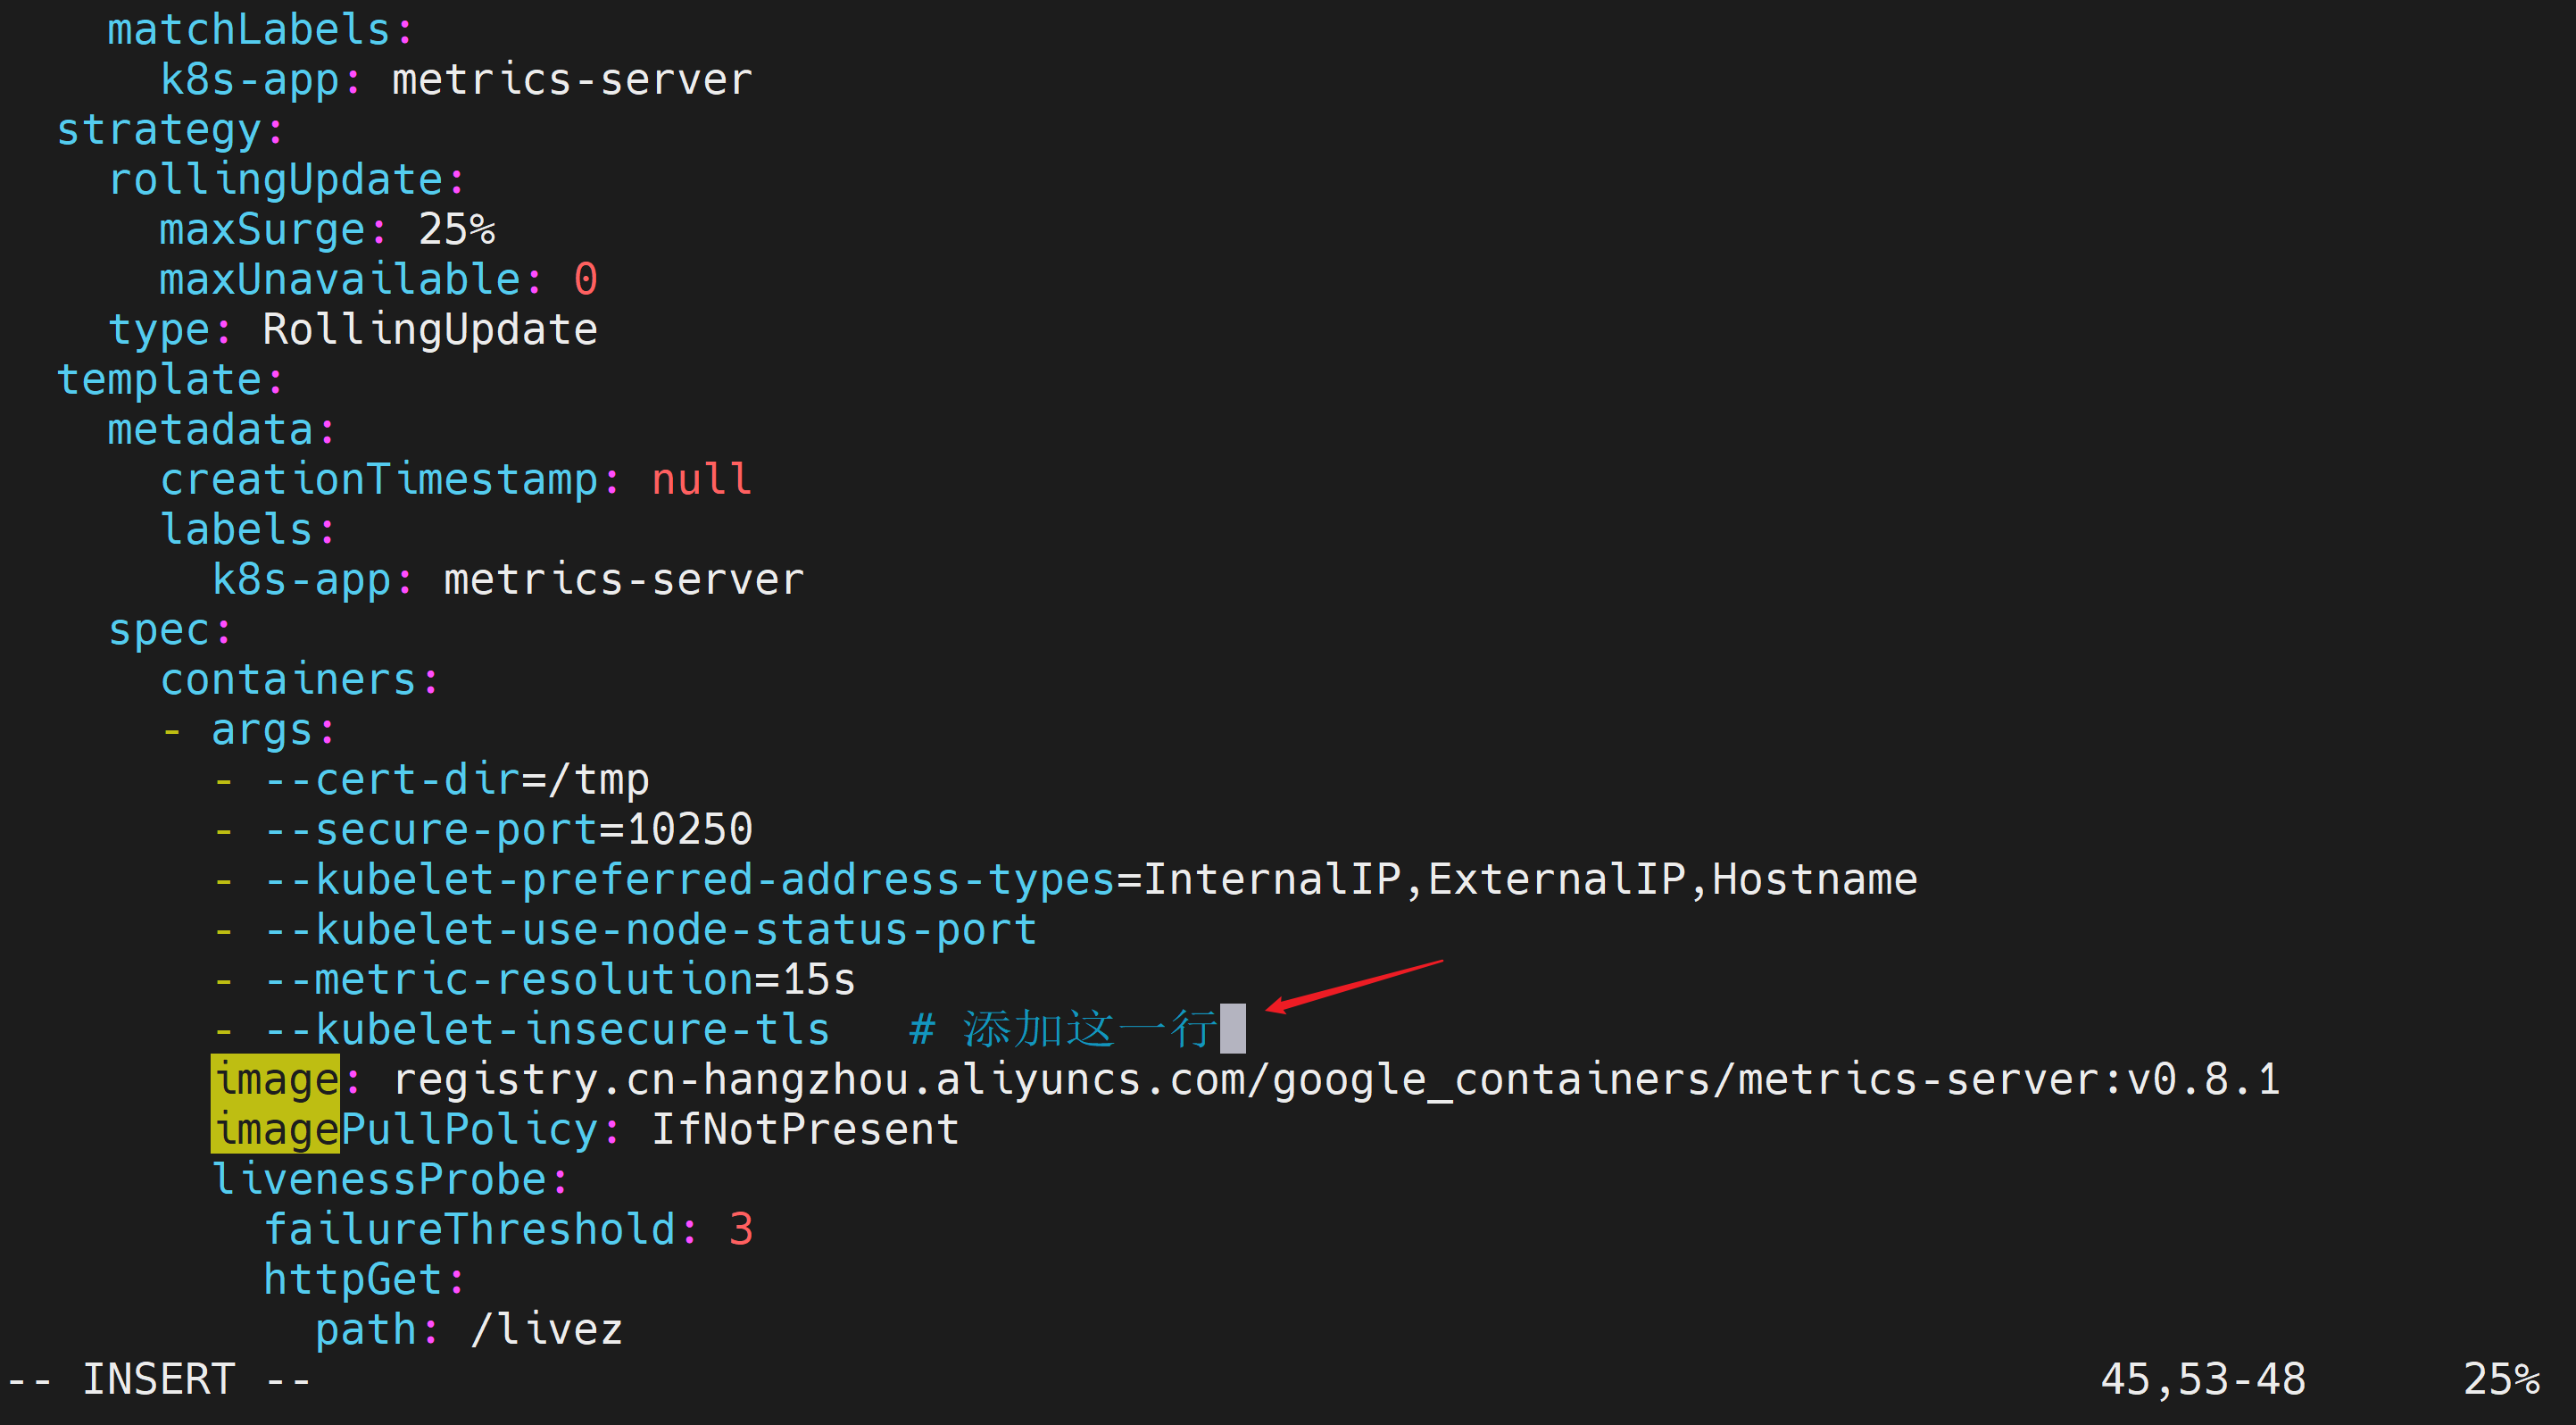
[root@k8s-master01 metrics]# kubectl edit deployment metrics-server -n kube-system在 spec.template.spec.containers0.args 中添加一行 --kubelet-insecure-tls。
修改前
添加内容
- --kubelet-insecure-tls修改后
等待一会后,查询pod状态,为 1/1 Running,说明正常可用。
[root@k8s-master01 metrics]# kubectl get pods -n kube-system | grep metrics-server
metrics-server-678895c74f-vztdq            0/1     Running   0              16s
metrics-server-7cdb4f6f76-vh96m            0/1     Running   0              8m44s
[root@k8s-master01 metrics]# kubectl get pods -n kube-system | grep metrics-server
metrics-server-678895c74f-vztdq            1/1     Running   0              2m21s
[root@k8s-master01 metrics]#
测试 API 可用性
预期结果:kubectl top 能返回 CPU/内存数据(即使数值为 0)。若无数据,请检查 Metrics Server Pod 日志。
# 查看节点CPU/内存数据
[root@k8s-master01 metrics]# kubectl top nodes
NAME CPU(cores) CPU% MEMORY(bytes) MEMORY%
k8s-master01 172m 4% 2078Mi 58%
k8s-node01 88m 2% 1138Mi 32%
k8s-node02 98m 2% 1284Mi 36%
# 看所有PodsCPU/内存数据
[root@k8s-master01 metrics]# kubectl top pods -A
NAMESPACE NAME CPU(cores) MEMORY(bytes)
kube-system calico-kube-controllers-7fbd86d5c5-k2nd8 1m 58Mi
kube-system calico-node-qfqqc 30m 201Mi
kube-system calico-node-vz7zx 24m 192Mi
kube-system calico-node-z6p7k 28m 198Mi
kube-system calico-typha-669c48c58c-sf7km 3m 62Mi
kube-system coredns-855c4dd65d-l4rcc 2m 17Mi
kube-system coredns-855c4dd65d-qrjlk 2m 60Mi
kube-system etcd-k8s-master01 23m 227Mi
kube-system kube-apiserver-k8s-master01 40m 540Mi
kube-system kube-controller-manager-k8s-master01 12m 130Mi
kube-system kube-proxy-pwdvj 1m 79Mi
kube-system kube-proxy-wt7gl 1m 80Mi
kube-system kube-proxy-xc6gt 1m 80Mi
kube-system kube-scheduler-k8s-master01 3m 70Mi
kube-system metrics-server-678895c74f-vztdq 3m 20Mi
metallb-system controller-cd8c9874-5vl4c 3m 63Mi
metallb-system speaker-6vmp7 4m 64Mi
metallb-system speaker-pqr96 4m 65Mi
metallb-system speaker-pztv2 4m 64Mi
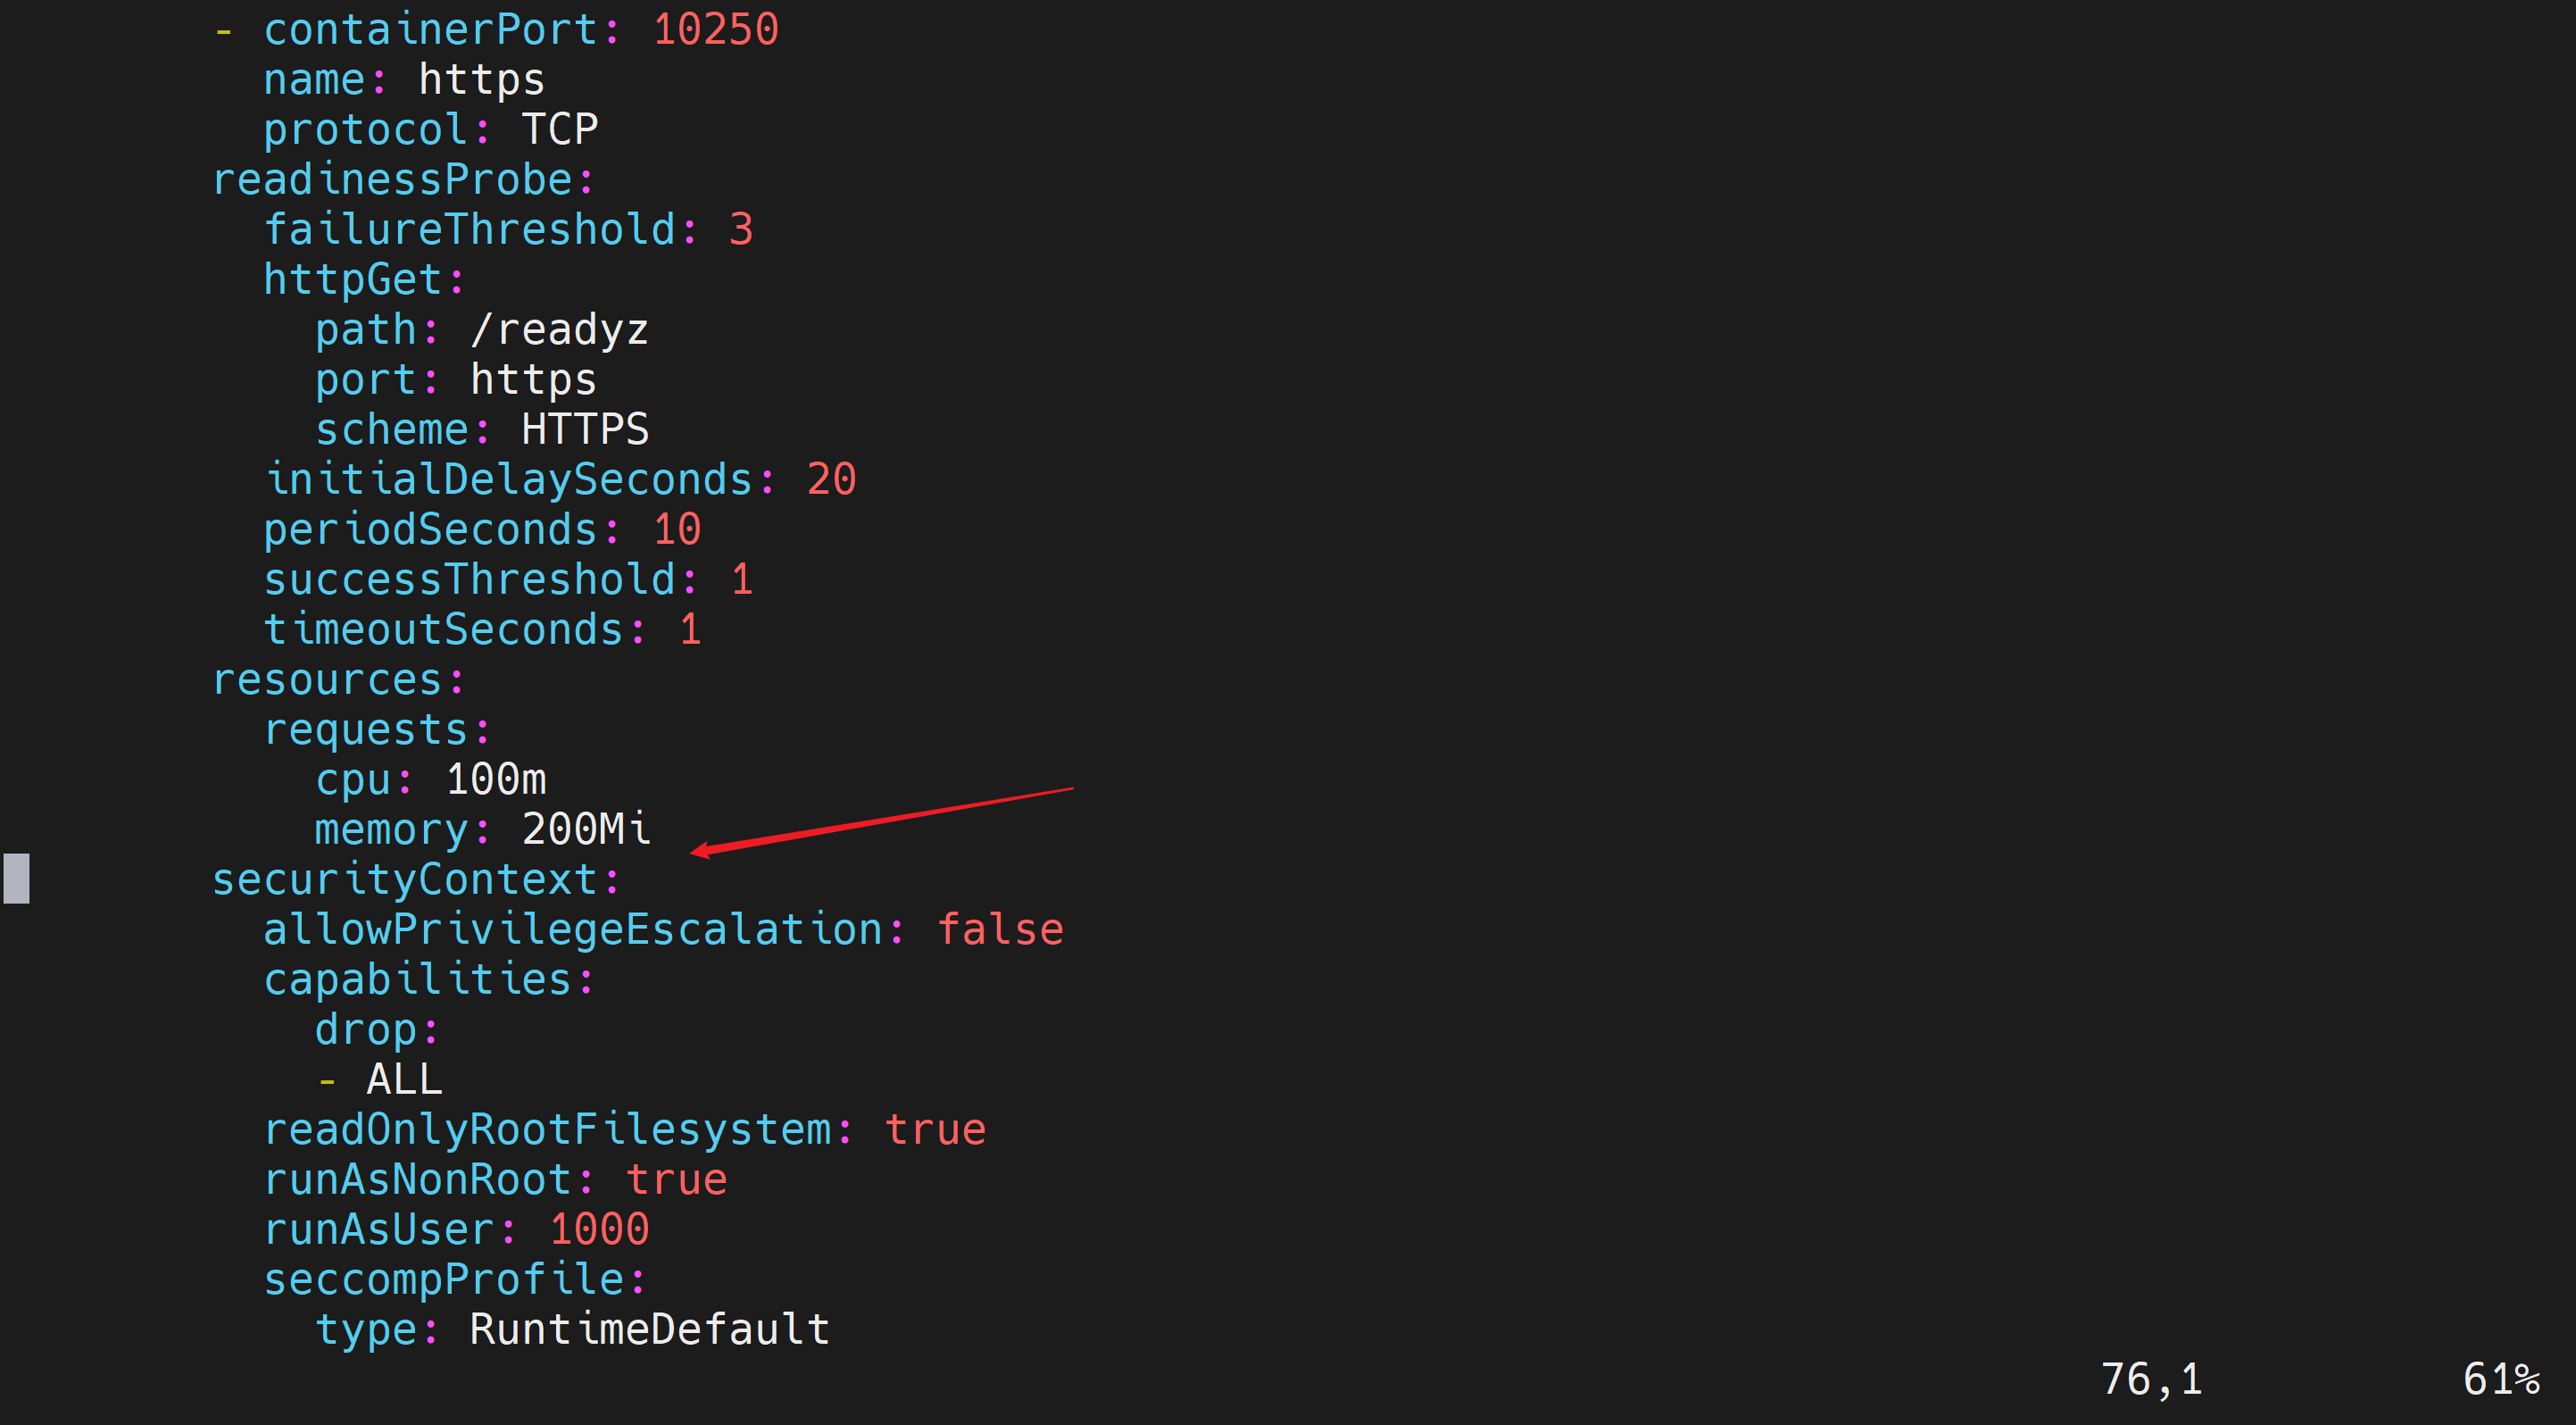
[root@k8s-master01 metrics]#设置资源限制
编辑metrics-server部署资源配置
[root@k8s-master01 metrics]# kubectl edit deployment metrics-server -n kube-system设置资源限制是为了防止容器过度消耗节点资源,保证系统稳定性。
修改前
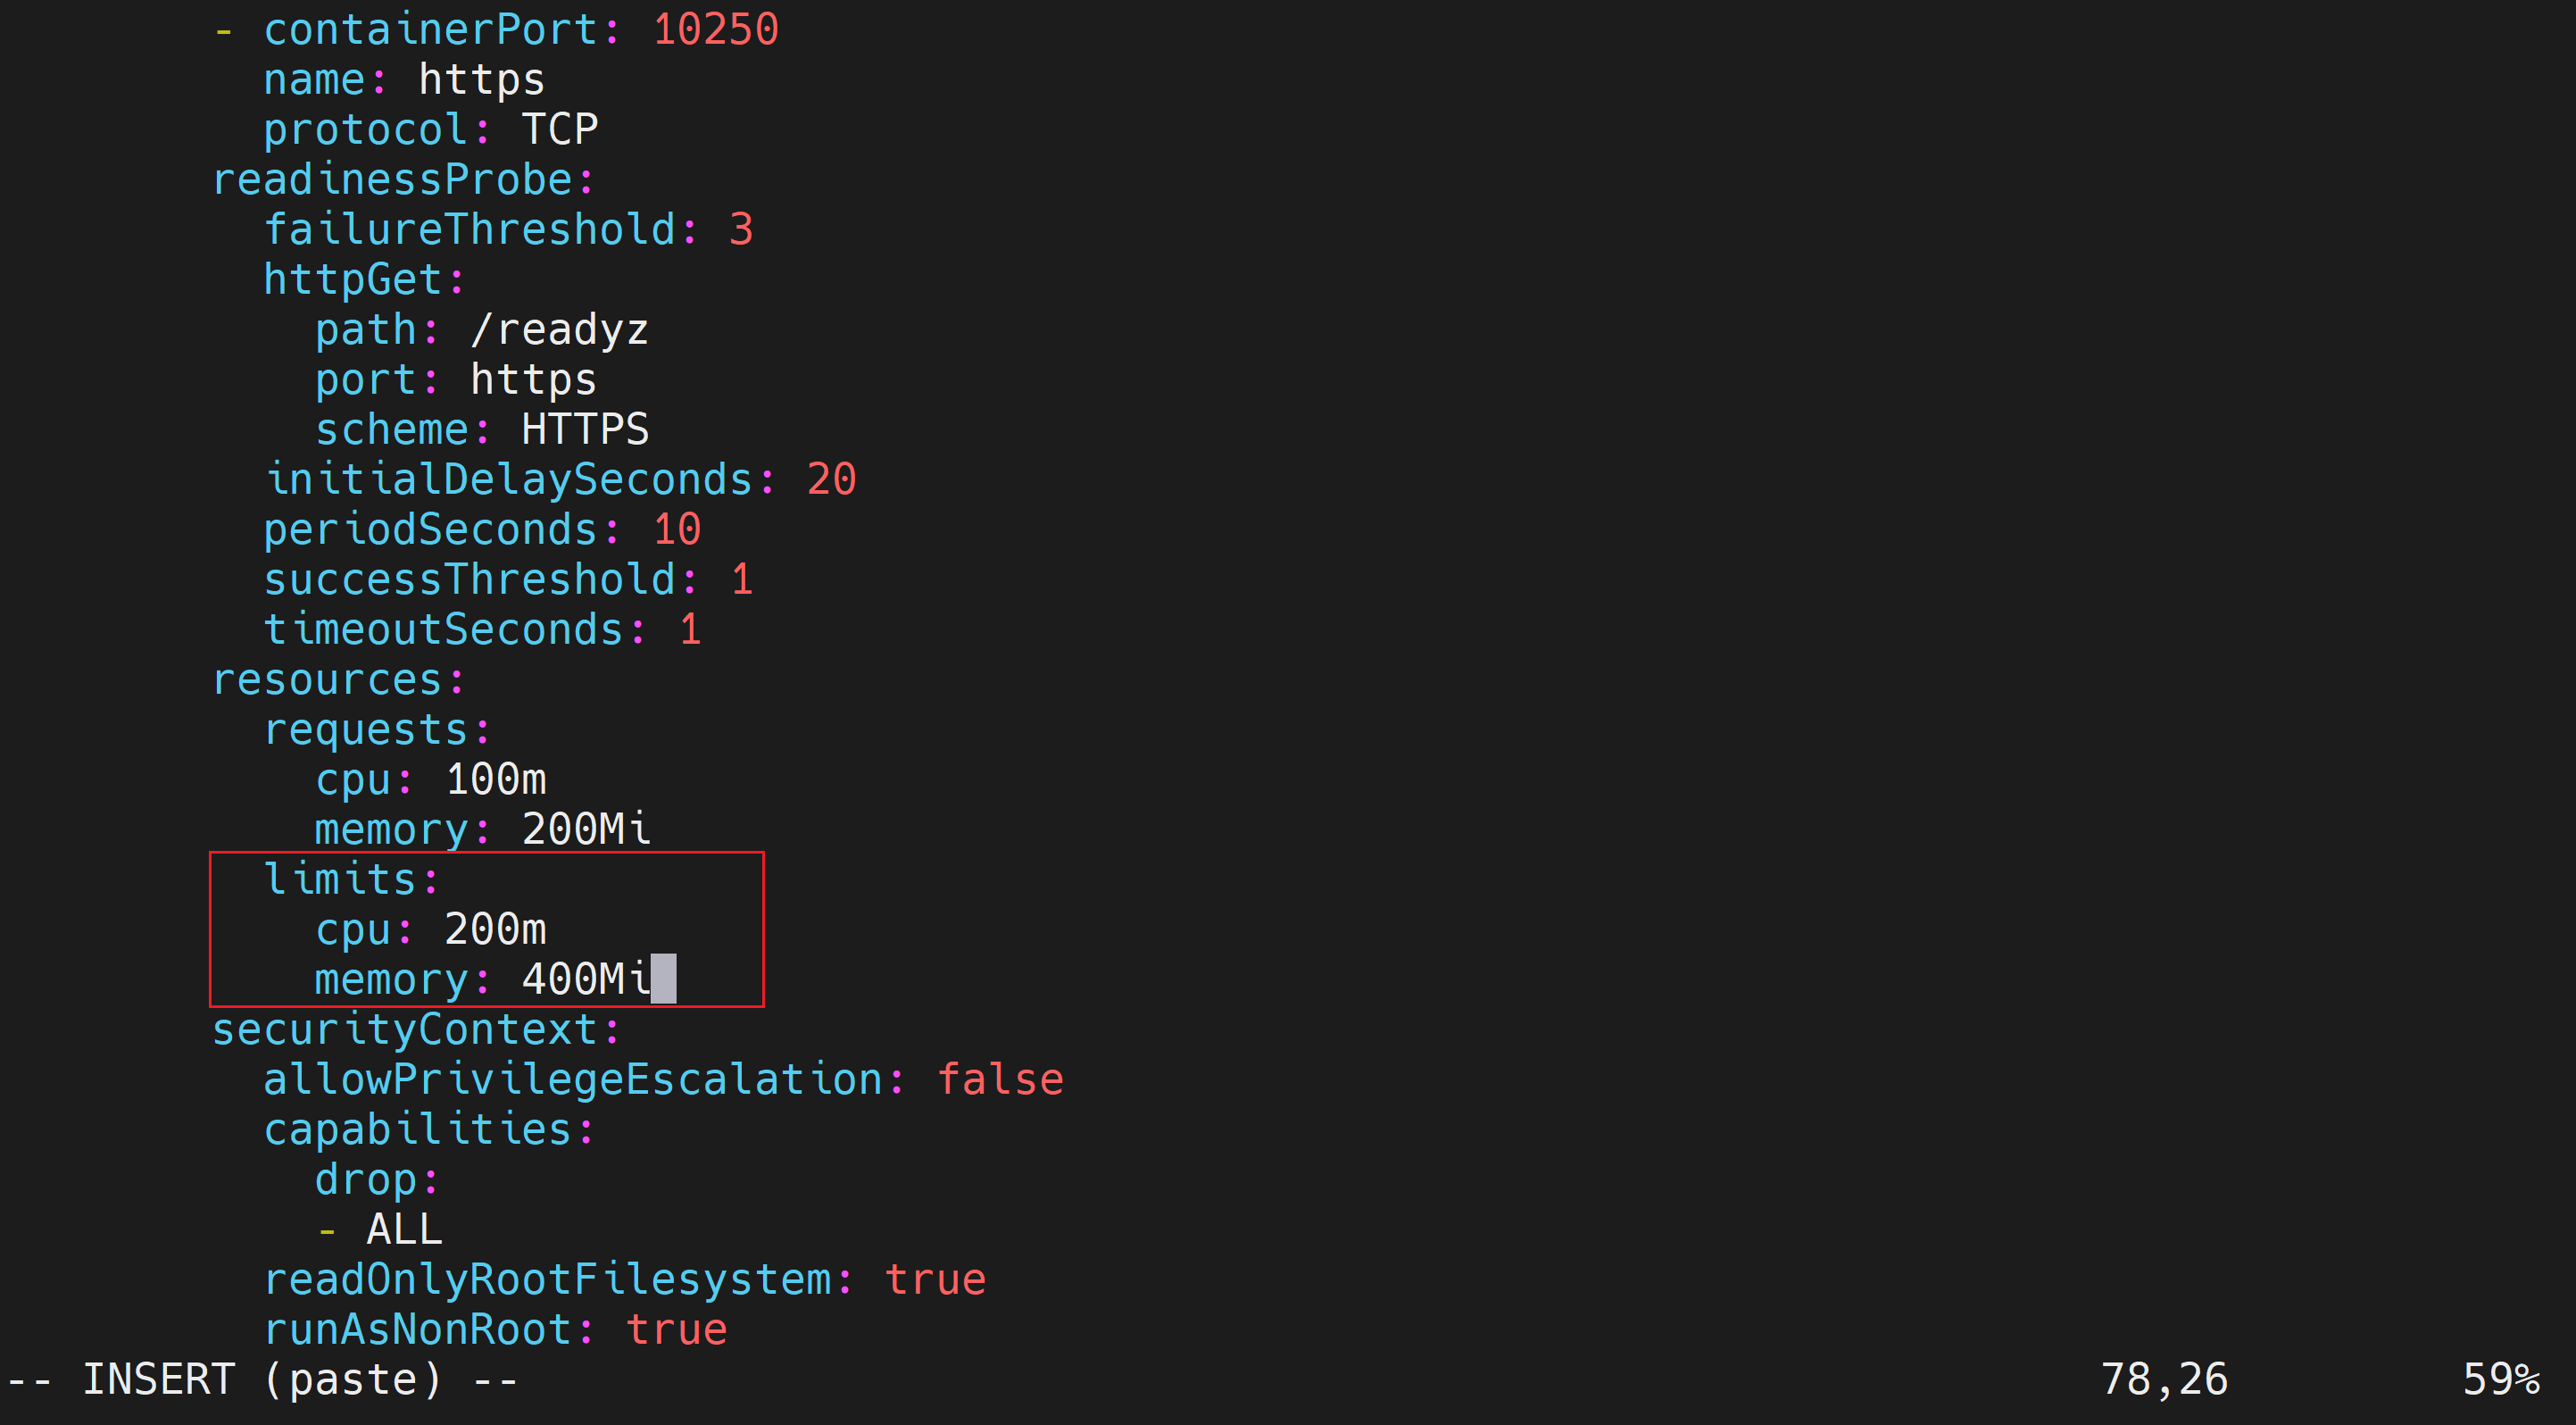
在resources中添加
        limits:
            cpu: 200m
            memory: 400Mi
修改后
保存
查看pods状态
[root@k8s-master01 metrics]# kubectl get pods -n kube-system | grep metrics-server
metrics-server-678895c74f-vztdq            1/1     Running   0               13m
metrics-server-7b97b84c9c-wthbc            0/1     Running   0               21s
[root@k8s-master01 metrics]# kubectl get pods -n kube-system | grep metrics-server
metrics-server-7b97b84c9c-wthbc            1/1     Running   0               67s
[root@k8s-master01 metrics]#

[root@k8s-master01 metrics]# cd ~
[root@k8s-master01 ~]# mkdir hpa
[root@k8s-master01 ~]# cp nginx-deployment.yaml nginx-service.yaml hpa
[root@k8s-master01 ~]# cd hpa
[root@k8s-master01 hpa]# ls
nginx-deployment.yaml  nginx-service.yaml
修改nginx-deployment.yaml
[root@k8s-master01 hpa]# vi nginx-deployment.yaml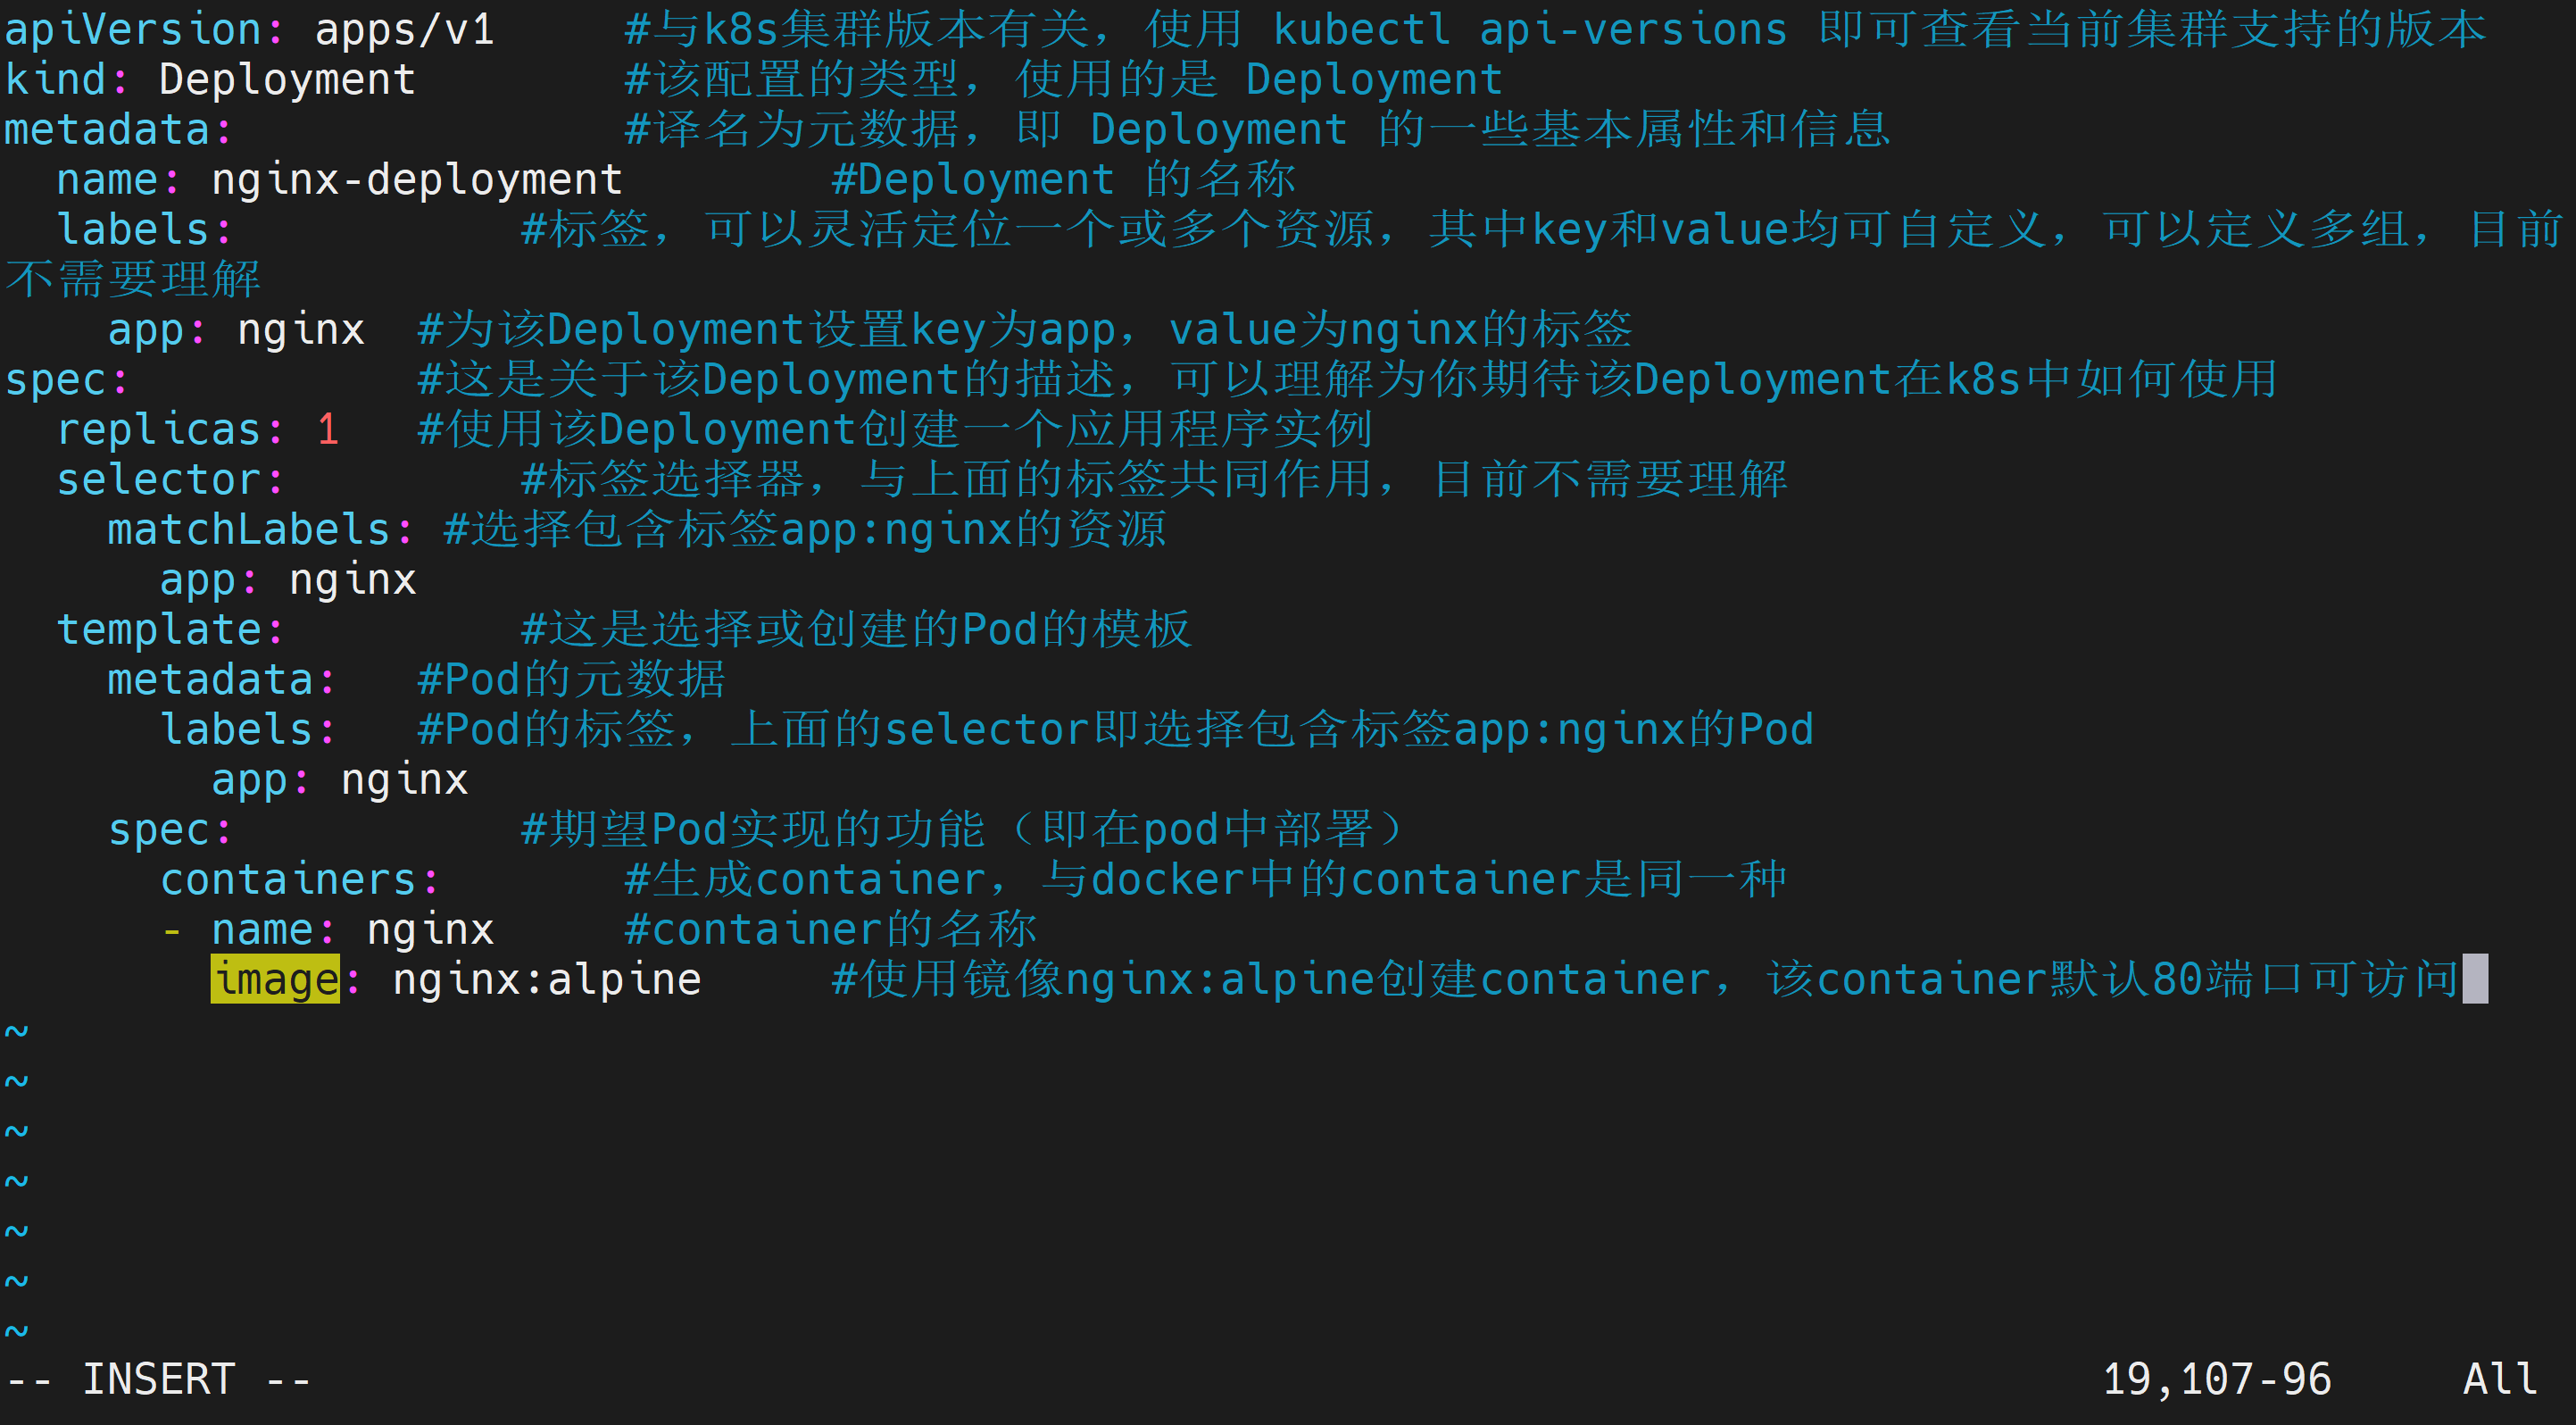
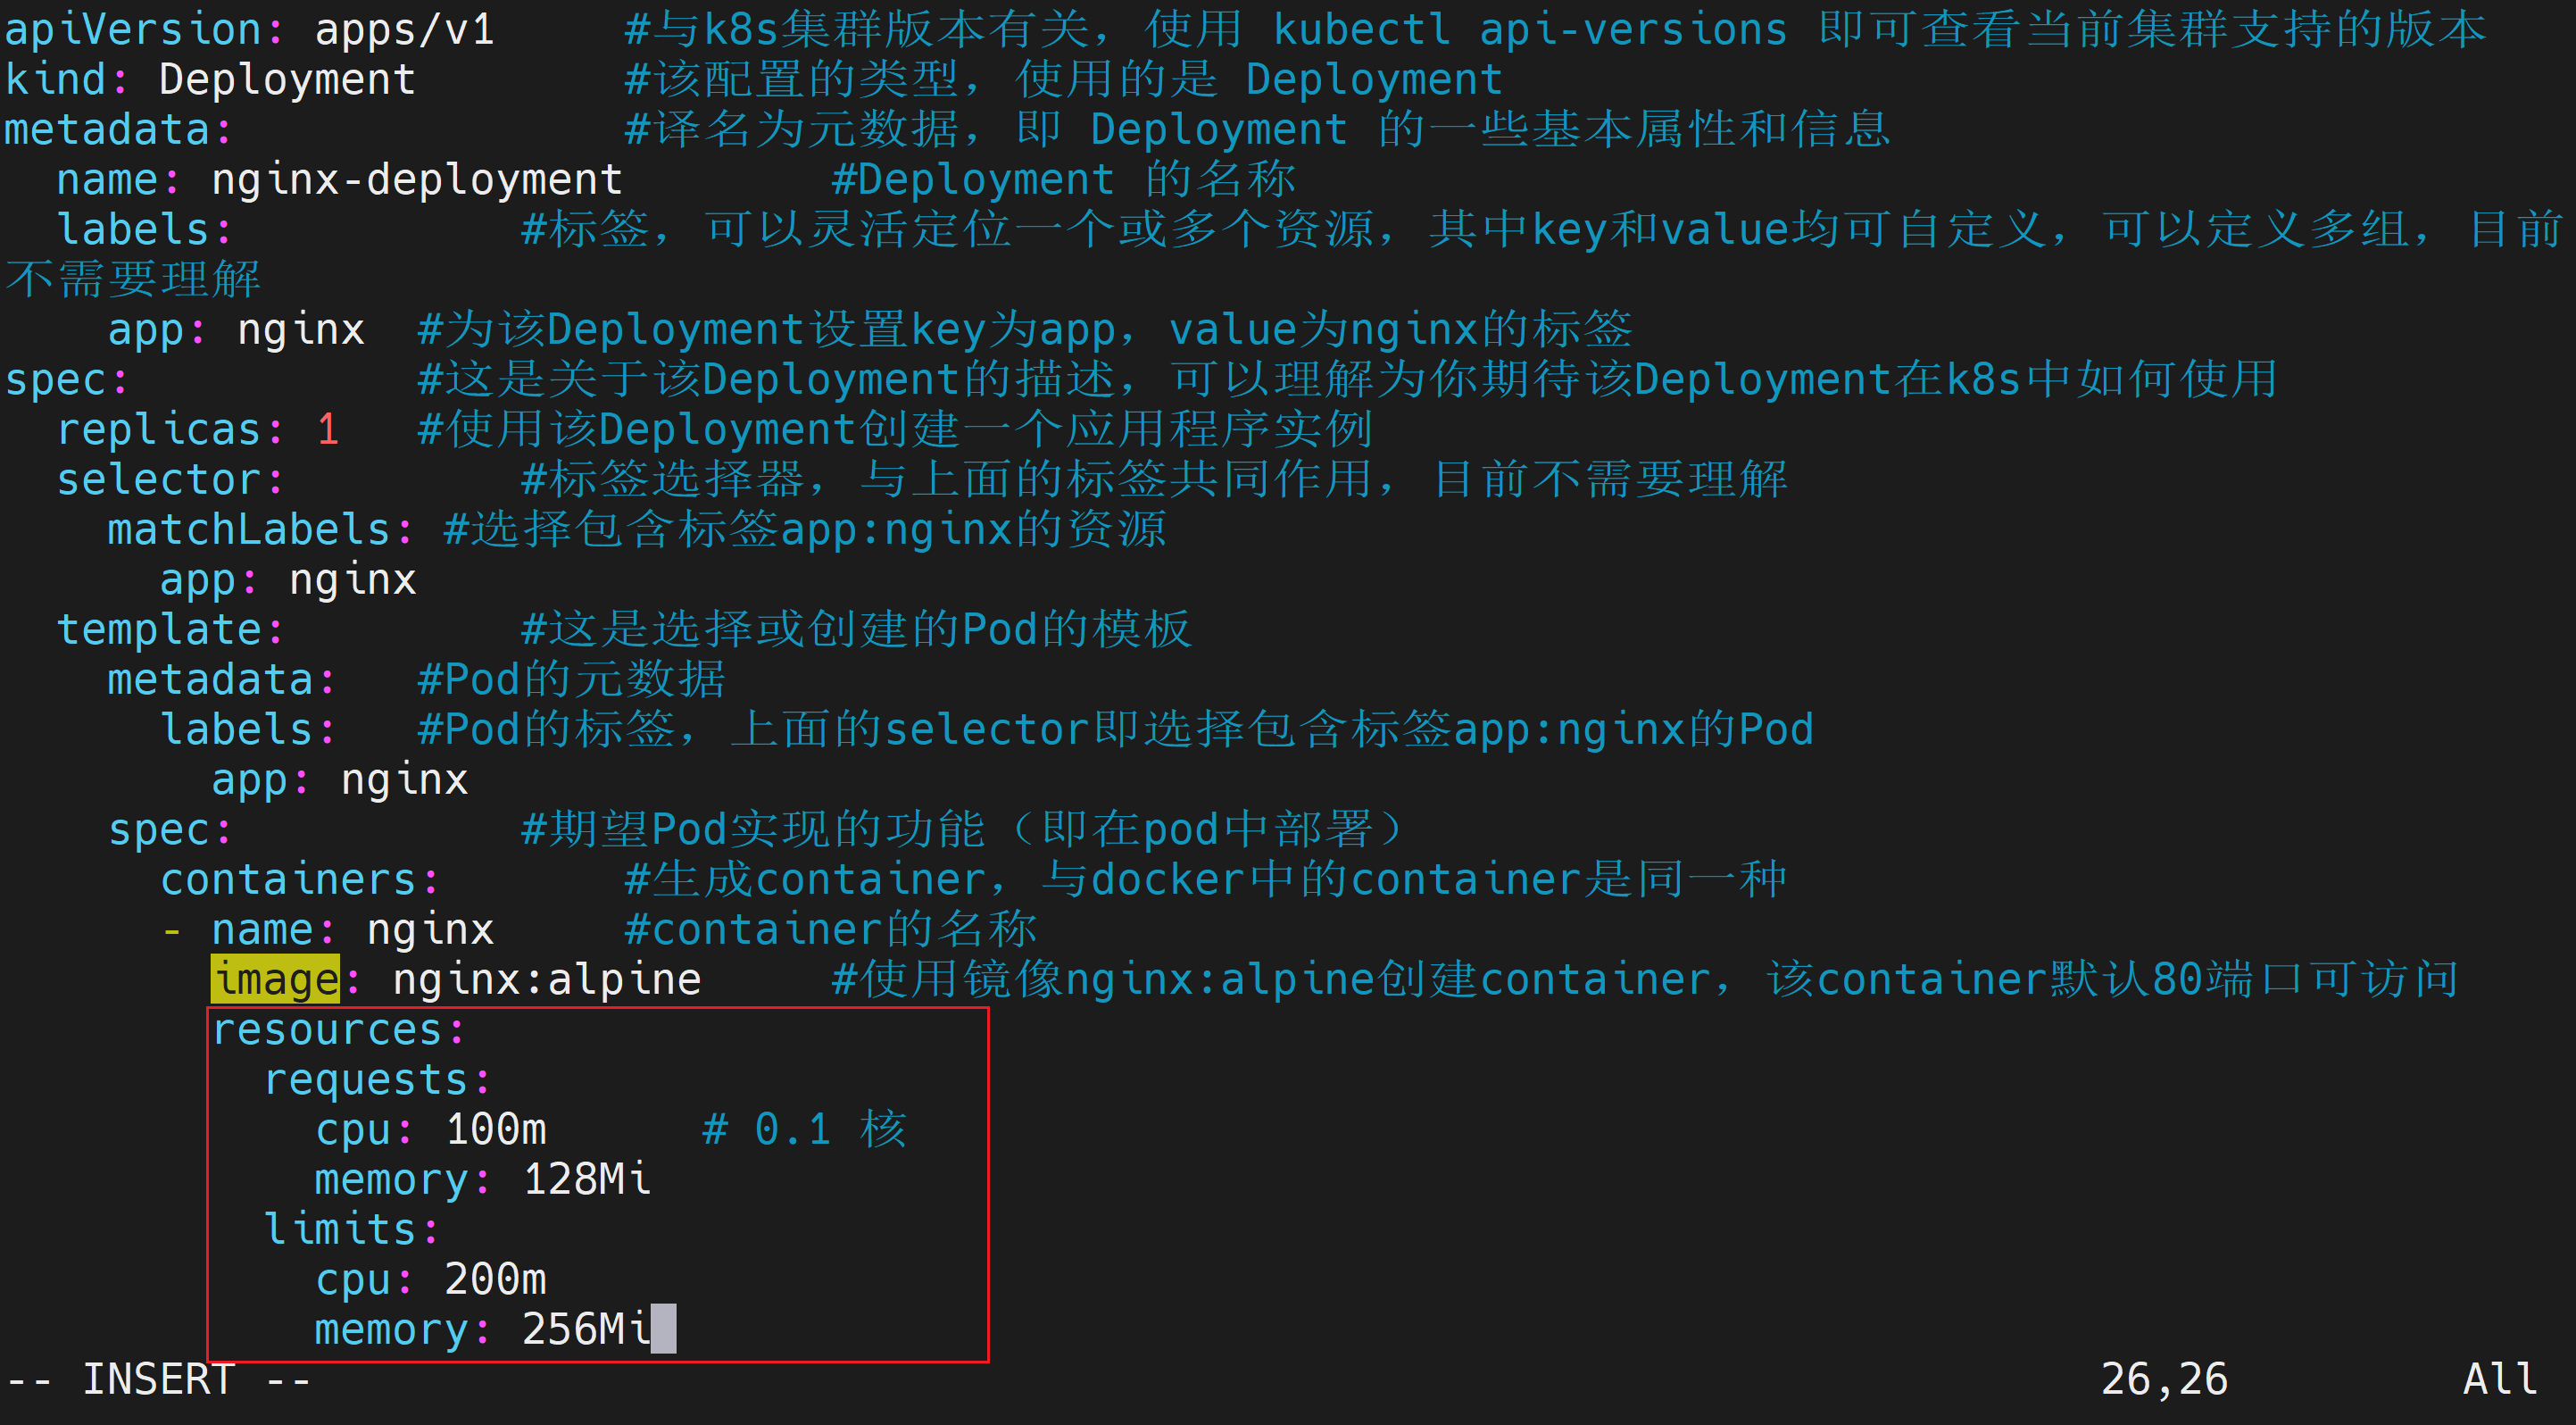
在image的下一行添加
        resources:
          requests:
            cpu: 100m      # 0.1 核
            memory: 128Mi
          limits:
            cpu: 200m
            memory: 256Mi
修改后
修改后完整的nginx-deployment.yaml如下
apiVersion: apps/v1     #与k8s集群版本有关,使用 kubectl api-versions 即可查看当前集群支持的版本
kind: Deployment        #该配置的类型,使用的是 Deployment
metadata:               #译名为元数据,即 Deployment 的一些基本属性和信息
  name: nginx-deployment        #Deployment 的名称
  labels:           #标签,可以灵活定位一个或多个资源,其中key和value均可自定义,可以定义多组,目前不需要理解
    app: nginx  #为该Deployment设置key为app,value为nginx的标签
spec:           #这是关于该Deployment的描述,可以理解为你期待该Deployment在k8s中如何使用
  replicas: 1   #使用该Deployment创建一个应用程序实例
  selector:         #标签选择器,与上面的标签共同作用,目前不需要理解
    matchLabels: #选择包含标签app:nginx的资源
      app: nginx
  template:         #这是选择或创建的Pod的模板
    metadata:   #Pod的元数据
      labels:   #Pod的标签,上面的selector即选择包含标签app:nginx的Pod
        app: nginx
    spec:           #期望Pod实现的功能(即在pod中部署)
      containers:       #生成container,与docker中的container是同一种
      - name: nginx     #container的名称
        image: nginx:alpine     #使用镜像nginx:alpine创建container,该container默认80端口可访问
        resources:
          requests:
            cpu: 100m      # 0.1 核
            memory: 128Mi
          limits:
            cpu: 200m
            memory: 256Mi
应用nginx-deployment.yaml
[root@k8s-master01 hpa]# kubectl apply -f nginx-deployment.yaml
deployment.apps/nginx-deployment created
[root@k8s-master01 hpa]# kubectl rollout status deployment nginx-deployment
deployment "nginx-deployment" successfully rolled out
[root@k8s-master01 hpa]#
验证资源设置
[root@k8s-master01 hpa]# kubectl describe pod -l app=nginx | grep -A5 "Requests\|Limits"
    Limits:
      cpu:     200m
      memory:  256Mi
    Requests:
      cpu:        100m
      memory:     128Mi
    Environment:  <none>
    Mounts:
      /var/run/secrets/kubernetes.io/serviceaccount from kube-api-access-72h5l (ro)
[root@k8s-master01 hpa]#
同时执行 kubectl top pod 观察基准资源使用。
[root@k8s-master01 hpa]# kubectl top pod
NAME                                CPU(cores)   MEMORY(bytes)
nginx-deployment-678cb5c9fd-t7s2b   0m           12Mi
创建nginx-service.yaml
vi nginx-service.yaml内容如下
apiVersion: v1
kind: Service
metadata:
  name: nginx-service   #Service 的名称
  labels:       #Service 自己的标签
    app: nginx  #为该 Service 设置 key 为 app,value 为 nginx 的标签
spec:       #这是关于该 Service 的定义,描述了 Service 如何选择 Pod,如何被访问
  selector:         #标签选择器
    app: nginx  #选择包含标签 app:nginx 的 Pod
  ports:
  - name: nginx-port    #端口的名字
    protocol: TCP           #协议类型 TCP/UDP
    port: 80            #集群内的其他容器组可通过 80 端口访问 Service
    nodePort: 32600   #通过任意节点的 32600 端口访问 Service
    targetPort: 80      #将请求转发到匹配 Pod 的 80 端口
  type: NodePort        #Serive的类型,ClusterIP/NodePort/LoaderBalancer
应用nginx-service.yaml
[root@k8s-master01 hpa]# kubectl apply -f nginx-service.yaml
service/nginx-service created
[root@k8s-master01 hpa]#
创建HorizontalPodAutoscaler
基于 CPU 使用率伸缩是最常用的生产策略。创建 HPA 对象,目标为 CPU 使用率 50%,副本数范围 1~10。可使用命令行创建创建或者使用YAML文件创建,这里使用YAML文件创建。
使用命令行创建(快速验证)
kubectl autoscale deployment nginx-deployment --cpu-percent=50 --min=1 --max=10这里不操作命令行创建,仅作为了解
使用 YAML 文件(更利于版本控制)
创建 hpa-nginx.yaml:
vi hpa-nginx.yaml 内容如下
apiVersion: autoscaling/v2
kind: HorizontalPodAutoscaler
metadata:
  name: nginx-hpa
spec:
  scaleTargetRef:
    apiVersion: apps/v1
    kind: Deployment
    name: nginx-deployment
  minReplicas: 1
  maxReplicas: 10
  metrics:
  - type: Resource
    resource:
      name: cpu
      target:
        type: Utilization
        averageUtilization: 50
应用
[root@k8s-master01 hpa]# kubectl apply -f hpa-nginx.yaml
horizontalpodautoscaler.autoscaling/nginx-hpa created
[root@k8s-master01 hpa]#
查看 HPA 状态
kubectl get hpa
kubectl describe hpa nginx-hpa
此时 TARGETS 列应显示 unknown 或 0%/50%(因为无负载)。
操作过程
[root@k8s-master01 hpa]# kubectl get hpa
NAME        REFERENCE                     TARGETS       MINPODS   MAXPODS   REPLICAS   AGE
nginx-hpa   Deployment/nginx-deployment   cpu: 0%/50%   1         10        1          31s
[root@k8s-master01 hpa]# kubectl describe hpa nginx-hpa
Name:                                                  nginx-hpa
Namespace:                                             default
Labels:                                                <none>
Annotations:                                           <none>
CreationTimestamp:                                     Sun, 14 Jun 2026 00:56:08 +0800
Reference:                                             Deployment/nginx-deployment
Metrics:                                               ( current / target )
  resource cpu on pods  (as a percentage of request):  0% (0) / 50%
Min replicas:                                          1
Max replicas:                                          10
Deployment pods:                                       1 current / 1 desired
Conditions:
  Type            Status  Reason               Message
  ----            ------  ------               -------
  AbleToScale     True    ScaleDownStabilized  recent recommendations were higher than current one, applying the highest recent recommendation
  ScalingActive   True    ValidMetricFound     the HPA was able to successfully calculate a replica count from cpu resource utilization (percentage of request)
  ScalingLimited  False   DesiredWithinRange   the desired count is within the acceptable range
Events:           <none>
[root@k8s-master01 hpa]#
压力测试与自动伸缩验证
模拟生产流量,观察 HPA 如何增加 Pod 数量并最终恢复。
获取 Service 的访问地址
NODE_IP=$(kubectl get nodes -o jsonpath='{.items[0].status.addresses[?(@.type=="InternalIP")].address}')
NODE_PORT=32600
echo "http://$NODE_IP:$NODE_PORT"
操作过程
[root@k8s-master01 hpa]# NODE_IP=$(kubectl get nodes -o jsonpath='{.items[0].status.addresses[?(@.type=="InternalIP")].address}')
NODE_PORT=32600
echo "http://$NODE_IP:$NODE_PORT"
http://192.168.204.101:32600
[root@k8s-master01 hpa]#
安装压测工具(例如 hey 或 ab)
以 hey (轻量并发工具)为例
# 安装go
yum install epel-release -y
yum update -y
yum install golang -y
go version
go env -w GOPROXY=https://goproxy.cn,direct

# 安装hey
go install github.com/rakyll/hey@latest
部分操作过程如下
[root@k8s-master01 hpa]# yum install golang -y
Last metadata expiration check: 1:39:20 ago on Sat Jun 13 23:32:42 2026.
Dependencies resolved.
===================================================================================================
Package Architecture Version Repository Size
===================================================================================================
Installing:
golang x86_64 1.26.3-1.el9_8 appstream 1.4 M
Installing dependencies:
cpp x86_64 11.5.0-14.el9 appstream 11 M
gcc x86_64 11.5.0-14.el9 appstream 32 M
glibc-devel x86_64 2.34-270.el9_8 appstream 37 k
glibc-headers x86_64 2.34-270.el9_8 appstream 444 k
golang-bin x86_64 1.26.3-1.el9_8 appstream 44 M
golang-race x86_64 1.26.3-1.el9_8 appstream 1.7 M
golang-src noarch 1.26.3-1.el9_8 appstream 11 M
kernel-headers x86_64 5.14.0-687.15.1.el9_8 appstream 2.5 M
libmpc x86_64 1.2.1-4.el9 appstream 61 k
libpkgconf x86_64 1.7.3-10.el9 baseos 35 k
libxcrypt-devel x86_64 4.4.18-3.el9 appstream 28 k
make x86_64 1:4.3-8.el9 baseos 529 k
openssl-devel x86_64 1:3.5.5-4.el9_8 appstream 3.4 M
pkgconf x86_64 1.7.3-10.el9 baseos 40 k
pkgconf-m4 noarch 1.7.3-10.el9 baseos 14 k
pkgconf-pkg-config x86_64 1.7.3-10.el9 baseos 10 k
Transaction Summary
===================================================================================================
Install 17 Packages
Total download size: 108 M
Installed size: 337 M
Downloading Packages:
(1/17): libpkgconf-1.7.3-10.el9.x86_64.rpm 49 kB/s | 35 kB 00:00
(2/17): pkgconf-1.7.3-10.el9.x86_64.rpm 53 kB/s | 40 kB 00:00
(3/17): pkgconf-m4-1.7.3-10.el9.noarch.rpm 105 kB/s | 14 kB 00:00
(4/17): make-4.3-8.el9.x86_64.rpm 614 kB/s | 529 kB 00:00
(5/17): pkgconf-pkg-config-1.7.3-10.el9.x86_64.rpm 60 kB/s | 10 kB 00:00
(6/17): glibc-devel-2.34-270.el9_8.x86_64.rpm 97 kB/s | 37 kB 00:00
(7/17): glibc-headers-2.34-270.el9_8.x86_64.rpm 1.1 MB/s | 444 kB 00:00
(8/17): golang-1.26.3-1.el9_8.x86_64.rpm 938 kB/s | 1.4 MB 00:01
(9/17): cpp-11.5.0-14.el9.x86_64.rpm 1.3 MB/s | 11 MB 00:08
(10/17): golang-race-1.26.3-1.el9_8.x86_64.rpm 702 kB/s | 1.7 MB 00:02
(11/17): gcc-11.5.0-14.el9.x86_64.rpm 1.8 MB/s | 32 MB 00:18
(12/17): kernel-headers-5.14.0-687.15.1.el9_8.x86_64.rpm 869 kB/s | 2.5 MB 00:02
(13/17): libmpc-1.2.1-4.el9.x86_64.rpm 108 kB/s | 61 kB 00:00
(14/17): libxcrypt-devel-4.4.18-3.el9.x86_64.rpm 34 kB/s | 28 kB 00:00
(15/17): openssl-devel-3.5.5-4.el9_8.x86_64.rpm 1.5 MB/s | 3.4 MB 00:02
(16/17): golang-bin-1.26.3-1.el9_8.x86_64.rpm 1.9 MB/s | 44 MB 00:23
(17/17): golang-src-1.26.3-1.el9_8.noarch.rpm 697 kB/s | 11 MB 00:15
---------------------------------------------------------------------------------------------------
Total 3.9 MB/s | 108 MB 00:27
Running transaction check
Transaction check succeeded.
Running transaction test
Transaction test succeeded.
Running transaction
Running scriptlet: golang-1.26.3-1.el9_8.x86_64 1/1
Preparing : 1/1
Installing : libmpc-1.2.1-4.el9.x86_64 1/17
Installing : cpp-11.5.0-14.el9.x86_64 2/17
Installing : kernel-headers-5.14.0-687.15.1.el9_8.x86_64 3/17
Installing : golang-src-1.26.3-1.el9_8.noarch 4/17
Installing : glibc-headers-2.34-270.el9_8.x86_64 5/17
Installing : pkgconf-m4-1.7.3-10.el9.noarch 6/17
Installing : make-1:4.3-8.el9.x86_64 7/17
Installing : libpkgconf-1.7.3-10.el9.x86_64 8/17
Installing : pkgconf-1.7.3-10.el9.x86_64 9/17
Installing : pkgconf-pkg-config-1.7.3-10.el9.x86_64 10/17
Installing : glibc-devel-2.34-270.el9_8.x86_64 11/17
Installing : libxcrypt-devel-4.4.18-3.el9.x86_64 12/17
Installing : gcc-11.5.0-14.el9.x86_64 13/17
Installing : openssl-devel-1:3.5.5-4.el9_8.x86_64 14/17
Installing : golang-bin-1.26.3-1.el9_8.x86_64 15/17
Installing : golang-race-1.26.3-1.el9_8.x86_64 16/17
Installing : golang-1.26.3-1.el9_8.x86_64 17/17
Running scriptlet: golang-1.26.3-1.el9_8.x86_64 17/17
Verifying : libpkgconf-1.7.3-10.el9.x86_64 1/17
Verifying : make-1:4.3-8.el9.x86_64 2/17
Verifying : pkgconf-1.7.3-10.el9.x86_64 3/17
Verifying : pkgconf-m4-1.7.3-10.el9.noarch 4/17
Verifying : pkgconf-pkg-config-1.7.3-10.el9.x86_64 5/17
Verifying : cpp-11.5.0-14.el9.x86_64 6/17
Verifying : gcc-11.5.0-14.el9.x86_64 7/17
Verifying : glibc-devel-2.34-270.el9_8.x86_64 8/17
Verifying : glibc-headers-2.34-270.el9_8.x86_64 9/17
Verifying : golang-1.26.3-1.el9_8.x86_64 10/17
Verifying : golang-bin-1.26.3-1.el9_8.x86_64 11/17
Verifying : golang-race-1.26.3-1.el9_8.x86_64 12/17
Verifying : golang-src-1.26.3-1.el9_8.noarch 13/17
Verifying : kernel-headers-5.14.0-687.15.1.el9_8.x86_64 14/17
Verifying : libmpc-1.2.1-4.el9.x86_64 15/17
Verifying : libxcrypt-devel-4.4.18-3.el9.x86_64 16/17
Verifying : openssl-devel-1:3.5.5-4.el9_8.x86_64 17/17
Installed:
cpp-11.5.0-14.el9.x86_64 gcc-11.5.0-14.el9.x86_64
glibc-devel-2.34-270.el9_8.x86_64 glibc-headers-2.34-270.el9_8.x86_64
golang-1.26.3-1.el9_8.x86_64 golang-bin-1.26.3-1.el9_8.x86_64
golang-race-1.26.3-1.el9_8.x86_64 golang-src-1.26.3-1.el9_8.noarch
kernel-headers-5.14.0-687.15.1.el9_8.x86_64 libmpc-1.2.1-4.el9.x86_64
libpkgconf-1.7.3-10.el9.x86_64 libxcrypt-devel-4.4.18-3.el9.x86_64
make-1:4.3-8.el9.x86_64 openssl-devel-1:3.5.5-4.el9_8.x86_64
pkgconf-1.7.3-10.el9.x86_64 pkgconf-m4-1.7.3-10.el9.noarch
pkgconf-pkg-config-1.7.3-10.el9.x86_64
Complete!
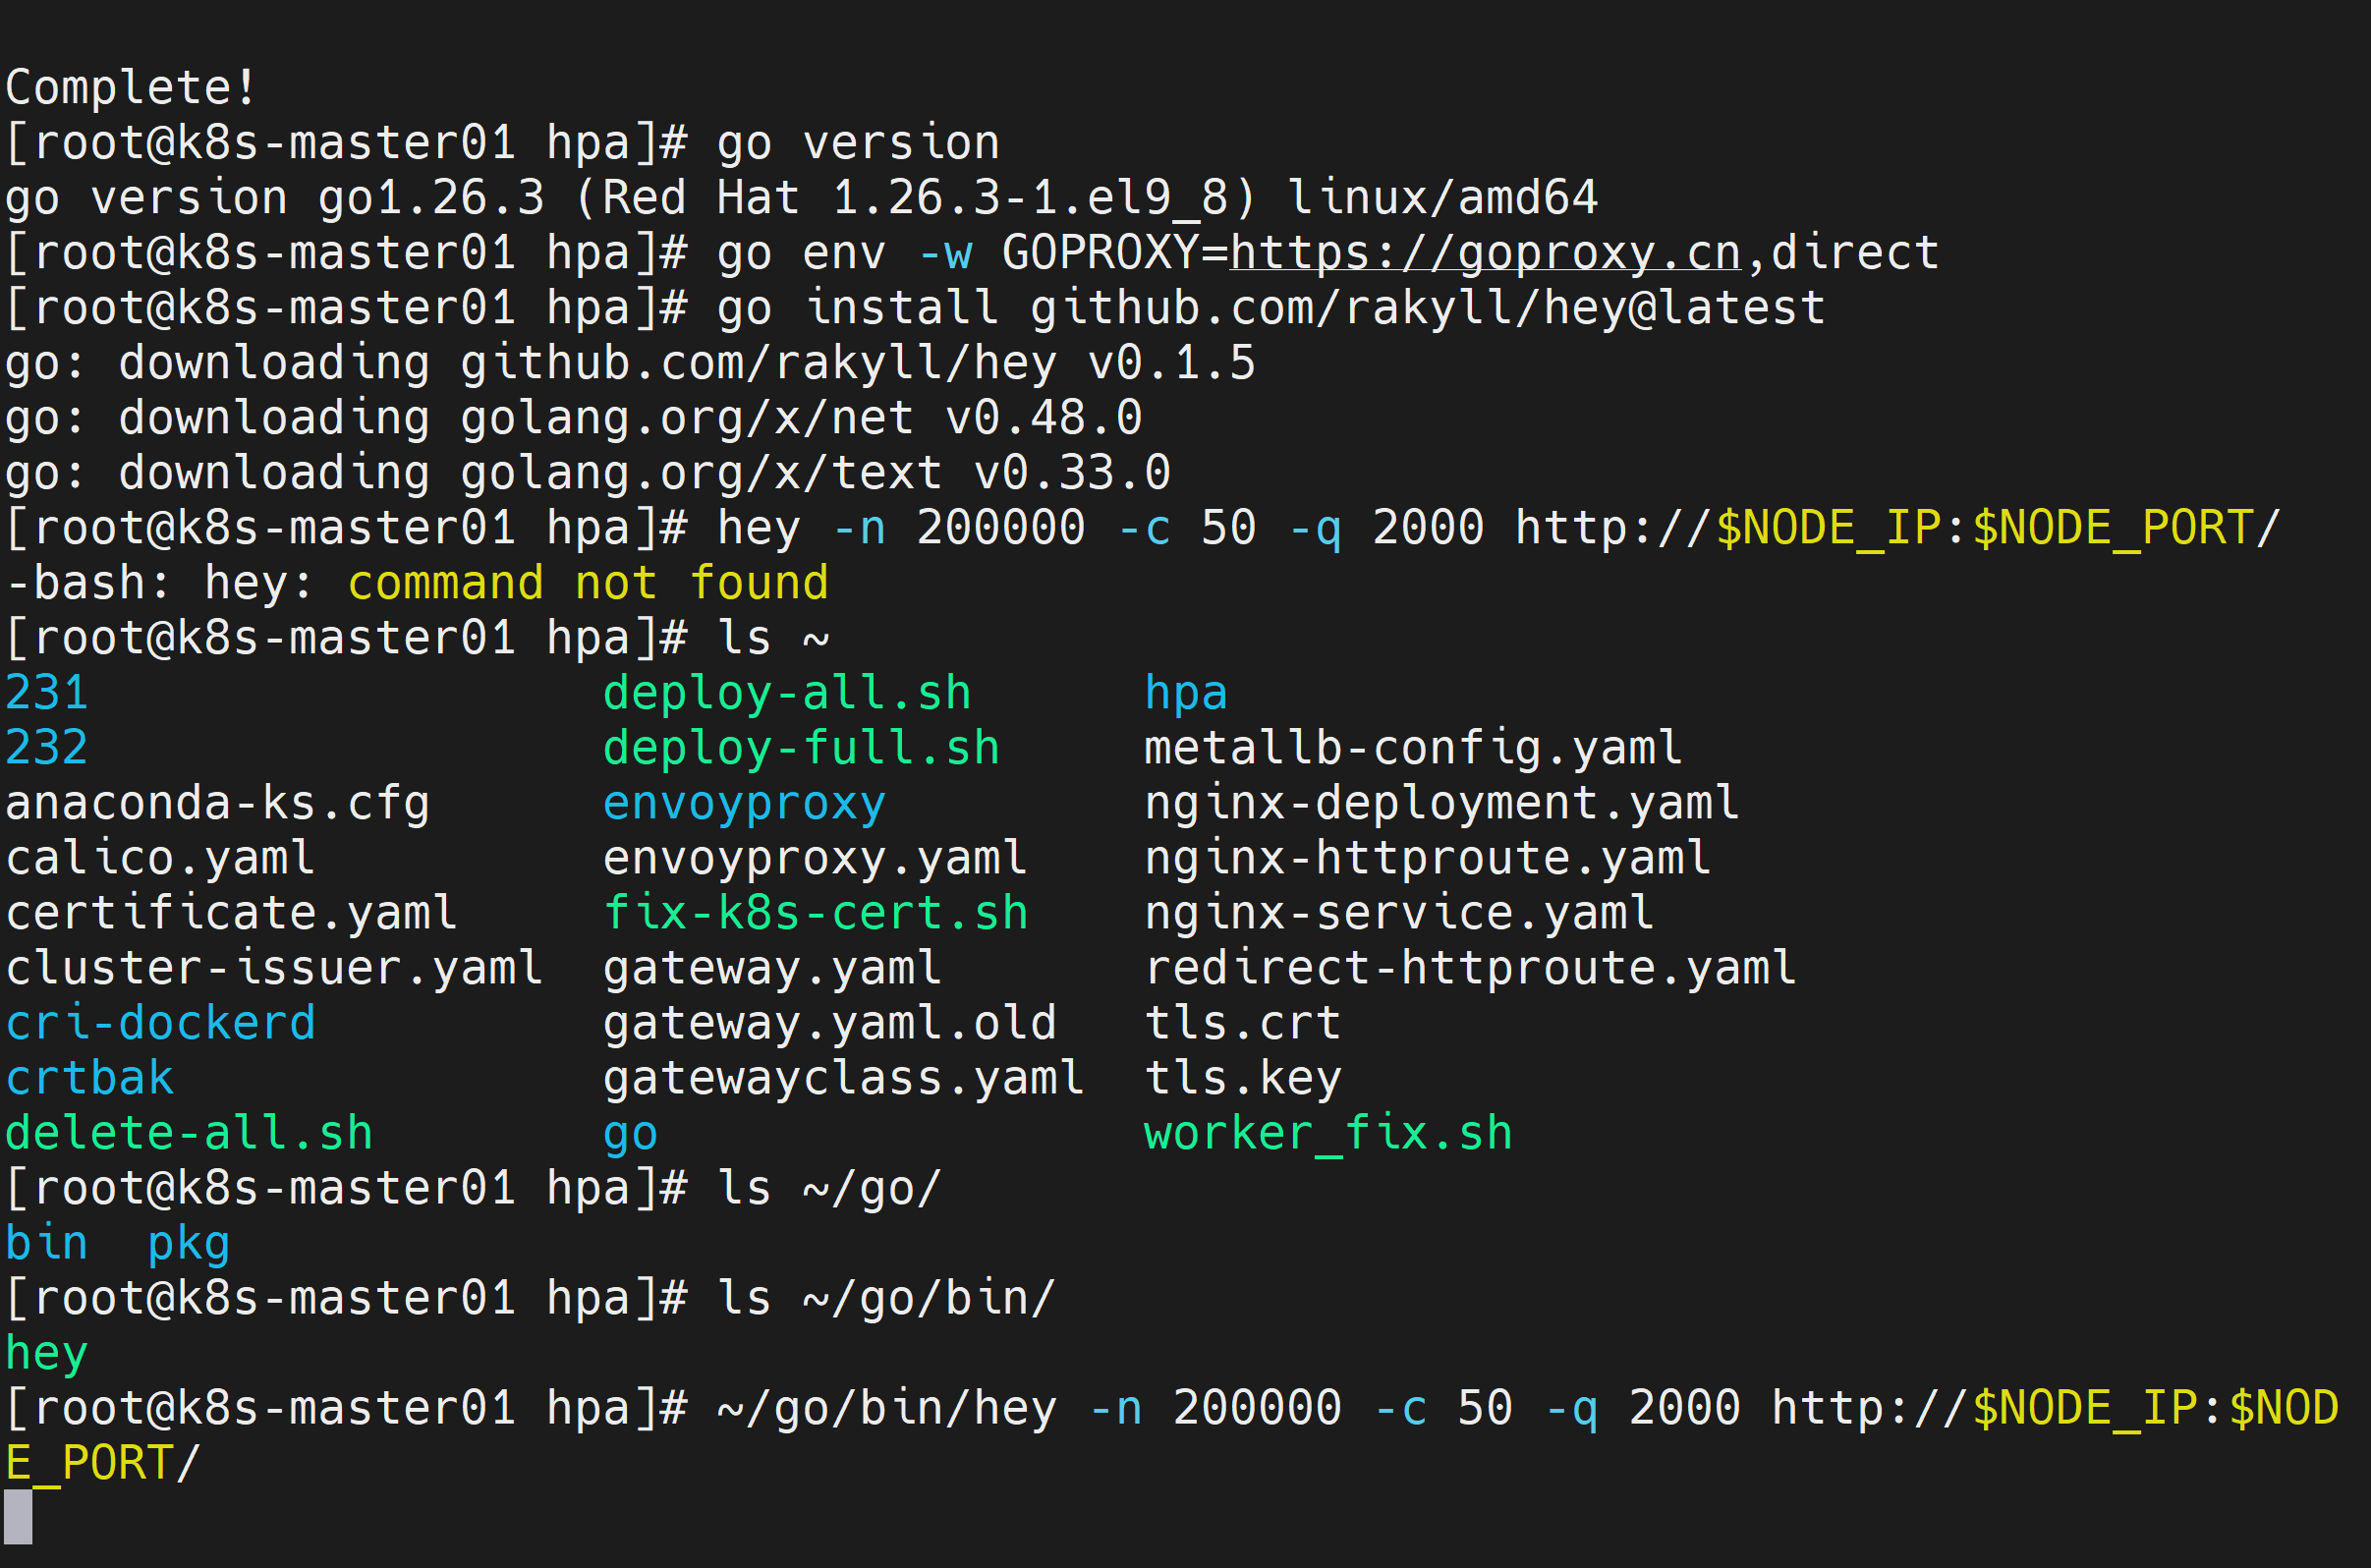
[root@k8s-master01 hpa]# go version
go version go1.26.3 (Red Hat 1.26.3-1.el9_8) linux/amd64
[root@k8s-master01 hpa]# go env -w GOPROXY=https://goproxy.cn,direct
[root@k8s-master01 hpa]# go install github.com/rakyll/hey@latest
go: downloading github.com/rakyll/hey v0.1.5
go: downloading golang.org/x/net v0.48.0
go: downloading golang.org/x/text v0.33.0
[root@k8s-master01 hpa]#发起持续负载
向 Nginx Service 发送请求,50 个并发连接(即 50 个客户端线程同时发送请求),保持 QPS 约 2000,总共发送 20 万个请求
hey -n 200000 -c 50 -q 2000 http://$NODE_IP:$NODE_PORT/操作过程
[root@k8s-master01 hpa]# hey -n 200000 -c 50 -q 2000 http://$NODE_IP:$NODE_PORT/
-bash: hey: command not found
[root@k8s-master01 hpa]# ls ~
231                  deploy-all.sh      hpa
232                  deploy-full.sh     metallb-config.yaml
anaconda-ks.cfg      envoyproxy         nginx-deployment.yaml
calico.yaml          envoyproxy.yaml    nginx-httproute.yaml
certificate.yaml     fix-k8s-cert.sh    nginx-service.yaml
cluster-issuer.yaml  gateway.yaml       redirect-httproute.yaml
cri-dockerd          gateway.yaml.old   tls.crt
crtbak               gatewayclass.yaml  tls.key
delete-all.sh        go                 worker_fix.sh
[root@k8s-master01 hpa]# ls ~/go/
bin  pkg
[root@k8s-master01 hpa]# ls ~/go/bin/
hey
[root@k8s-master01 hpa]#
[root@k8s-master01 hpa]# ~/go/bin/hey -n 200000 -c 50 -q 2000 http://$NODE_IP:$NODE_PORT/
注意:hep命令在~/go/bin目录下
发起持续负载过程如下
[root@k8s-master01 hpa]# ~/go/bin/hey -n 200000 -c 50 -q 2000 http://$NODE_IP:$NODE_PORT/

Summary:
  Total:        59.2321 secs
  Slowest:      0.4976 secs
  Fastest:      0.0002 secs
  Average:      0.0140 secs
  Requests/sec: 3376.5488

  Total data:   179200000 bytes
  Size/request: 896 bytes

Response time histogram:
  0.000 [1]     |
  0.050 [176109]        |■■■■■■■■■■■■■■■■■■■■■■■■■■■■■■■■■■■■■■■■
  0.100 [20891] |■■■■■
  0.149 [2514]  |■
  0.199 [286]   |
  0.249 [112]   |
  0.299 [24]    |
  0.348 [17]    |
  0.398 [5]     |
  0.448 [15]    |
  0.498 [26]    |


Latency distribution:
  10%% in 0.0008 secs
  25%% in 0.0015 secs
  50%% in 0.0031 secs
  75%% in 0.0071 secs
  90%% in 0.0689 secs
  95%% in 0.0859 secs
  99%% in 0.1034 secs

Details (average, fastest, slowest):
  DNS+dialup:   0.0000 secs, 0.0000 secs, 0.0027 secs
  DNS-lookup:   0.0000 secs, 0.0000 secs, 0.0000 secs
  req write:    0.0000 secs, 0.0000 secs, 0.0261 secs
  resp wait:    0.0133 secs, 0.0002 secs, 0.4975 secs
  resp read:    0.0006 secs, 0.0000 secs, 0.3090 secs

Status code distribution:
  [200] 200000 responses


[root@k8s-master01 hpa]#
观察伸缩过程(另开终端)
发起持续负载后,立即打开另外的终端,实时监控 HPA 状态
预期现象:TARGETS 从 0%/50% 上升到 >50%,REPLICAS 开始增加(1→2→4... 直至满足负载或达到 max=10)。
[root@k8s-master01 ~]# kubectl get hpa -w
NAME        REFERENCE                     TARGETS       MINPODS   MAXPODS   REPLICAS   AGE
nginx-hpa   Deployment/nginx-deployment   cpu: 0%/50%   1         10        1          18m
nginx-hpa   Deployment/nginx-deployment   cpu: 41%/50%   1         10        1          20m
nginx-hpa   Deployment/nginx-deployment   cpu: 200%/50%   1         10        1          21m
nginx-hpa   Deployment/nginx-deployment   cpu: 201%/50%   1         10        4          21m
nginx-hpa   Deployment/nginx-deployment   cpu: 194%/50%   1         10        4          21m
一段时间后观察到如下数据
[root@k8s-master01 ~]# kubectl get hpa -w
NAME        REFERENCE                     TARGETS       MINPODS   MAXPODS   REPLICAS   AGE
nginx-hpa   Deployment/nginx-deployment   cpu: 0%/50%   1         10        1          18m
nginx-hpa   Deployment/nginx-deployment   cpu: 41%/50%   1         10        1          20m
nginx-hpa   Deployment/nginx-deployment   cpu: 200%/50%   1         10        1          21m
nginx-hpa   Deployment/nginx-deployment   cpu: 201%/50%   1         10        4          21m
nginx-hpa   Deployment/nginx-deployment   cpu: 194%/50%   1         10        4          21m
nginx-hpa   Deployment/nginx-deployment   cpu: 113%/50%   1         10        8          21m
nginx-hpa   Deployment/nginx-deployment   cpu: 0%/50%     1         10        10         22m
nginx-hpa   Deployment/nginx-deployment   cpu: 0%/50%     1         10        10         26m
nginx-hpa   Deployment/nginx-deployment   cpu: 0%/50%     1         10        9          26m
nginx-hpa   Deployment/nginx-deployment   cpu: 0%/50%     1         10        2          27m
nginx-hpa   Deployment/nginx-deployment   cpu: 0%/50%     1         10        1          27m
同时持续观察Pod数量变化(另开终端)
[root@k8s-master01 ~]# kubectl get pods -l app=nginx -w
NAME                                READY   STATUS    RESTARTS   AGE
nginx-deployment-678cb5c9fd-47wwb   1/1     Running   0          76s
nginx-deployment-678cb5c9fd-82tdw   1/1     Running   0          45s
nginx-deployment-678cb5c9fd-bb7j7   1/1     Running   0          30s
nginx-deployment-678cb5c9fd-ddm86   1/1     Running   0          75s
nginx-deployment-678cb5c9fd-lz8vd   1/1     Running   0          45s
nginx-deployment-678cb5c9fd-n6l7h   1/1     Running   0          45s
nginx-deployment-678cb5c9fd-t7s2b   1/1     Running   0          29m
nginx-deployment-678cb5c9fd-tpskp   1/1     Running   0          30s
nginx-deployment-678cb5c9fd-wgkm4   1/1     Running   0          45s
nginx-deployment-678cb5c9fd-zqppl   1/1     Running   0          75s
观察 CPU 使用率(另开终端)
[root@k8s-master01 ~]# kubectl top pods -l app=nginx
NAME                                CPU(cores)   MEMORY(bytes)
nginx-deployment-678cb5c9fd-47wwb   0m           6Mi
nginx-deployment-678cb5c9fd-82tdw   0m           4Mi
nginx-deployment-678cb5c9fd-bb7j7   0m           4Mi
nginx-deployment-678cb5c9fd-ddm86   0m           11Mi
nginx-deployment-678cb5c9fd-lz8vd   0m           4Mi
nginx-deployment-678cb5c9fd-n6l7h   0m           4Mi
nginx-deployment-678cb5c9fd-t7s2b   0m           12Mi
nginx-deployment-678cb5c9fd-tpskp   0m           4Mi
nginx-deployment-678cb5c9fd-wgkm4   0m           4Mi
nginx-deployment-678cb5c9fd-zqppl   0m           4Mi
[root@k8s-master01 ~]#
Metrics Server 采集延迟会导致伸缩延迟,生产可接受 1-2 分钟。
[root@k8s-master01 ~]# kubectl get pods -l app=nginx -w
NAME                                READY   STATUS    RESTARTS   AGE
nginx-deployment-678cb5c9fd-47wwb   1/1     Running   0          76s
nginx-deployment-678cb5c9fd-82tdw   1/1     Running   0          45s
nginx-deployment-678cb5c9fd-bb7j7   1/1     Running   0          30s
nginx-deployment-678cb5c9fd-ddm86   1/1     Running   0          75s
nginx-deployment-678cb5c9fd-lz8vd   1/1     Running   0          45s
nginx-deployment-678cb5c9fd-n6l7h   1/1     Running   0          45s
nginx-deployment-678cb5c9fd-t7s2b   1/1     Running   0          29m
nginx-deployment-678cb5c9fd-tpskp   1/1     Running   0          30s
nginx-deployment-678cb5c9fd-wgkm4   1/1     Running   0          45s
nginx-deployment-678cb5c9fd-zqppl   1/1     Running   0          75s
nginx-deployment-678cb5c9fd-wgkm4   1/1     Terminating   0          5m
nginx-deployment-678cb5c9fd-wgkm4   1/1     Terminating   0          5m
nginx-deployment-678cb5c9fd-wgkm4   0/1     Completed     0          5m1s
nginx-deployment-678cb5c9fd-wgkm4   0/1     Completed     0          5m1s
nginx-deployment-678cb5c9fd-wgkm4   0/1     Completed     0          5m1s
nginx-deployment-678cb5c9fd-ddm86   1/1     Terminating   0          5m45s
nginx-deployment-678cb5c9fd-bb7j7   1/1     Terminating   0          5m
nginx-deployment-678cb5c9fd-lz8vd   1/1     Terminating   0          5m15s
nginx-deployment-678cb5c9fd-82tdw   1/1     Terminating   0          5m15s
nginx-deployment-678cb5c9fd-t7s2b   1/1     Terminating   0          33m
nginx-deployment-678cb5c9fd-n6l7h   1/1     Terminating   0          5m15s
nginx-deployment-678cb5c9fd-zqppl   1/1     Terminating   0          5m45s
nginx-deployment-678cb5c9fd-n6l7h   1/1     Terminating   0          5m15s
nginx-deployment-678cb5c9fd-ddm86   1/1     Terminating   0          5m45s
nginx-deployment-678cb5c9fd-zqppl   1/1     Terminating   0          5m45s
nginx-deployment-678cb5c9fd-t7s2b   1/1     Terminating   0          33m
nginx-deployment-678cb5c9fd-bb7j7   1/1     Terminating   0          5m1s
nginx-deployment-678cb5c9fd-lz8vd   1/1     Terminating   0          5m16s
nginx-deployment-678cb5c9fd-82tdw   1/1     Terminating   0          5m16s
nginx-deployment-678cb5c9fd-n6l7h   0/1     Completed     0          5m16s
nginx-deployment-678cb5c9fd-ddm86   0/1     Completed     0          5m46s
nginx-deployment-678cb5c9fd-zqppl   0/1     Completed     0          5m46s
nginx-deployment-678cb5c9fd-t7s2b   0/1     Completed     0          33m
nginx-deployment-678cb5c9fd-bb7j7   0/1     Completed     0          5m1s
nginx-deployment-678cb5c9fd-lz8vd   0/1     Completed     0          5m16s
nginx-deployment-678cb5c9fd-82tdw   0/1     Completed     0          5m16s
nginx-deployment-678cb5c9fd-t7s2b   0/1     Completed     0          33m
nginx-deployment-678cb5c9fd-t7s2b   0/1     Completed     0          33m
nginx-deployment-678cb5c9fd-n6l7h   0/1     Completed     0          5m17s
nginx-deployment-678cb5c9fd-ddm86   0/1     Completed     0          5m47s
nginx-deployment-678cb5c9fd-ddm86   0/1     Completed     0          5m47s
nginx-deployment-678cb5c9fd-ddm86   0/1     Completed     0          5m47s
nginx-deployment-678cb5c9fd-n6l7h   0/1     Completed     0          5m17s
nginx-deployment-678cb5c9fd-n6l7h   0/1     Completed     0          5m17s
nginx-deployment-678cb5c9fd-zqppl   0/1     Completed     0          5m47s
nginx-deployment-678cb5c9fd-zqppl   0/1     Completed     0          5m47s
nginx-deployment-678cb5c9fd-zqppl   0/1     Completed     0          5m47s
nginx-deployment-678cb5c9fd-bb7j7   0/1     Completed     0          5m2s
nginx-deployment-678cb5c9fd-bb7j7   0/1     Completed     0          5m2s
nginx-deployment-678cb5c9fd-bb7j7   0/1     Completed     0          5m2s
nginx-deployment-678cb5c9fd-82tdw   0/1     Completed     0          5m17s
nginx-deployment-678cb5c9fd-82tdw   0/1     Completed     0          5m17s
nginx-deployment-678cb5c9fd-82tdw   0/1     Completed     0          5m17s
nginx-deployment-678cb5c9fd-lz8vd   0/1     Completed     0          5m17s
nginx-deployment-678cb5c9fd-lz8vd   0/1     Completed     0          5m17s
nginx-deployment-678cb5c9fd-lz8vd   0/1     Completed     0          5m17s
停止负载并观察缩容
停止压测命令(Ctrl+C)或者等发完所有请求自动停止负载。HPA 默认 5 分钟稳定窗口 后才会缩容(--horizontal-pod-autoscaler-downscale-stabilization)。
打印出HPA(nginx-hpa)事件日志,命令如下
kubectl describe hpa nginx-hpa | grep -A5 "Events"提示:A5表示显示匹配内容的后5行(After 5)
操作过程
[root@k8s-master01 hpa]# kubectl describe hpa nginx-hpa | grep -A5 "Events"
Events:
  Type    Reason             Age    From                       Message
  ----    ------             ----   ----                       -------
  Normal  SuccessfulRescale  3m34s  horizontal-pod-autoscaler  New size: 4; reason: cpu resource utilization (percentage of request) above target
  Normal  SuccessfulRescale  3m3s   horizontal-pod-autoscaler  New size: 8; reason: cpu resource utilization (percentage of request) above target
  Normal  SuccessfulRescale  2m48s  horizontal-pod-autoscaler  New size: 10; reason: cpu resource utilization (percentage of request) above target
[root@k8s-master01 hpa]#
|-------------------|-------------------------|------------------|
| 时间(事件发生顺序) | 扩容结果 | 触发原因 |
| 3分34秒前 | 扩容到 4 个 | CPU 使用率超过了设定的目标值 |
| 3分3秒前(间隔31秒) | 副本数从 4 扩容到 8 个 | CPU 使用率依然超过目标值 |
| 2分48秒前(间隔15秒) | 副本数从 8 扩容到 10 个 | CPU 使用率依然超过目标值 |
扩容非常积极:HPA 默认每 15 秒检查一次指标。第二次到第三次扩容只隔了 15 秒(正好是一个检查周期),说明压测流量(hey)特别猛,CPU 持续飙升,HPA 在全力追赶负载。
扩容步长很大:从 4→8(增加了 100%),再到 8→10。这符合 HPA 默认的扩容策略(每 15 秒允许翻倍或增加 4 个 Pod 取较大值),最终达到 maxReplicas(最大副本数)是 10。
谨慎缩容:需要等待5分钟后,再次查看hpa,副本数才降回 1(最小副本数)。
[root@k8s-master01 ~]# kubectl describe hpa nginx-hpa | grep -A15 "Events"
Events:
  Type    Reason             Age    From                       Message
  ----    ------             ----   ----                       -------
  Normal  SuccessfulRescale  5m57s  horizontal-pod-autoscaler  New size: 4; reason: cpu resource utilization (percentage of request) above target
  Normal  SuccessfulRescale  5m26s  horizontal-pod-autoscaler  New size: 8; reason: cpu resource utilization (percentage of request) above target
  Normal  SuccessfulRescale  5m11s  horizontal-pod-autoscaler  New size: 10; reason: cpu resource utilization (percentage of request) above target
  Normal  SuccessfulRescale  25s    horizontal-pod-autoscaler  New size: 3; reason: All metrics below target
  Normal  SuccessfulRescale  10s    horizontal-pod-autoscaler  New size: 1; reason: All metrics below target
生产级优化与进阶配置
生产环境不能仅依赖 CPU,还要考虑内存、自定义指标(如 QPS),并调整伸缩行为。
多指标 HPA(CPU + 内存)
编辑 hpa-nginx.yaml,增加内存指标:
vi hpa-nginx.yaml增加内容如下
metrics:
- type: Resource
  resource:
    name: cpu
    target:
      type: Utilization
      averageUtilization: 60
- type: Resource
  resource:
    name: memory
    target:
      type: AverageValue
      averageValue: 300Mi   # 当内存超过 300Mi 时扩容
注意:内存目标类型建议用 AverageValue(绝对值)而非 Utilization(因为内存使用率不随副本线性变化)。
调整伸缩行为(冷却时间、步长)
修改 hpa-nginx.yaml,使用 behavior 字段避免频繁伸缩:
behavior:
  scaleDown:
    stabilizationWindowSeconds: 300   # 缩容等待 5 分钟
    policies:
    - type: Percent
      value: 10        # 每次缩容最多减少 10% 的副本数
      periodSeconds: 60
  scaleUp:
    stabilizationWindowSeconds: 0      # 扩容无需等待
    policies:
    - type: Percent
      value: 100       # 允许一次翻倍扩容
      periodSeconds: 15
    - type: Pods
      value: 4
      periodSeconds: 15
    selectPolicy: Max
完整的hpa-nginx.yaml示例如下
apiVersion: autoscaling/v2
kind: HorizontalPodAutoscaler
metadata:
  name: nginx-hpa
spec:
  scaleTargetRef:
    apiVersion: apps/v1
    kind: Deployment
    name: nginx-deployment
  minReplicas: 1
  maxReplicas: 10
  metrics:
    - type: Resource
      resource:
        name: cpu
        target:
          type: Utilization
          averageUtilization: 60
    - type: Resource
      resource:
        name: memory
        target:
          type: AverageValue
          averageValue: 300Mi
  behavior:
    scaleDown:
      stabilizationWindowSeconds: 300
      policies:
      - type: Percent
        value: 10
        periodSeconds: 60
    scaleUp:
      stabilizationWindowSeconds: 0
      policies:
      - type: Percent
        value: 100
        periodSeconds: 15
      - type: Pods
        value: 4
        periodSeconds: 15
      selectPolicy: Max
接下来可以做的有:
关键指标监控:部署 Prometheus + Grafana,监控 HPA 决策、Pod 启动延迟、资源碎片。
设置警报:当 HPA 长时间达到 maxReplicas 且 CPU 仍高于目标时,触发告警。
完成!enjoy it!