封面


工具获取
由于工具可能会实时维护,推文内代码更新较为麻烦,因此建议从以下仓库获取完整代码和例子,文末提供工具函数完整代码(但该代码在代码维护后可能不会同步更新)。
gitee
github
fileexchange
数据格式
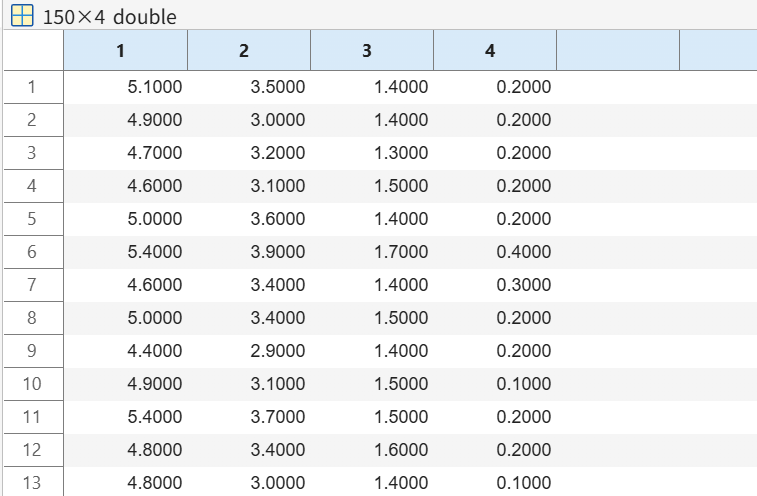
代码有单矩阵和双矩阵两种输入模式:单矩阵输入(X)是二维数值矩阵,S 行 N 列,其中每一行代表一个样本(sample),每一列代表一个属性,双矩阵输入则要求一个大小为 S 行 N 列的矩阵(X)与一个 S 行 M 列的矩阵(Y),
例如矩阵输入(X)可以长这样:
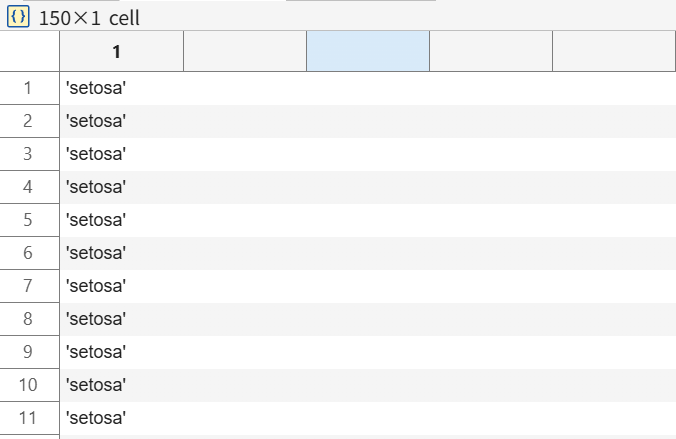
数据的分组 (Group) 是一个 S 行 1 列的列向量,可以是元胞数组或者数值数组。例如分组 (Group)可以长这样:
基本使用:单矩阵输入
以鸢尾花数据集为例:
matlab
% Load Fisher's iris dataset (150 samples, 4 features, 3 species)
% 加载鸢尾花数据集(150个样本,4个特征,3个品种)
fisher = load("fisheriris.mat");
X = fisher.meas;            % 150×4 feature matrix / 特征矩阵
group = fisher.species;     % Species labels / 品种标签
label = {'sepal-length', 'sepal-width', 'petal-length', 'petal-width'};

% Create pairplot object with customized visualization
% 创建散点图矩阵对象,自定义可视化风格
SP = SPairplot(X, 'Group', group, 'DiagType', 12, 'UpperType', 11, 'LowerType', 13);
SP.draw();

% Set X-labels and Y-labels
% 设置 X 轴标签和 Y 轴标签
SP.setXLabelString(label);
SP.setYLabelString(label);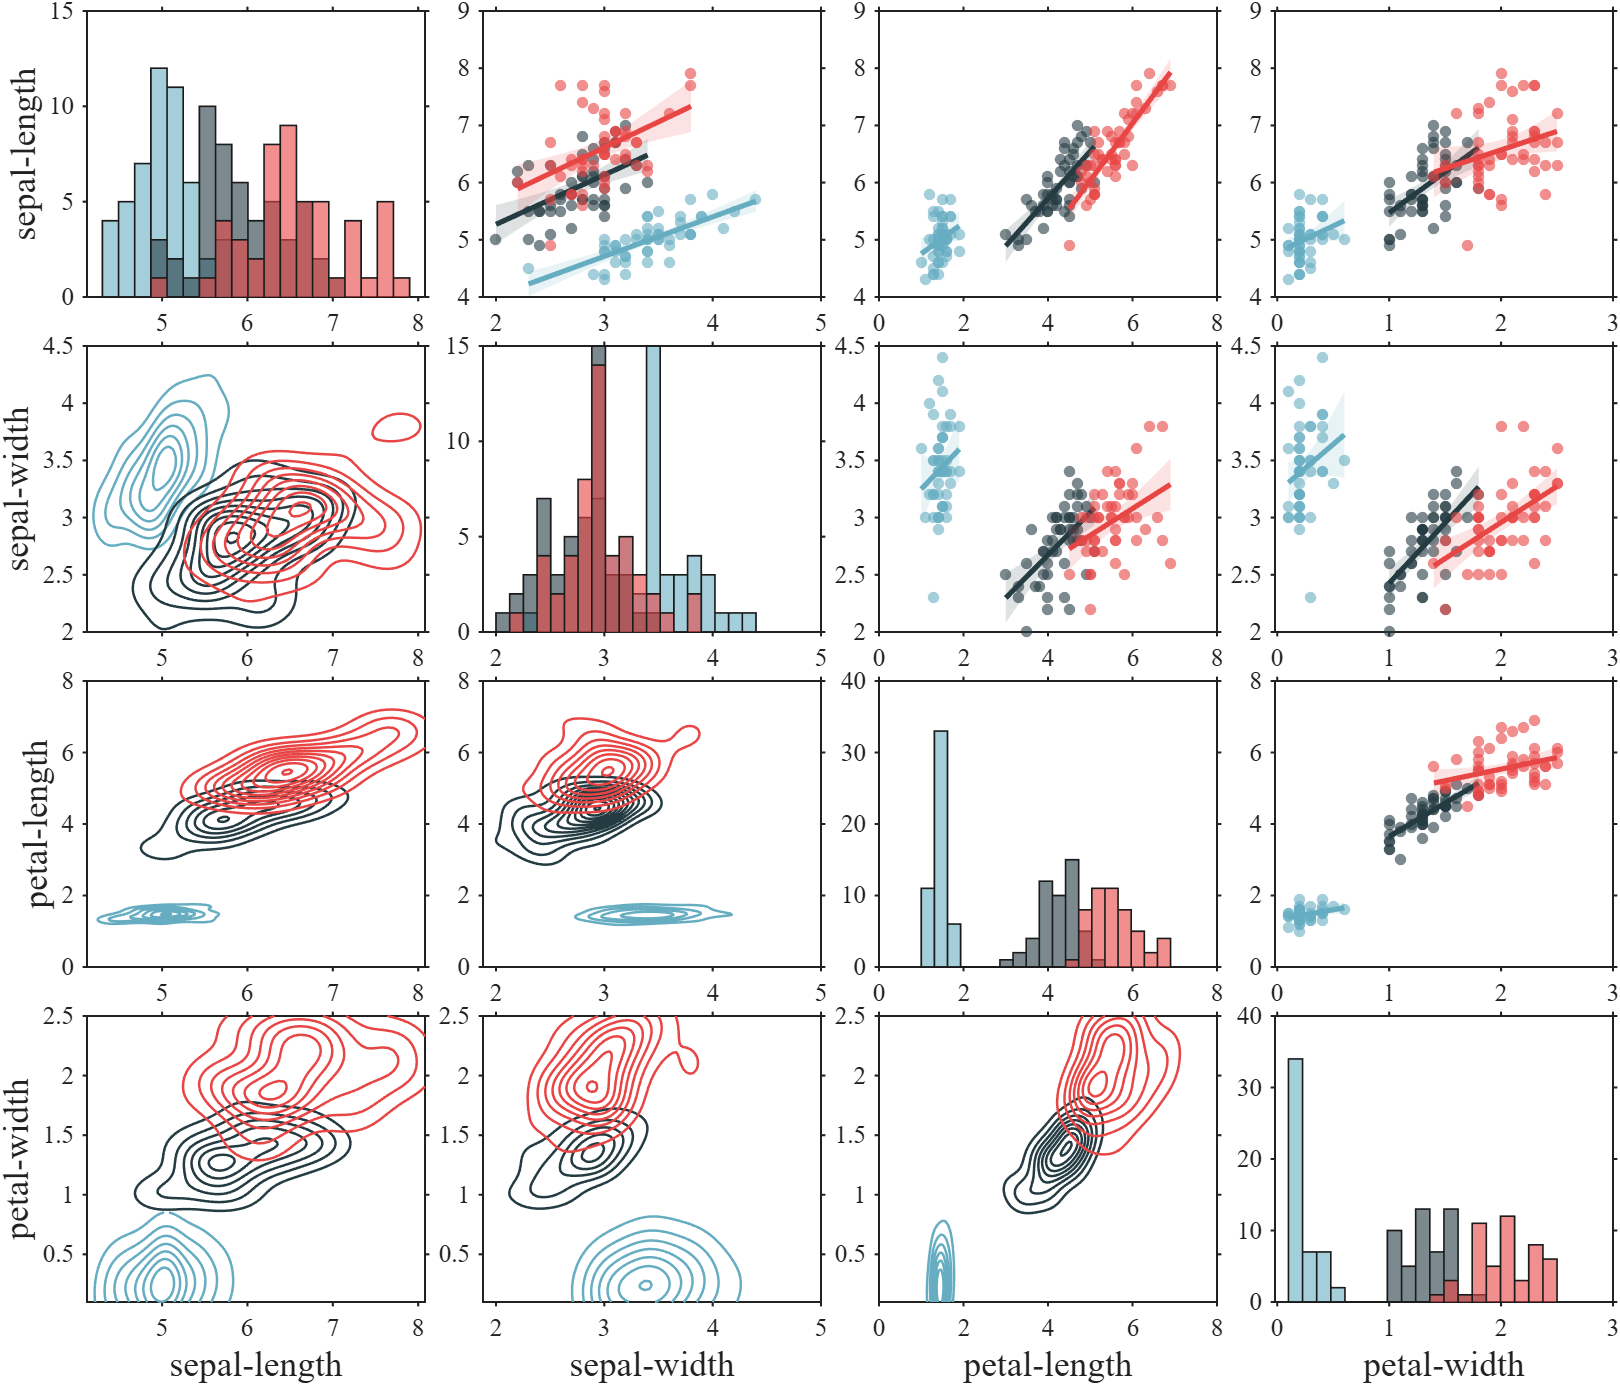
全部绘图样式
DiagType, BottomType and RightType
UpperType and LowerType
基本使用:双矩阵输入
双矩阵输入的时候,UpperType 和 DiagType 不起作用:
matlab
% Generate synthetic data with three groups (150 samples, 6 features total)
% 生成包含三个分组的合成数据(150个样本,共6个特征)
P1 = mvnrnd([0,20,0,10,8,7], eye(6).*6, 50);
P2 = mvnrnd([10,5,15,0,4,2], eye(6).*8, 50);
P3 = mvnrnd([10,15,0,0,2,3], eye(6).*[3,9,2,1,4,4], 50);
G  = [ones(50,1)*1; ones(50,1)*2; ones(50,1)*3];  % Group labels / 分组标签

% Split into X (first 4 variables) and Y (last 2 variables)
% 拆分为 X(前4个变量)和 Y(后2个变量)
XY = [P1; P2; P3];
X = XY(:, 1:4);
Y = XY(:, 5:6);

% Create pairplot with two variable sets (X vs Y)
% 创建双变量集的散点图矩阵(X 与 Y 的对比)
% Note: When X and Y are both provided, only LowerType (off-diagonal below)
% is effective. Upper triangle and diagonal are automatically disabled.
% 注意:当同时输入 X 和 Y 时,仅 LowerType(下三角区域)生效,
% 上三角和对角线区域自动禁用。
SP = SPairplot(X, Y, 'Group', G, 'LowerType', 9);
SP.draw();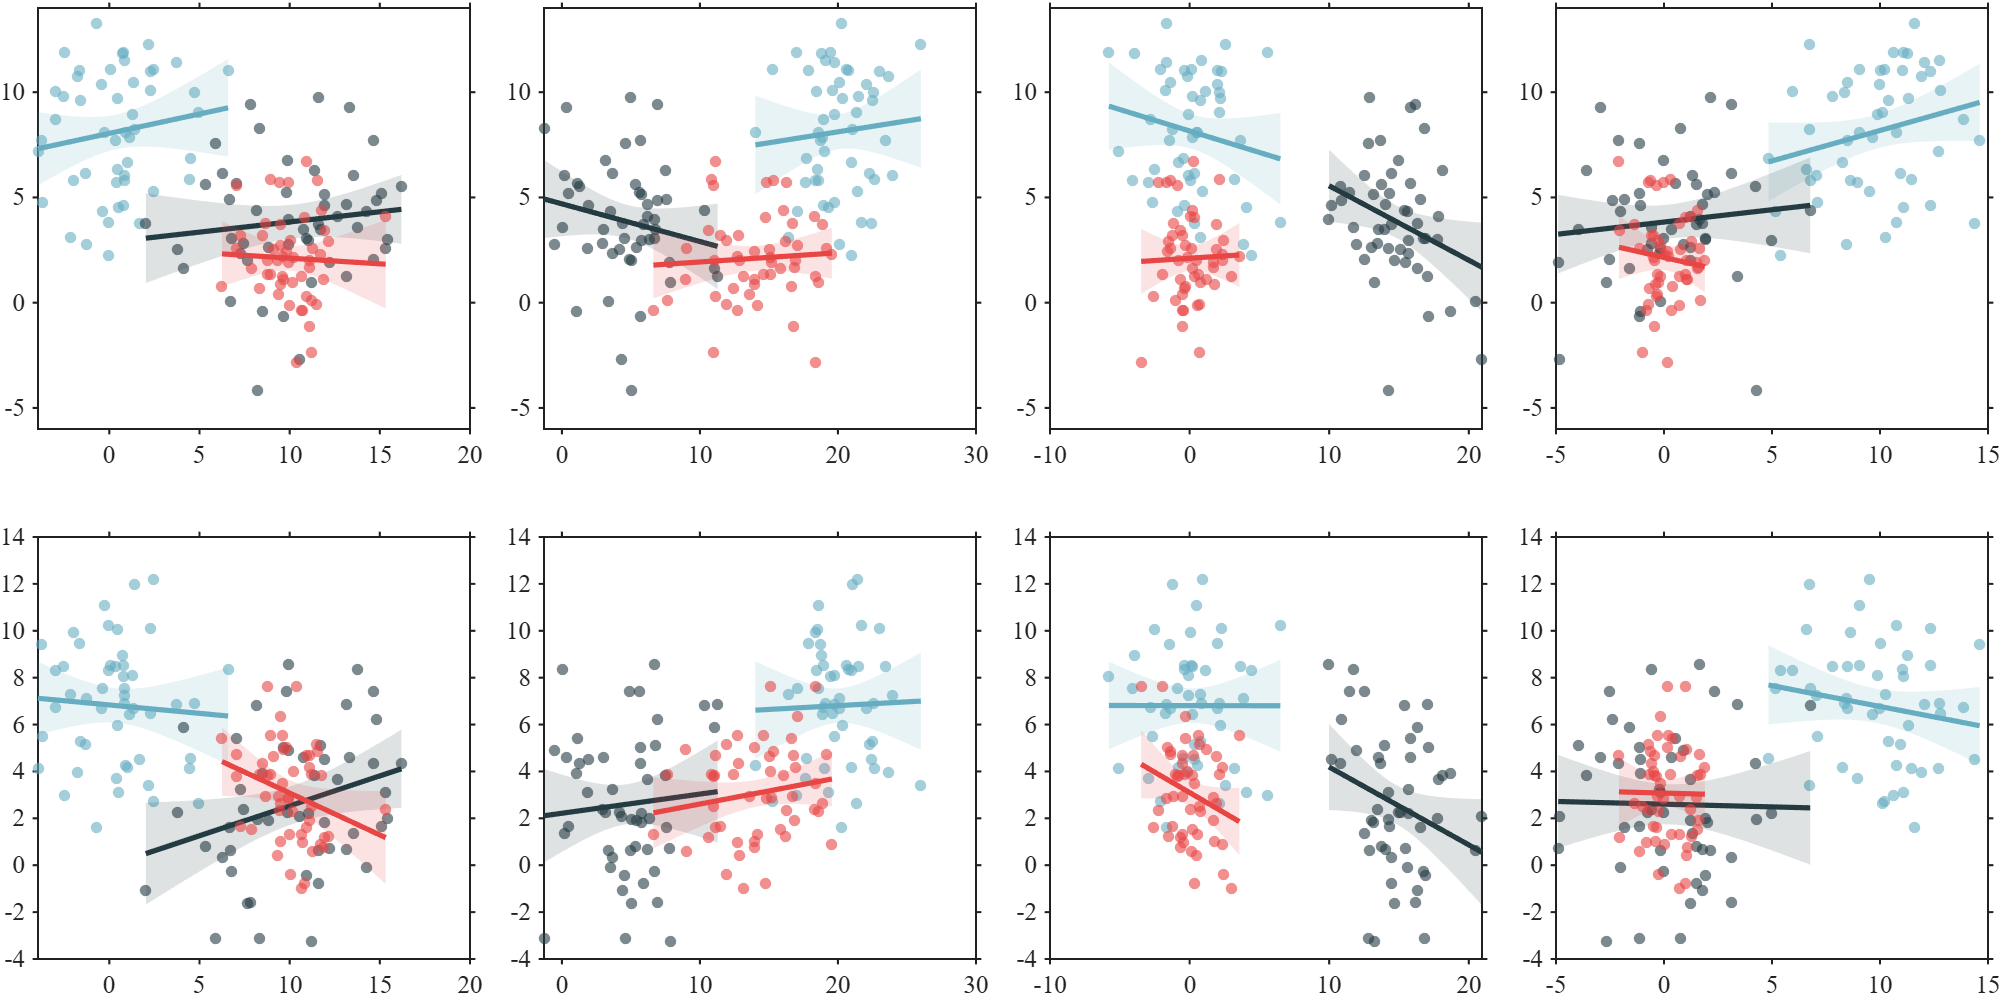
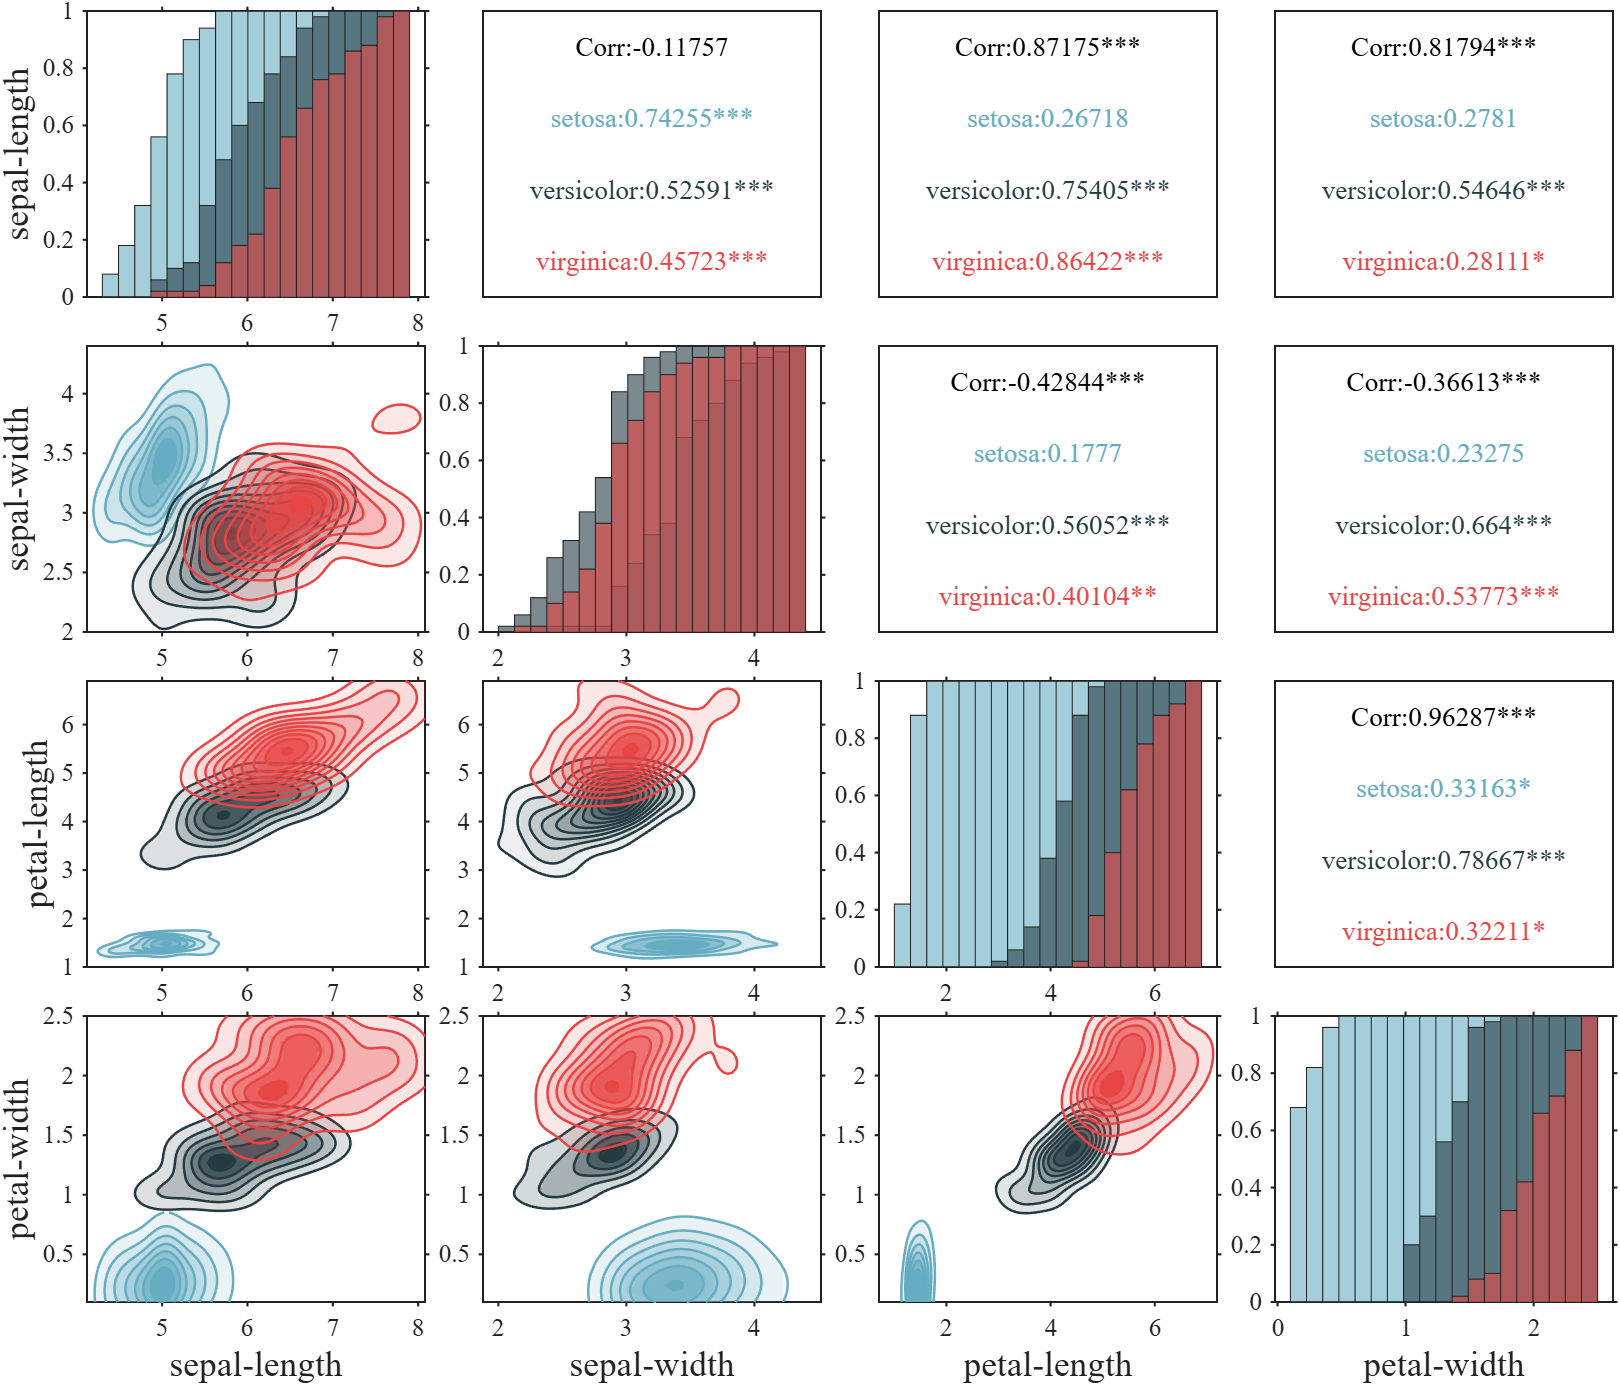
子图属性设置
使用函数:
- obj.setAxes()
设置子图属性
matlab
fisher = load("fisheriris.mat");
X = fisher.meas;
group = fisher.species;
label = {'sepal-length', 'sepal-width', 'petal-length', 'petal-width'};

SP = SPairplot(X, 'Group', group, 'DiagType', 1, 'UpperType', 9, 'LowerType', 2);

% set CData
SP.CData = [119,69,133; 56,108,155; 33,160,122] ./ 255;
SP.draw();

% Set X-labels and Y-labels
SP.setXLabelString(label);
SP.setYLabelString(label);


% Customize subplot appearance
% 自定义子图外观
SP.setAxes('Box','off', 'LineWidth',1.5, 'XGrid','on', 'YGrid','on')
SP.setXLabel('FontWeight','bold', 'Color',[0,0,.8])
SP.setYLabel('FontWeight','bold', 'Color',[.8,0,0])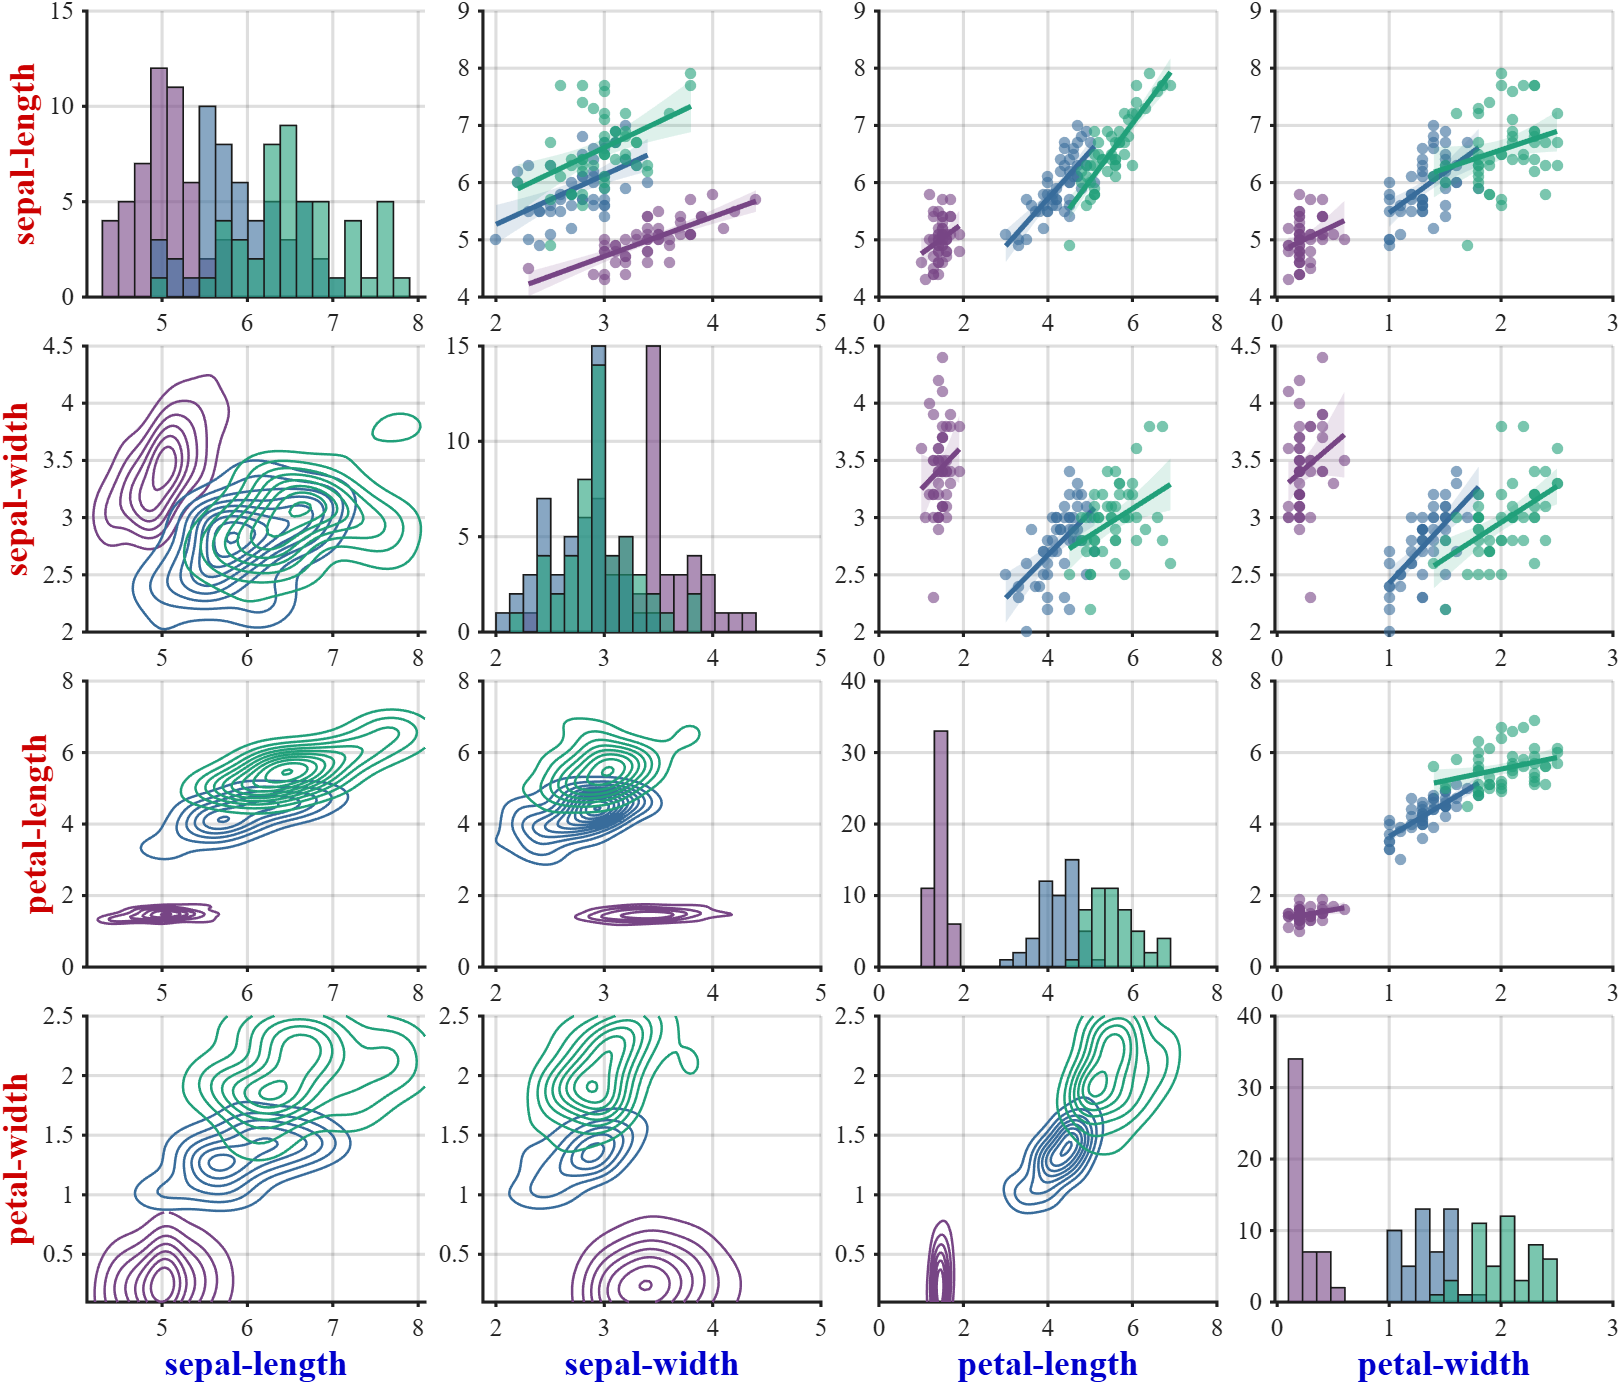
添加图例
matlab
fisher = load("fisheriris.mat");
X = fisher.meas;
group = fisher.species;
label = {'sepal-length', 'sepal-width', 'petal-length', 'petal-width'};
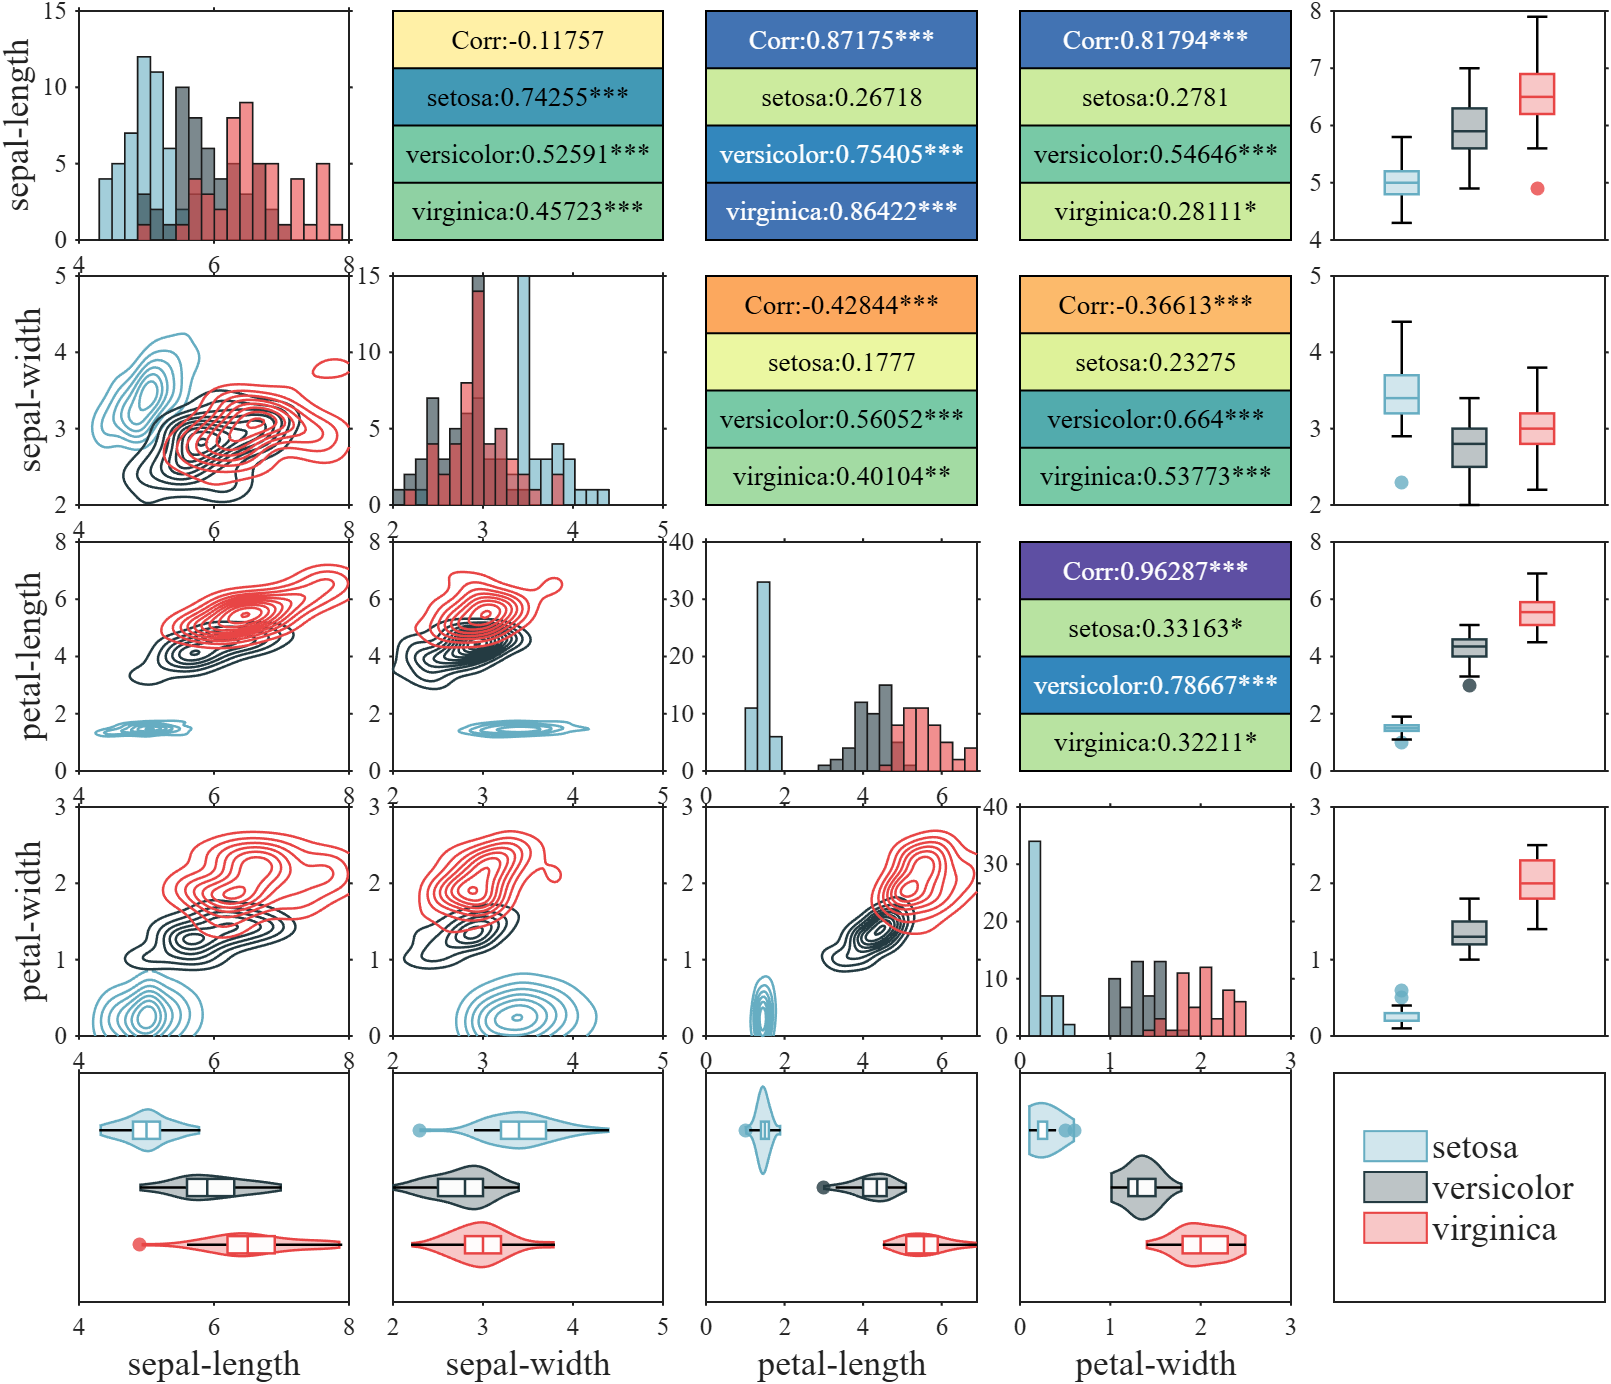
SP = SPairplot(X, 'Group', group, 'DiagType', 10, 'UpperType', 9, 'LowerType', 2);
% set CData
SP.CData = [211, 43, 43; 61, 96,137; 249,206, 61; 76,103, 86; 80, 80, 80]./255;
SP.Padding = [.08, .08, .2, .04];
SP.draw();
% Set X-labels and Y-labels
SP.setXLabelString(label);
SP.setYLabelString(label);
legend(SP.axMat{4, 4}, SP.GroupLabel, 'FontSize',17, 'Position',[.82, .88, .12, .08])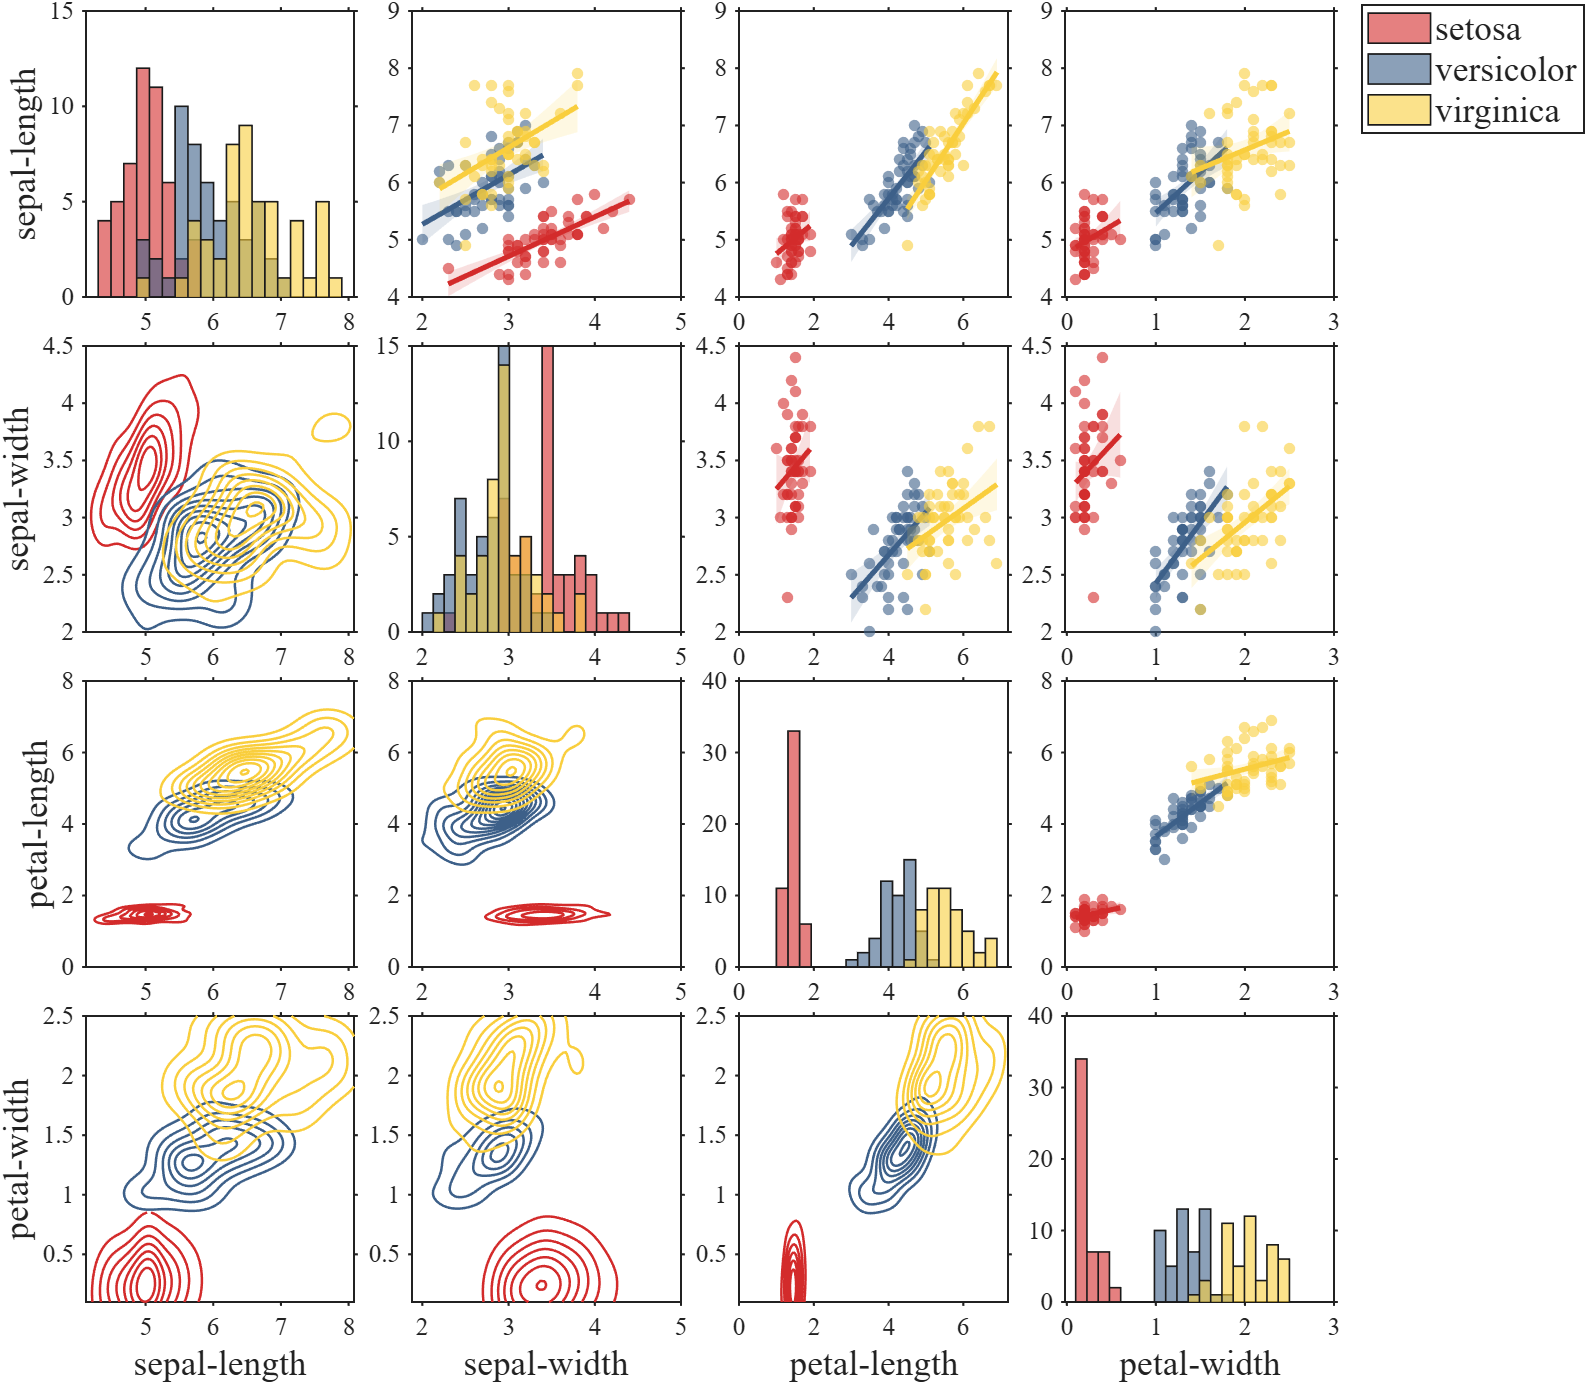
单矩阵输入:添加边际图
matlab
% Load Fisher's iris dataset (150 samples, 4 features, 3 species)
% 加载鸢尾花数据集(150个样本,4个特征,3个品种)
fisher = load("fisheriris.mat");
X = fisher.meas;            % 150×4 feature matrix / 特征矩阵
group = fisher.species;     % Species labels / 品种标签
label = {'sepal-length', 'sepal-width', 'petal-length', 'petal-width'};

% Create pairplot object with customized visualization
% 创建散点图矩阵对象,自定义可视化风格
SP = SPairplot(X, 'Group', group);
SP.DiagType = 14;
SP.UpperType = 11;
SP.LowerType = 14;
SP.BottomType = 12;
SP.RightType = 11;
SP.CornerType = 1;
SP.draw();

% Set X-labels and Y-labels
% 设置 X 轴标签和 Y 轴标签
SP.setXLabelString(label);
SP.setYLabelString(label);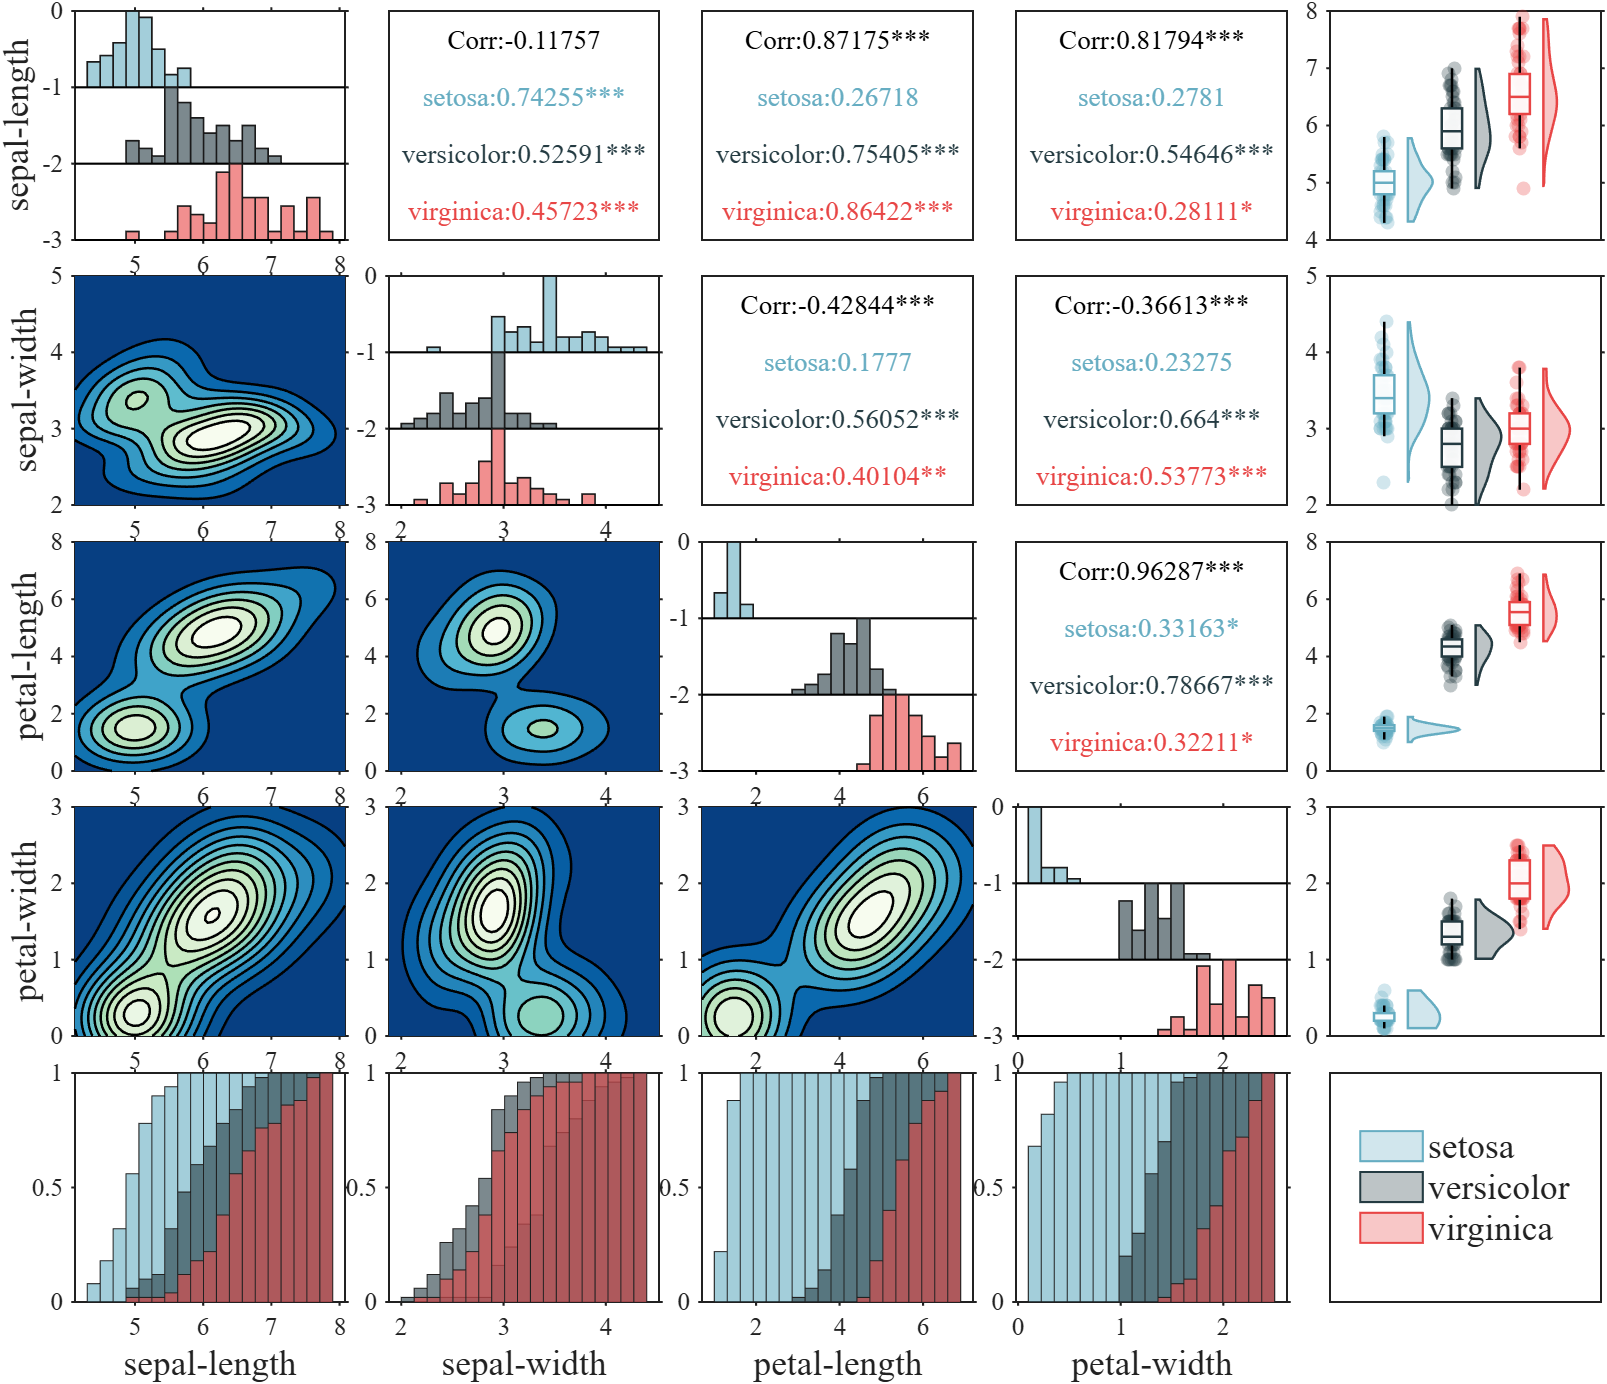
双矩阵输入:添加边际图
matlab
% Generate synthetic data with three groups (150 samples, 6 features total)
% 生成包含三个分组的合成数据(150个样本,共6个特征)
P1 = mvnrnd([0,20,0,10,8,7], eye(6).*6, 50);
P2 = mvnrnd([10,5,15,0,4,2], eye(6).*8, 50);
P3 = mvnrnd([10,15,0,0,2,3], eye(6).*[3,9,2,1,4,4], 50);
G  = [ones(50,1)*1; ones(50,1)*2; ones(50,1)*3];  % Group labels / 分组标签

% Split into X (first 4 variables) and Y (last 2 variables)
% 拆分为 X(前4个变量)和 Y(后2个变量)
XY = [P1; P2; P3];
X = XY(:, 1:4);
Y = XY(:, 5:6);

% Create pairplot with two variable sets (X vs Y)
% 创建双变量集的散点图矩阵(X 与 Y 的对比)
% Note: When X and Y are both provided, only LowerType (off-diagonal below)
% is effective. Upper triangle and diagonal are automatically disabled.
% 注意:当同时输入 X 和 Y 时,仅 LowerType(下三角区域)生效,
% 上三角和对角线区域自动禁用。
fig = figure('Units','normalized', 'Position',[.1,.2,.7,.65]);
SP = SPairplot(fig, X, Y, 'Group', G);
SP.GroupLabel = {'G1','G2','G3'};
SP.LowerType = 7;
SP.BottomType = 12;
SP.RightType = 14;
SP.CornerType = 1;
SP.draw();


SP.setXLabelString({'X1', 'X2', 'X3', 'X4'});
SP.setYLabelString({'Y1', 'Y2'});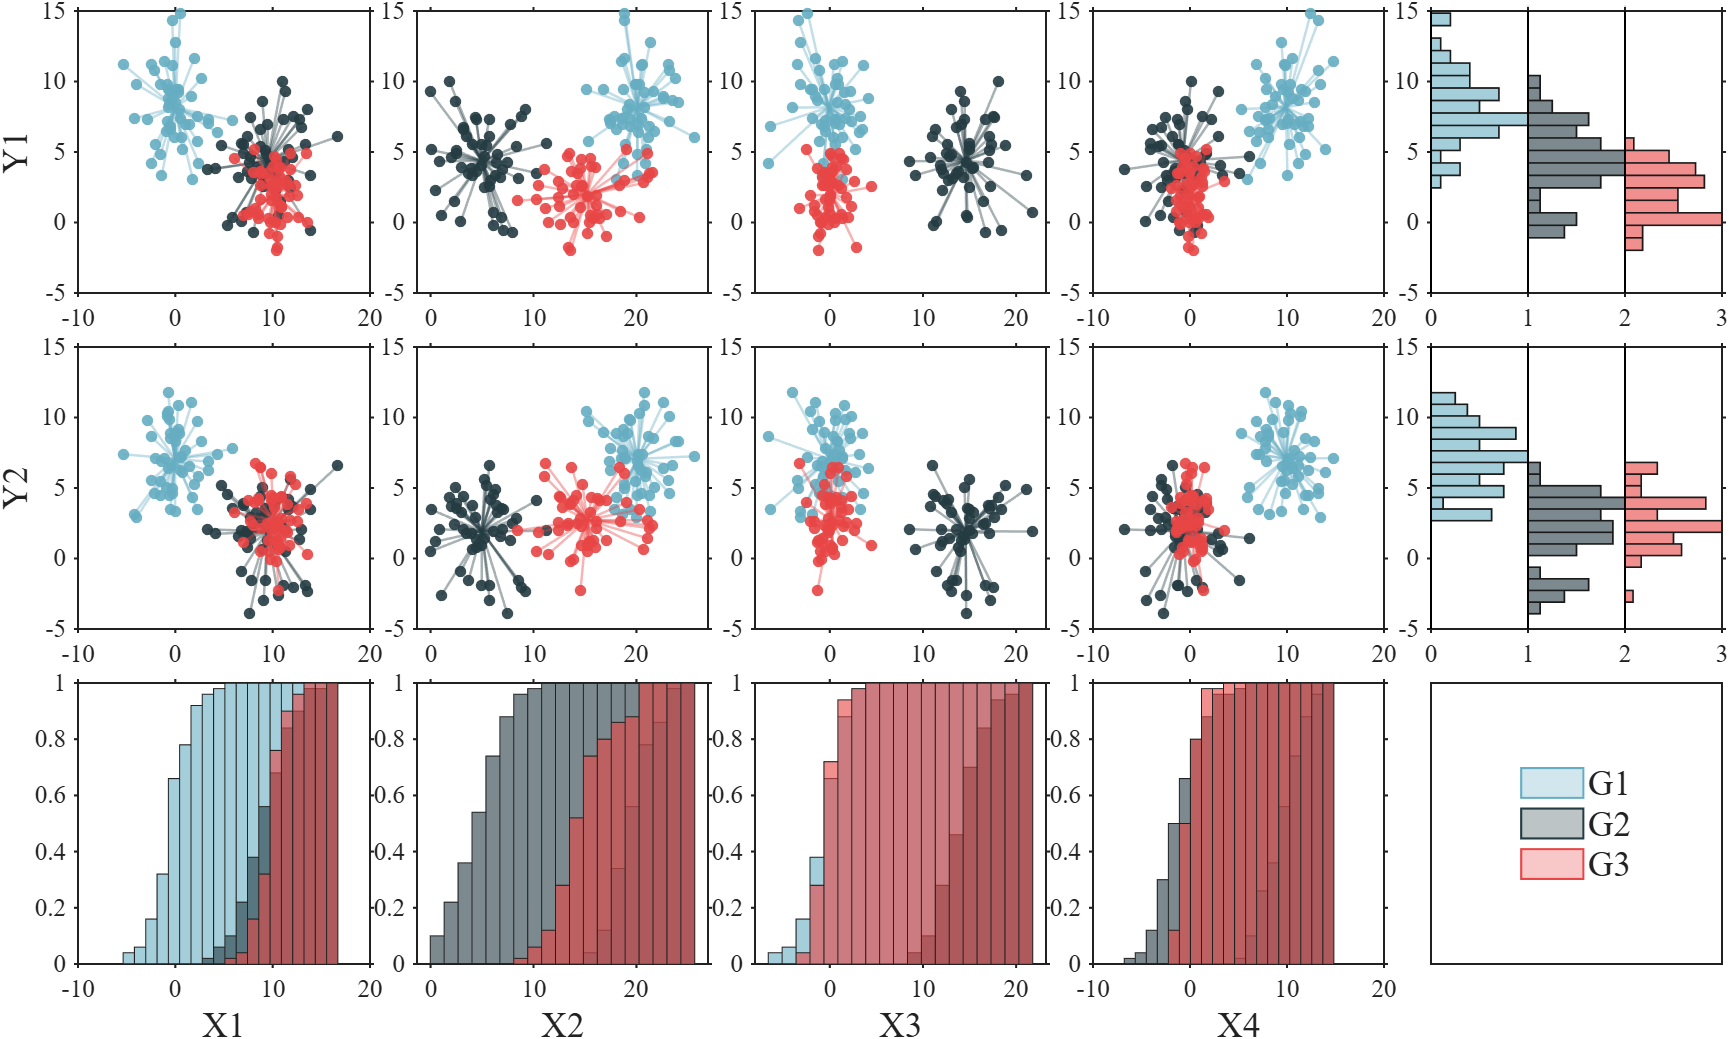
完整代码
matlab
classdef SPairplot < handle
% SPairplot Create and customize pairplot (scatter plot matrix | 散点图矩阵)
% SP = SPairplot(X); creates a pairplot from an S-by-N numerical matrix X,
% where rows (S) are samples and columns (N) are variables.
% 通过 SxN 大小的数值矩阵 X 创建散点图矩阵对象,行 (S) 表示样本,列 (N) 表示变量。
%
% SP = SPairplot(X, Y); creates a pairplot comparing two datasets. X is S-by-N
% and Y is S-by-M, showing relationships between X-variables and Y-variables.
% 通过两组数据矩阵 X 和 Y 创建散点图矩阵对象,X 为 SxN 大小,Y 为 SxM 大小,
% 展示 X 变量与 Y 变量之间的关系。
%
% SP = SPairplot(fig, ___); creates a pairplot in the specified figure.
% 在指定图窗中生成散点图矩阵对象。
%
% SP = SPairplot(___, propName, propVal); specifies property name-value pairs
% when creating the pairplot object.
% 创建散点图矩阵对象时为其设置属性。
%
% SP.propName = propVal; sets properties for the pairplot object after
% creation, before rendering.
% 创建散点图矩阵对象后,绘图前为其设置属性。
%
% SP = SP.draw(); renders the pairplot.
% 渲染散点图矩阵对象。
properties
fig = [] % Figure handle.
axMat %
axProp = {'Box','on', 'FontName','Times New Roman', 'FontSize',12, ...
'TickDir','out', 'LineWidth',1}
axWidth
axHeight
arginList = {'CData', 'Group', 'Padding','SPacing', ...
'DiagType', 'UpperType', 'LowerType', 'BottomType','RightType'}
X = [] % S-by-N matrix : X = [X1, X2, ..., XN], where Xn is column vector
Y = [] % S-by-M matrix : Y = [Y1, Y2, ..., YM], where Ym is column vector
Group = []
GroupLabel
GroupNum
LowerType = 2
UpperType = 1
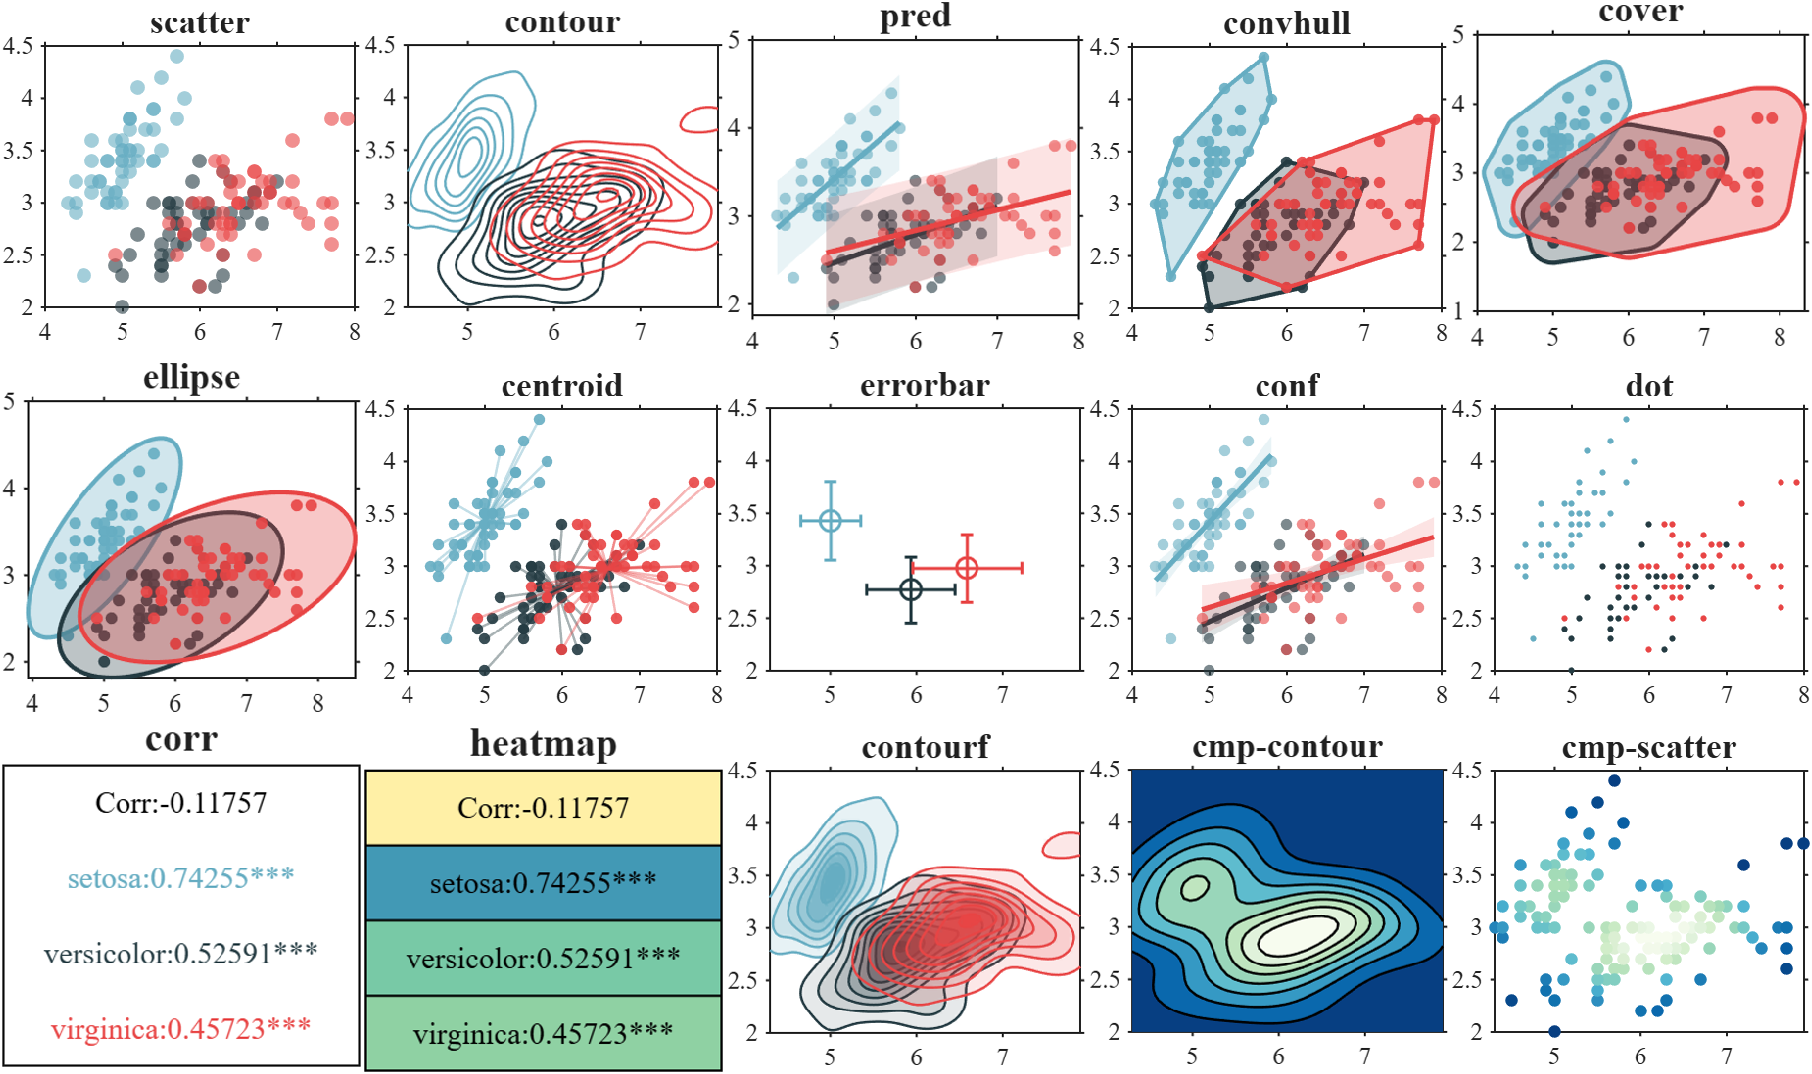
% ===========================================================================
% No. | Type | Description
% -----|--------------|------------------------------------------------------
% 0 | 'none' | None
% 1 | 'scatter' | Scatter plot with filled markers
% 2 | 'contour' | Contour plot based on kernel density estimation
% 3 | 'pred' | Linear regression with prediction interval (polyfit)
% 4 | 'convhull' | Scatter plot with convex hull outline
% 5 | 'cover' | Scatter plot with buffered/expanded convex hull (rounded)
% 6 | 'ellipse' | Scatter plot with confidence ellipse (99%)
% 7 | 'centroid' | Star plot: points connected to group centroid
% 8 | 'errorbar' | Cross error bar (mean ± std) for each group
% 9 | 'conf' | Linear regression with confidence interval (fitlm)
% 10 | 'dot' | Scatter plot using '.' marker (single-pixel points)
% 11 | 'corr' | Display data correlations and significance markers.
% 12 | 'heatmap' | Heatmap with data correlations
% 13 | 'contourf' | Filled contour plot based on kernel density estimation
% 14 | 'cmp-contour'| Contour plot with custom colormap
% 15 | 'cmp-scatter'| Scatter plot with custom colormap
% ---------------------------------------------------------------------------
DiagType = 1
BottomType = 0
RightType = 0
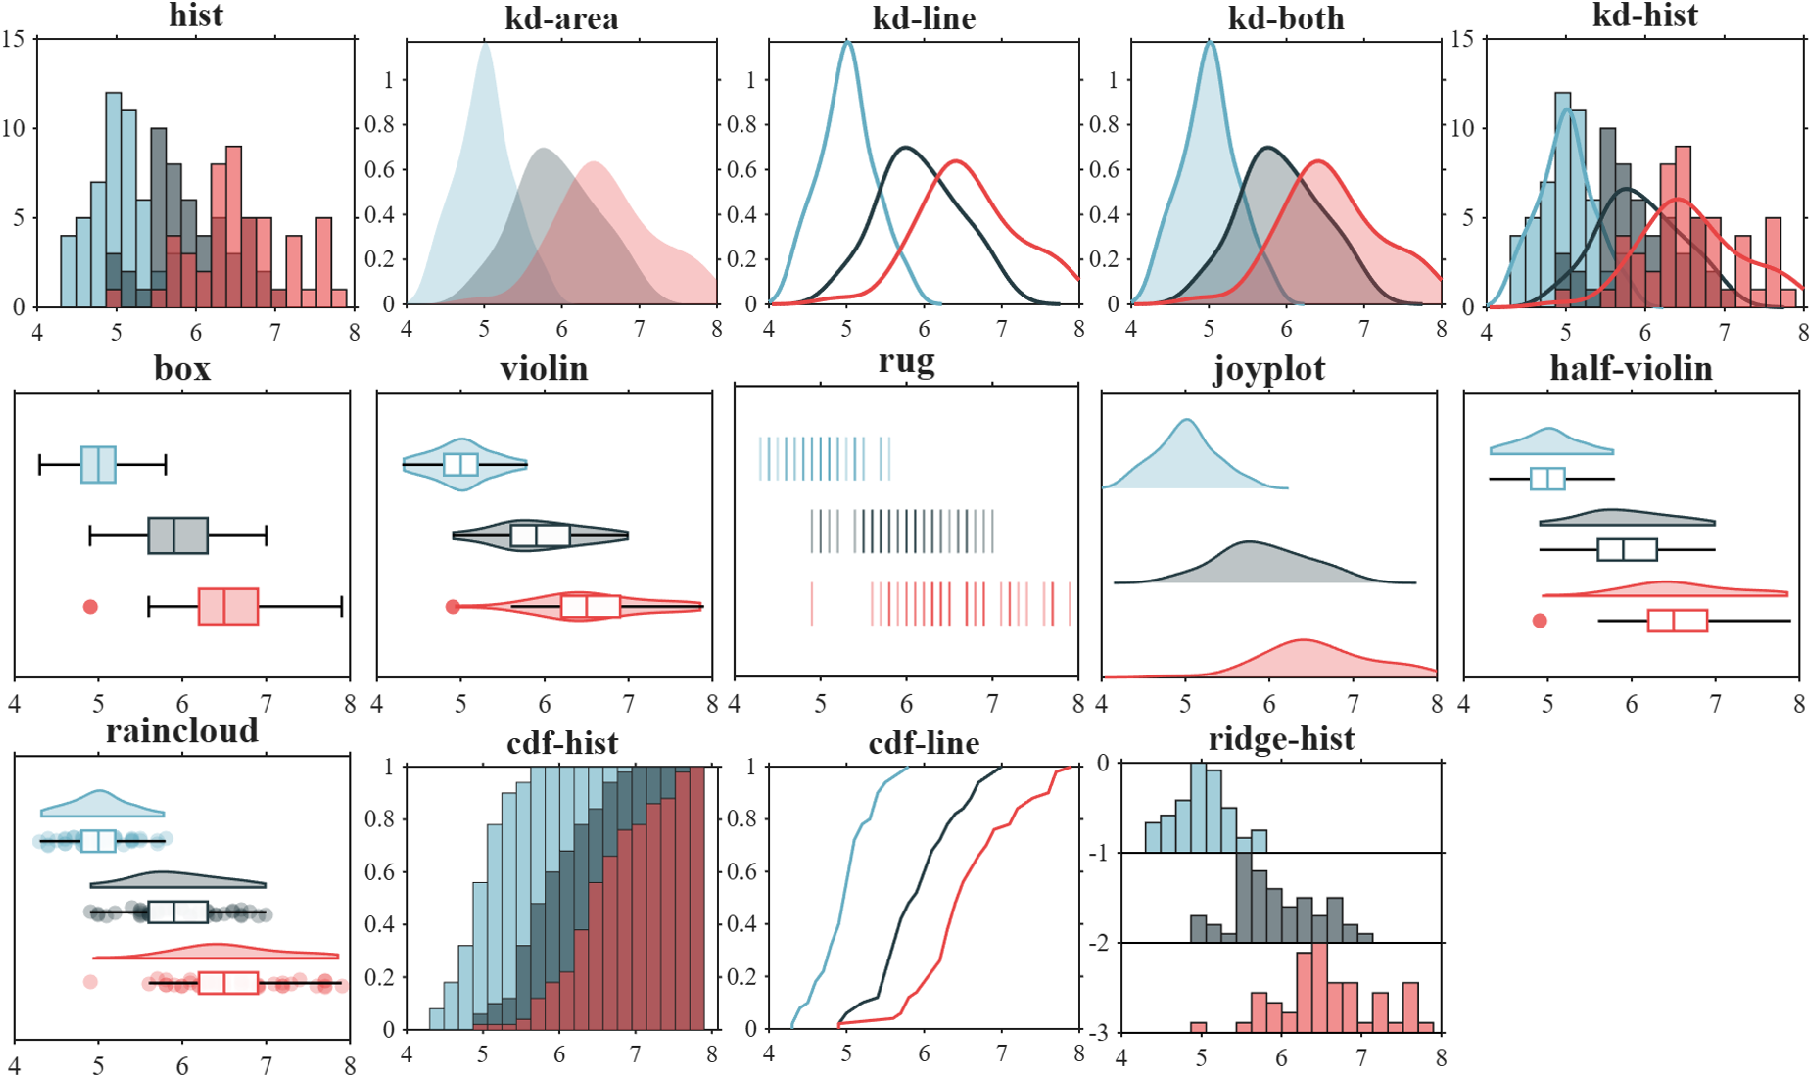
% ===========================================================================
% No. | Type | Description
% -----|----------------|----------------------------------------------------
% 0 | 'none' | None
% 1 | 'hist' | Standard histogram
% 2 | 'kd-area' | Kernel density estimation area (filled)
% 3 | 'kd-line' | Kernel density estimation line only
% 4 | 'kd-both' | Kernel density area + line
% 5 | 'kd-hist' | Histogram overlayed with kernel density line
% 6 | 'box' | Box plot (median, quartiles, outliers)
% 7 | 'violin' | Full violin plot (symmetric KDE)
% 8 | 'rug' | Rug plot (vertical/horizontal line scatter)
% 9 | 'joyplot' | Joyplot / Ridgeline plot (stacked KDE)
% 10 | 'half-violin' | Half violin plot (right side only, compact)
% 11 | 'raincloud' | Raincloud plot (half-violin + scatter)
% 12 | 'cdf-hist' | Empirical cumulative distribution function (histogram-based ECDF)
% 13 | 'cdf-line' | Empirical cumulative distribution function (step/line ECDF)
% 14 | 'ridge-hist' | Ridge-style histogram with vertical offsets
% ---------------------------------------------------------------------------
CornerType = 0
% ===========================================================================
% No. | Type | Description
% -----|----------------|----------------------------------------------------
% 0 | 'none' | None
% 1 | 'legend' | Legend
% 2 | 'bar' | Bar chart showing the number of samples in each group
% ---------------------------------------------------------------------------
% For a (M+1)-by-(N+1) size plot matrix:
% ┌────────────────────────────────────────────────────────┐
% | ┌─────────┐ ┌─────────┐ ┌─────────┐ ┌─────────┐ |
% | │ Diag │ │ Upper │ ... │ Upper │ │ Right │ |
% | | (1,1) | | (1,2) | ... | (1,N) | | (1,N+1) | |
% | └─────────┘ └─────────┘ └─────────┘ └─────────┘ |
% | ┌─────────┐ ┌─────────┐ ┌─────────┐ ┌─────────┐ |
% | │ Lower │ │ Diag │ ... │ Upper │ │ Right │ |
% | | (2,1) | | (2,2) | ... | (2,N) | | (2,N+1) | |
% | └─────────┘ └─────────┘ └─────────┘ └─────────┘ |
% | ⋮ ⋮ ⋮ ⋮ ⋮ ⋮ ⋮ ⋮ |
% | ┌─────────┐ ┌─────────┐ ┌─────────┐ ┌─────────┐ |
% | │ Lower │ │ Lower │ ... │ Diag │ │ Right │ |
% | | (M,1) | | (M,2) | ... | (M,N) | | (M,N+1) | |
% | └─────────┘ └─────────┘ └─────────┘ └─────────┘ |
% | |
% | ┌─────────┐ ┌─────────┐ ┌─────────┐ ┌─────────┐ |
% | │ Bottom │ │ Bottom │ ... │ Bottom │ │ Corner │ |
% | | (M+1,1) | | (M+1,2) | ... | (M+1,N) | |(M+1,N+1)| |
% | └─────────┘ └─────────┘ └─────────┘ └─────────┘ |
% └────────────────────────────────────────────────────────┘
Padding = [.08, .08, .04, .04]; % [left(l), bottom(b), right(r), top(t)]
Spacing = [.1, .1]; % [horizontal(h), vertical(v)]
% For a R-by-C size plot matrix:
% ┌──────────────────────────────────────────────────────────────────┐
% | ↑ |
% | padding top |
% | ↓ |
% | ┌─────────┐ ┌─────────┐ ┌─────────┐ |
% | │ subplot │ ←--------→ │ subplot │...│ subplot │ |
% | | (1,1) | spacing(h) | (1,2) |...| (1,C) | |
% | └─────────┘ /(C - 1) └─────────┘ └─────────┘ |
% | ↑ ↑ ↑ |
% | spacing(v)/(R - 1) spacing(v)/(R - 1) |
% | ↓ ↓ ↓ |
% | ┌─────────┐ ┌─────────┐ ┌─────────┐ |
% | │ subplot │ ←--------→ │ subplot │...│ subplot │ |
% | | (2,1) | | (2,2) |...| (2,C) | |
% | └─────────┘ spacing(h) └─────────┘ └─────────┘ |
% | ⋮ ⋮ /(C - 1) ⋮ ⋮ ⋮ ⋮ |
% | ┌─────────┐ ┌─────────┐ ┌─────────┐ |
% | ←-----→ │ subplot │ ←--------→ │ subplot │...│ subplot │ ←-----→ |
% | padding | (R,1) | | (R,2) |...| (R,C) | padding |
% | left └─────────┘ └─────────┘ └─────────┘ right |
% | ↑ |
% | padding bottom |
% | ↓ |
% └──────────────────────────────────────────────────────────────────┘
CData = [102,173,194; 36, 59, 66; 232, 69, 69; 194,148,102; 54, 43, 33]./255;
% Alternative color schemes :
% CData = [211, 43, 43; 61, 96,137; 249,206, 61; 76,103, 86; 80, 80, 80]./255;
% CData = [223,122, 94; 60, 64, 91; 130,178,154; 244,241,222; 240,201,134]./255;
% CData = [122,117,119; 255,163, 25; 135,146, 73; 126, 15, 4; 30, 93,134]./255;
% CData = [198,199,201; 38, 74, 96; 209, 80, 51; 241,174, 44; 12, 13, 15]./255;
% CData = [235, 75, 55; 77,186,216; 58, 84,141; 2,162,136; 245,155,122]./255;
% CData = [ 23, 23, 23; 121, 17, 36; 31, 80, 91; 44, 9, 75; 61, 36, 42]./255;
% CData = [ 47, 62, 66; 203,129, 70; 0, 64,115; 152, 58, 58; 20, 72, 83]./255;
Colormap = [.97, .99, .94; .95, .98, .92; .92, .97, .90;
.90, .96, .88; .88, .95, .86; .86, .94, .83;
.84, .94, .81; .82, .93, .79; .79, .92, .77;
.75, .90, .75; .72, .89, .74; .68, .88, .72;
.64, .86, .72; .60, .84, .73; .55, .83, .75;
.51, .81, .76; .46, .79, .78; .41, .76, .79;
.37, .74, .81; .32, .71, .82; .28, .68, .81;
.25, .64, .79; .21, .60, .77; .18, .56, .75;
.14, .52, .73; .11, .49, .71; .07, .45, .69;
.04, .41, .68; .03, .37, .64; .03, .33, .59;
.03, .29, .55; .03, .25, .51];
corrProp = {'Type','Pearson'}
pvalLevels = [0.05, 0.01, 0.001]
corrCLim = [-1, 1];
corrColormap = [.62, .00, .26; .69, .08, .28; .76, .16, .29;
.83, .24, .31; .87, .30, .30; .91, .36, .28;
.95, .42, .27; .97, .49, .29; .98, .58, .33;
.99, .66, .37; .99, .73, .42; .99, .79, .47;
1.0, .85, .52; 1.0, .90, .58; 1.0, .94, .65;
1.0, .98, .72; .98, .99, .72; .95, .98, .68;
.92, .97, .63; .87, .95, .60; .80, .92, .62;
.72, .89, .63; .64, .86, .64; .56, .82, .64;
.47, .79, .65; .39, .75, .65; .32, .67, .68;
.26, .60, .71; .20, .53, .74; .26, .45, .70;
.31, .38, .67; .37, .31, .64];
end
properties (Hidden)
S, M, N, R, C
end
methods
function obj = SPairplot(varargin)
if isa(varargin{1}, 'matlab.ui.Figure')
obj.fig = varargin{1}; varargin(1) = [];
end
obj.Colormap = obj.Colormap(end:-1:1, :);
obj.X = varargin{1};
varargin(1) = [];
obj.S = size(obj.X, 1);
obj.N = size(obj.X, 2);
if (~isempty(varargin)) && isnumeric(varargin{1})
obj.Y = varargin{1};
varargin(1) = [];
obj.M = size(obj.Y, 2);
else
obj.M = size(obj.X, 2);
end
% Parse name-value input arguments.
for i = 1:2:(length(varargin) - 1)
tIndex = ismember(lower(obj.arginList), lower(varargin{i}));
if any(tIndex)
obj.(obj.arginList{tIndex}) = varargin{i + 1};
end
end
end
function obj = draw(obj)
if isempty(obj.fig)
obj.fig = figure('Units','normalized', 'Position',[.05,.05,.65,.88]);
end
set(obj.fig, 'Color',[1,1,1])
if (isnumeric(obj.BottomType)&&obj.BottomType == 0) || ...
(~isnumeric(obj.BottomType)&&strcmpi(obj.BottomType, 'none'))
obj.R = obj.M;
else
obj.R = obj.M + 1;
end
if (isnumeric(obj.RightType)&&obj.RightType == 0) || ...
(~isnumeric(obj.RightType)&&strcmpi(obj.RightType, 'none'))
obj.C = obj.N;
else
obj.C = obj.N + 1;
end
% Process group labels: convert to consecutive indices starting from 1
% 处理分组标签:转换为从1开始的连续索引
if isempty(obj.Group)
obj.Group = ones(obj.S, 1);
if isempty(obj.GroupLabel)
obj.GroupLabel = 'group-1';
end
obj.GroupNum = 1;
else
if isnumeric(obj.Group)
[TGL, ~, obj.Group] = unique(obj.Group);
if isempty(obj.GroupLabel)
obj.GroupLabel = compose('group-%d', TGL);
end
obj.GroupNum = length(TGL);
else
if isempty(obj.GroupLabel)
[obj.GroupLabel, ~, obj.Group] = unique(obj.Group, 'stable');
obj.GroupNum = length(obj.GroupLabel);
else
[~, obj.Group] = ismember(obj.Group, obj.GroupLabel);
obj.Group = obj.Group(:);
obj.GroupNum = length(obj.GroupLabel);
end
end
end
obj.GroupLabel = obj.GroupLabel(:).';
if size(obj.CData, 1) < obj.GroupNum
obj.CData = [obj.CData; .3 + .6.*rand([obj.GroupNum, 3])];
end
% Ensure non-negative spacing and padding
% 确保间距和内边距为非负值
obj.Padding = abs(obj.Padding);
obj.Spacing = abs(obj.Spacing);
% Calculate total horizontal/vertical space occupied by padding and spacing
% 计算内边距和间距占用的总水平/垂直空间
tW = obj.Spacing(1) + obj.Padding(1) + obj.Padding(3);
tH = obj.Spacing(2) + obj.Padding(2) + obj.Padding(4);
% Scale down if total exceeds 0.5 (limit to 50% of figure)
% 若总占用超过0.5则等比缩放到50%
if tW > .5
obj.Spacing(1) = obj.Spacing(1)./tW.*.5;
obj.Padding(1) = obj.Padding(1)./tW.*.5;
obj.Padding(3) = obj.Padding(3)./tW.*.5;
tW = .5;
end
obj.axWidth = (1 - tW)/(obj.C);
if tH > .5
obj.Spacing(2) = obj.Spacing(2)./tH.*.5;
obj.Padding(2) = obj.Padding(2)./tH.*.5;
obj.Padding(4) = obj.Padding(4)./tH.*.5;
tH = .5;
end
obj.axHeight = (1 - tH)/(obj.R);
% Create subplot grid and draw
% 创建子图网格并绘图
XLimSet = repmat([inf, -inf], [obj.C, 1]);
YLimSet = repmat([inf, -inf], [obj.R, 1]);
XLimUpdate = ones(obj.R, obj.C) > 0;
YLimUpdate = ones(obj.R, obj.C) > 0;
for m = 1:obj.R
for n = 1:obj.C
obj.axMat{m, n} = axes('Parent',obj.fig, ...
'Position',[obj.Padding(1) + (n - 1)*(obj.axWidth + obj.Spacing(1)/(obj.C - 1)), ...
obj.Padding(2) + (obj.R - m)*(obj.axHeight + obj.Spacing(2)/(obj.R - 1)), ...
obj.axWidth,obj.axHeight], obj.axProp{:}, 'NextPlot','add');
tAx = obj.axMat{m, n}; tX = obj.X(:, min(n, obj.N));
xlen = max(max(obj.X)) - min(min(obj.X));
if isempty(obj.Y)
tY = obj.X(:, min(m, obj.M));
ylen = max(max(obj.X)) - min(min(obj.X));
else
tY = obj.Y(:, min(m, obj.M));
ylen = max(max(obj.Y)) - min(min(obj.Y));
end
for k = 1:obj.GroupNum
tXk = tX(obj.Group == k);
tYk = tY(obj.Group == k);
if m == obj.R && n == obj.C && obj.R ~= obj.M && obj.C ~= obj.N
XLimUpdate(m, n) = false;
YLimUpdate(m, n) = false;
switch obj.CornerType
case {'legend', 1}
tAx.XLim = [0, 1];
tAx.YLim = [0, 1];
tAx.XTick = [];
tAx.YTick = [];
fill(tAx, [0,1,0] - 2, [0,0,1] - 2, obj.CData(k,:),'FaceAlpha',0.3, ...
'EdgeColor',obj.CData(k,:), 'LineWidth',1)
if k == obj.GroupNum
lgdHdl = legend(tAx, obj.GroupLabel, 'FontSize',17, 'Box','off');
lgdHdl.Position(1) = tAx.Position(1) + tAx.Position(3)/2 - lgdHdl.Position(3)/2;
lgdHdl.Position(2) = tAx.Position(2) + tAx.Position(4)/2 - lgdHdl.Position(4)/2;
end
case {'bar', 2}
fill(tAx, [-.4,.4,.4,-.4] + k, [0,0,1,1].*length(tXk), obj.CData(k,:) ,'FaceAlpha',0.3, ...
'EdgeColor',obj.CData(k,:), 'LineWidth',1)
if k == obj.GroupNum
tAx.XTick = 1:obj.GroupNum;
tAx.XLim = [0, obj.GroupNum + 1];
tAx.XTickLabel = obj.GroupLabel;
end
end
elseif n == obj.C && obj.C ~= obj.N && m <= obj.M
switch obj.RightType
case {'hist', 1}
histogram(tAx, tYk, linspace(min(tY), max(tY), 20), 'FaceColor',obj.CData(k,:),...
'Orientation','horizontal', 'EdgeColor',[1 1 1]*.1, 'FaceAlpha',0.6, 'LineWidth',.8)
tAx.YLim = [min(tY), max(tY)];
case {'kd-area', 2}
[f, yi] = ksdensity(tYk);
fill(tAx, [f, 0], [yi, yi(1)], obj.CData(k,:),...
'FaceAlpha',0.3, 'EdgeColor','none')
tAx.YLim = [min(tY), max(tY)];
case {'kd-line', 3}
[f, yi] = ksdensity(tYk);
plot(tAx, f, yi, 'Color',obj.CData(k,:), 'LineWidth',2)
tAx.YLim = [min(tY), max(tY)];
case {'kd-both', 4}
[f, yi] = ksdensity(tYk);
fill(tAx, [f, 0], [yi, yi(1)], obj.CData(k,:),...
'FaceAlpha',0.3, 'EdgeColor','none')
plot(tAx, f, yi, 'Color',obj.CData(k,:), 'LineWidth',2, 'HandleVisibility','off')
tAx.YLim = [min(tY), max(tY)];
case {'kd-hist', 5}
HHdl = histogram(tAx, tYk, linspace(min(tY), max(tY), 20), 'FaceColor',obj.CData(k,:),...
'Orientation','horizontal', 'EdgeColor',[1 1 1]*.1, 'FaceAlpha',0.6, 'LineWidth',.8);
[f, yi] = ksdensity(tYk);
plot(tAx, f.*size(tYk, 1).*HHdl.BinWidth, yi, 'Color',obj.CData(k,:), 'LineWidth',2, 'HandleVisibility','off')
tAx.YLim = [min(tY), max(tY)];
case {'box', 6}
tjDataY = tYk; fullDataY = tjDataY;
outliBool = isoutlier(tjDataY, 'quartiles');
outli = tjDataY(outliBool);
scatter(tAx, repmat(k, [sum(outliBool), 1]), outli, 45, 'filled', ...
'CData',obj.CData(k,:), 'LineWidth',1.2, 'MarkerFaceAlpha',0.8, 'HandleVisibility','off')
tjDataY(outliBool) = [];
qt25 = quantile(fullDataY, 0.25);
qt75 = quantile(fullDataY, 0.75);
med = median(fullDataY);
plot(tAx, [k, k], [max(tjDataY), qt75], 'LineWidth',1.2, 'Color',[0,0,0], 'HandleVisibility','off')
plot(tAx, [k, k], [min(tjDataY), qt25], 'LineWidth',1.2, 'Color',[0,0,0], 'HandleVisibility','off')
plot(tAx, [-0.15, 0.15] + k, [max(tjDataY), max(tjDataY)], 'LineWidth',1.2, 'Color',[0,0,0], 'HandleVisibility','off')
plot(tAx, [-0.15, 0.15] + k, [min(tjDataY), min(tjDataY)], 'LineWidth',1.2, 'Color',[0,0,0], 'HandleVisibility','off')
plot(tAx, [-0.25, 0.25] + k, [med, med], 'LineWidth',1.2, 'Color',obj.CData(k,:), 'HandleVisibility','off')
fill(tAx, k + 0.25 .* [-1, 1, 1, -1], [qt25, qt25, qt75, qt75], obj.CData(k,:), ...
'FaceAlpha',0.3, 'EdgeColor',obj.CData(k,:), 'LineWidth',1.2);
tAx.XLim = [0, obj.GroupNum + 1];
tAx.XTick = [];
case {'violin', 7}
tjDataY = tYk; fullDataY = tjDataY;
[f, yi] = ksdensity(tjDataY);
f(yi > max(tjDataY)) = []; yi(yi > max(tjDataY)) = [];
f(yi < min(tjDataY)) = []; yi(yi < min(tjDataY)) = [];
fill(tAx, [f, -f(end:-1:1)].*ylen./25 + k, [yi, yi(end:-1:1)], obj.CData(k,:), ...
'FaceAlpha',0.3, 'EdgeColor',obj.CData(k,:), 'LineWidth',1.2);
outliBool = isoutlier(tjDataY, 'quartiles');
outli = tjDataY(outliBool);
scatter(tAx, repmat(k, [sum(outliBool), 1]), outli, 45, 'filled', ...
'CData',obj.CData(k,:), 'LineWidth',1.2, 'MarkerFaceAlpha',0.8, 'HandleVisibility','off')
tjDataY(outliBool) = [];
qt25 = quantile(fullDataY, 0.25);
qt75 = quantile(fullDataY, 0.75);
med = median(fullDataY);
plot(tAx, [k, k], [max(tjDataY), qt75], 'LineWidth',1.2, 'Color',[0,0,0], 'HandleVisibility','off')
plot(tAx, [k, k], [min(tjDataY), qt25], 'LineWidth',1.2, 'Color',[0,0,0], 'HandleVisibility','off')
fill(tAx, k + 0.15 .* [-1, 1, 1, -1], [qt25, qt25, qt75, qt75], [1,1,1], ...
'FaceAlpha',0.95, 'EdgeColor',obj.CData(k,:), 'LineWidth',1.2, 'HandleVisibility','off');
plot(tAx, [-0.15, 0.15] + k, [med, med], 'LineWidth',1.2, 'Color',obj.CData(k,:), 'HandleVisibility','off')
tAx.XLim = [0, obj.GroupNum + 1];
tAx.XTick = [];
case {'rug', 8}
LY = [tYk, tYk, tYk.*nan]';
LX = repmat([k - .3, k + .3, nan], [length(tYk), 1])';
line(tAx, LX(:), LY(:), 'Color',[obj.CData(k,:), .4], 'lineWidth',1)
tAx.XLim = [0, obj.GroupNum + 1];
tAx.XTick = [];
case {'joyplot', 'ridgeline', 9}
[f,yi] = ksdensity(tYk);
fill(tAx, [f, 0].*ylen./25 + (k - 1).*.5, [yi, yi(1)], obj.CData(k,:),...
'FaceAlpha',0.3, 'EdgeColor','none');
plot(tAx,f.*ylen./25 + (k - 1).*.5, yi, 'Color',obj.CData(k,:), 'LineWidth',1.2)
tAx.XTick = [];
tAx.YLim = [min(tY), max(tY)];
case {'half-violin', 10}
tjDataY = tYk; fullDataY = tjDataY;
[f, yi] = ksdensity(tjDataY);
f(yi > max(tjDataY)) = []; yi(yi > max(tjDataY)) = [];
f(yi < min(tjDataY)) = []; yi(yi < min(tjDataY)) = [];
fill(tAx, [0, f, 0].*ylen./25 + k + 0.15, [yi(1), yi, yi(end)], obj.CData(k,:), ...
'FaceAlpha',0.3, 'EdgeColor',obj.CData(k,:), 'LineWidth',1.2);
outliBool = isoutlier(tjDataY, 'quartiles');
outli = tjDataY(outliBool);
scatter(tAx, repmat(k - 0.2, [sum(outliBool), 1]), outli, 45, 'filled', ...
'CData',obj.CData(k,:), 'LineWidth',1.2, 'MarkerFaceAlpha',0.8, 'HandleVisibility','off')
tjDataY(outliBool) = [];
qt25 = quantile(fullDataY, 0.25);
qt75 = quantile(fullDataY, 0.75);
med = median(fullDataY);
plot(tAx, [k, k] - 0.2, [max(tjDataY), qt75], 'LineWidth',1.2, 'Color',[0,0,0], 'HandleVisibility','off')
plot(tAx, [k, k] - 0.2, [min(tjDataY), qt25], 'LineWidth',1.2, 'Color',[0,0,0], 'HandleVisibility','off')
fill(tAx, k - 0.2 + 0.15 .* [-1, 1, 1, -1], [qt25, qt25, qt75, qt75], [1,1,1], ...
'FaceAlpha',0.95, 'EdgeColor',obj.CData(k,:), 'LineWidth',1.2, 'HandleVisibility','off');
plot(tAx, [-0.15, 0.15] + k - 0.2, [med, med], 'LineWidth',1.2, 'Color',obj.CData(k,:), 'HandleVisibility','off')
tAx.XLim = [0, obj.GroupNum + 1];
tAx.XTick = [];
case {'raincloud', 11}
tjDataY = tYk; fullDataY = tjDataY;
[f, yi] = ksdensity(tjDataY);
f(yi > max(tjDataY)) = []; yi(yi > max(tjDataY)) = [];
f(yi < min(tjDataY)) = []; yi(yi < min(tjDataY)) = [];
fill(tAx, [0, f, 0].*ylen./25 + k + 0.15, [yi(1), yi, yi(end)], obj.CData(k,:), ...
'FaceAlpha',0.3, 'EdgeColor',obj.CData(k,:), 'LineWidth',1.2);
scatter(tAx, tYk .* 0 + k - 0.2 + 0.12 .* (rand(length(tYk), 1) - 0.5), tYk, ...
45, 'filled', 'CData',obj.CData(k,:), 'LineWidth',1.2, 'MarkerFaceAlpha',0.3)
outliBool = isoutlier(tjDataY, 'quartiles');
tjDataY(outliBool) = [];
qt25 = quantile(fullDataY, 0.25);
qt75 = quantile(fullDataY, 0.75);
med = median(fullDataY);
plot(tAx, [k, k] - 0.2, [max(tjDataY), qt75], 'LineWidth',1.2, 'Color',[0,0,0])
plot(tAx, [k, k] - 0.2, [min(tjDataY), qt25], 'LineWidth',1.2, 'Color',[0,0,0])
fill(tAx, k - 0.2 + 0.15 .* [-1, 1, 1, -1], [qt25, qt25, qt75, qt75], [1,1,1], ...
'FaceAlpha',0.95, 'EdgeColor',obj.CData(k,:), 'LineWidth',1.2);
plot(tAx, [-0.15, 0.15] + k - 0.2, [med, med], 'LineWidth',1.2, 'Color',obj.CData(k,:))
tAx.XLim = [0, obj.GroupNum + 1];
tAx.XTick = [];
case {'cdf-hist', 12}
histogram(tAx, tYk, linspace(min(tY), max(tY), 20), 'FaceColor',obj.CData(k,:), 'Normalization', 'cdf', 'Orientation','horizontal');
case {'cdf-line', 13}
[f, yi] = ecdf(tXk);
plot(tAx, f, yi,'Color', obj.CData(k,:),'LineWidth',1.5);
case {'ridge-hist',14}
tobj = histogram(tAx, tYk, linspace(min(tY), max(tY), 20));
binEdges = tobj.BinEdges;
counts = tobj.Values;
delete(tobj);
for i = 1:length(counts)
y = [binEdges(i), binEdges(i), binEdges(i+1), binEdges(i+1)];
x = [0, counts(i), counts(i), 0]./max(counts);
fill(tAx, x + k - 1, y, [0.2, 0.4, 0.8], 'FaceAlpha',0.6, ...
'LineWidth',.8, 'FaceColor',obj.CData(k,:),'EdgeColor',[1 1 1]*.1);
plot(tAx, [k - 1, k - 1], ([min(tY), max(tY)] - mean(tY)).*2 + mean(tY), 'LineWidth',1, 'Color','k')
end
tAx.XLim = [0, k];
tAx.YLim = [min(tY), max(tY)];
end
elseif ((m == n && isempty(obj.Y)) || (m == obj.R && obj.R ~= obj.M)) && ...
((n < obj.C && obj.C ~= obj.N) || (n <= obj.C && obj.C == obj.N))
if m == obj.R && obj.R ~= obj.M
tType = obj.BottomType;
else
tType = obj.DiagType; YLimUpdate(m, n) = false;
end
switch tType
case {'none', 0}
XLimUpdate(m, n) = false;
YLimUpdate(m, n) = false;
set(tAx, 'XColor','none','YColor','none')
case {'hist', 1}
histogram(tAx, tXk, linspace(min(tX), max(tX), 20), 'FaceColor',obj.CData(k,:),...
'EdgeColor',[1 1 1]*.1, 'FaceAlpha',0.6, 'LineWidth',.8)
tAx.XLim = [min(tX), max(tX)];
case {'kd-area', 2}
[f,xi] = ksdensity(tXk);
fill(tAx, [xi, xi(1)], [f, 0], obj.CData(k,:),...
'FaceAlpha',0.3, 'EdgeColor','none')
tAx.XLim = [min(tX), max(tX)];
case {'kd-line', 3}
[f, xi] = ksdensity(tXk);
plot(tAx, xi, f, 'Color',obj.CData(k,:), 'LineWidth',2)
tAx.XLim = [min(tX), max(tX)];
case {'kd-both', 4}
[f, xi] = ksdensity(tXk);
fill(tAx, [xi, xi(1)], [f, 0], obj.CData(k,:),...
'FaceAlpha',0.3, 'EdgeColor','none')
plot(tAx, xi, f, 'Color',obj.CData(k,:), 'LineWidth',2, 'HandleVisibility','off')
tAx.XLim = [min(tX), max(tX)];
case {'kd-hist', 5}
HHdl = histogram(tAx, tXk, linspace(min(tX), max(tX), 20), 'FaceColor',obj.CData(k,:),...
'EdgeColor',[1 1 1]*.1, 'FaceAlpha',0.6, 'LineWidth',.8);
[f, xi] = ksdensity(tXk);
plot(tAx, xi, f.*size(tXk, 1).*HHdl.BinWidth, 'Color',obj.CData(k,:), 'LineWidth',2, 'HandleVisibility','off')
tAx.XLim = [min(tX), max(tX)];
case {'box', 6}
tjDataX = tXk; fullDataX = tjDataX;
outliBool = isoutlier(tjDataX, 'quartiles');
outli = tjDataX(outliBool);
scatter(tAx, outli, repmat(obj.GroupNum + 1 - k, [sum(outliBool), 1]), 45, 'filled', ...
'CData',obj.CData(k,:), 'LineWidth',1.2, 'MarkerFaceAlpha',0.8, 'HandleVisibility','off')
tjDataX(outliBool) = [];
qt25 = quantile(fullDataX, 0.25);
qt75 = quantile(fullDataX, 0.75);
med = median(fullDataX);
plot(tAx, [max(tjDataX), qt75], obj.GroupNum + 1 - [k, k], 'LineWidth',1.2, 'Color',[0,0,0], 'HandleVisibility','off')
plot(tAx, [min(tjDataX), qt25], obj.GroupNum + 1 - [k, k], 'LineWidth',1.2, 'Color',[0,0,0], 'HandleVisibility','off')
plot(tAx, [max(tjDataX), max(tjDataX)], [-0.15, 0.15] + obj.GroupNum + 1 - k, 'LineWidth',1.2, 'Color',[0,0,0], 'HandleVisibility','off')
plot(tAx, [min(tjDataX), min(tjDataX)], [-0.15, 0.15] + obj.GroupNum + 1 - k, 'LineWidth',1.2, 'Color',[0,0,0], 'HandleVisibility','off')
plot(tAx, [med, med], [-0.25, 0.25] + obj.GroupNum + 1 - k, 'LineWidth',1.2, 'Color',obj.CData(k,:), 'HandleVisibility','off')
fill(tAx, [qt25, qt25, qt75, qt75], obj.GroupNum + 1 - k + 0.25 .* [-1, 1, 1, -1], obj.CData(k,:), ...
'FaceAlpha',0.3, 'EdgeColor',obj.CData(k,:), 'LineWidth',1.2);
tAx.YLim = [0, obj.GroupNum + 1];
tAx.YTick = [];
case {'violin', 7}
tjDataX = tXk; fullDataX = tjDataX;
[f, xi] = ksdensity(tjDataX);
f(xi > max(tjDataX)) = []; xi(xi > max(tjDataX)) = [];
f(xi < min(tjDataX)) = []; xi(xi < min(tjDataX)) = [];
fill(tAx, [xi, xi(end:-1:1)], [f, -f(end:-1:1)].*xlen./25 + obj.GroupNum + 1 - k, obj.CData(k,:), ...
'FaceAlpha',0.3, 'EdgeColor',obj.CData(k,:), 'LineWidth',1.2);
outliBool = isoutlier(tjDataX, 'quartiles');
outli = tjDataX(outliBool);
scatter(tAx, outli, repmat(obj.GroupNum + 1 - k, [sum(outliBool), 1]), 45, 'filled', ...
'CData',obj.CData(k,:), 'LineWidth',1.2, 'MarkerFaceAlpha',0.8, 'HandleVisibility','off')
tjDataX(outliBool) = [];
qt25 = quantile(fullDataX, 0.25);
qt75 = quantile(fullDataX, 0.75);
med = median(fullDataX);
plot(tAx, [max(tjDataX), qt75], obj.GroupNum + 1 - [k, k], 'LineWidth',1.2, 'Color',[0,0,0], 'HandleVisibility','off')
plot(tAx, [min(tjDataX), qt25], obj.GroupNum + 1 - [k, k], 'LineWidth',1.2, 'Color',[0,0,0], 'HandleVisibility','off')
fill(tAx, [qt25, qt25, qt75, qt75], obj.GroupNum + 1 - k + 0.15 .* [-1, 1, 1, -1], [1,1,1], ...
'FaceAlpha',0.95, 'EdgeColor',obj.CData(k,:), 'LineWidth',1.2, 'HandleVisibility','off');
plot(tAx, [med, med], [-0.15, 0.15] + obj.GroupNum + 1 - k, 'LineWidth',1.2, 'Color',obj.CData(k,:), 'HandleVisibility','off')
tAx.YLim = [0, obj.GroupNum + 1];
tAx.YTick = [];
case {'rug', 8}
LX = [tXk, tXk, tXk.*nan]';
LY = repmat([obj.GroupNum + 1 - k - .3, obj.GroupNum + 1 - k + .3, nan], [length(tXk), 1])';
line(tAx, LX(:), LY(:), 'Color',[obj.CData(k,:), .4], 'lineWidth',1)
tAx.YLim = [0, obj.GroupNum + 1];
tAx.YTick = [];
case {'joyplot', 'ridgeline', 9}
[f,xi]=ksdensity(tXk);
fill(tAx, [xi, xi(1)], [f, 0].*xlen./25 + (obj.GroupNum + 1 - k - 1).*.5,obj.CData(k,:),...
'FaceAlpha',0.3, 'EdgeColor','none');
plot(tAx, xi, f.*xlen./25 + (obj.GroupNum + 1 - k - 1).*.5, 'Color',obj.CData(k,:), 'LineWidth',1.2)
tAx.YTick = [];
tAx.XLim = [min(tX), max(tX)];
case {'half-violin', 10}
tjDataX = tXk; fullDataX = tjDataX;
[f, xi] = ksdensity(tjDataX);
f(xi > max(tjDataX)) = []; xi(xi > max(tjDataX)) = [];
f(xi < min(tjDataX)) = []; xi(xi < min(tjDataX)) = [];
fill(tAx, [xi(1), xi, xi(end)], [0, f, 0].*xlen./25 +obj.GroupNum + 1 - k + 0.15, obj.CData(k,:), ...
'FaceAlpha',0.3, 'EdgeColor',obj.CData(k,:), 'LineWidth',1.2);
outliBool = isoutlier(tjDataX, 'quartiles');
outli = tjDataX(outliBool);
scatter(tAx, outli, repmat(obj.GroupNum + 1 - k - 0.2, [sum(outliBool), 1]), 45, 'filled', ...
'CData',obj.CData(k,:), 'LineWidth',1.2, 'MarkerFaceAlpha',0.8, 'HandleVisibility','off')
tjDataX(outliBool) = [];
qt25 = quantile(fullDataX, 0.25);
qt75 = quantile(fullDataX, 0.75);
med = median(fullDataX);
plot(tAx, [max(tjDataX), qt75], obj.GroupNum + 1 - [k, k] - 0.2, 'LineWidth',1.2, 'Color',[0,0,0], 'HandleVisibility','off')
plot(tAx, [min(tjDataX), qt25], obj.GroupNum + 1 - [k, k] - 0.2, 'LineWidth',1.2, 'Color',[0,0,0], 'HandleVisibility','off')
fill(tAx, [qt25, qt25, qt75, qt75], obj.GroupNum + 1 - k - 0.2 + 0.15 .* [-1, 1, 1, -1], [1,1,1], ...
'FaceAlpha',0.95, 'EdgeColor',obj.CData(k,:), 'LineWidth',1.2, 'HandleVisibility','off');
plot(tAx, [med, med], [-0.15, 0.15] + obj.GroupNum + 1 - k - 0.2, 'LineWidth',1.2, 'Color',obj.CData(k,:), 'HandleVisibility','off')
tAx.YLim = [0, obj.GroupNum + 1];
tAx.YTick = [];
case {'raincloud', 11}
tjDataX = tXk; fullDataX = tjDataX;
[f, xi] = ksdensity(tjDataX);
f(xi > max(tjDataX)) = []; xi(xi > max(tjDataX)) = [];
f(xi < min(tjDataX)) = []; xi(xi < min(tjDataX)) = [];
fill(tAx, [xi(1), xi, xi(end)], [0, f, 0].*xlen./25 + obj.GroupNum + 1 - k + 0.15, obj.CData(k,:), ...
'FaceAlpha',0.3, 'EdgeColor',obj.CData(k,:), 'LineWidth',1.2);
scatter(tAx, tXk, tXk .* 0 + obj.GroupNum + 1 - k - 0.2 + 0.12 .* (rand(length(tXk), 1) - 0.5), ...
45, 'filled', 'CData',obj.CData(k,:), 'LineWidth',1.2, 'MarkerFaceAlpha',0.3)
outliBool = isoutlier(tjDataX, 'quartiles');
tjDataX(outliBool) = [];
qt25 = quantile(fullDataX, 0.25);
qt75 = quantile(fullDataX, 0.75);
med = median(fullDataX);
plot(tAx, [max(tjDataX), qt75], obj.GroupNum + 1 - [k, k] - 0.2, 'LineWidth',1.2, 'Color',[0,0,0])
plot(tAx, [min(tjDataX), qt25], obj.GroupNum + 1 - [k, k] - 0.2, 'LineWidth',1.2, 'Color',[0,0,0])
fill(tAx, [qt25, qt25, qt75, qt75], obj.GroupNum + 1 - k - 0.2 + 0.15 .* [-1, 1, 1, -1], [1,1,1], ...
'FaceAlpha',0.95, 'EdgeColor',obj.CData(k,:), 'LineWidth',1.2);
plot(tAx, [med, med], [-0.15, 0.15] + obj.GroupNum + 1 - k - 0.2, 'LineWidth',1.2, 'Color',obj.CData(k,:))
tAx.YLim = [0, obj.GroupNum + 1];
tAx.YTick = [];
case {'cdf-hist', 12}
histogram(tAx, tXk, linspace(min(tX), max(tX), 20), 'FaceColor',obj.CData(k,:), 'Normalization', 'cdf');
case {'cdf-line', 13}
[f, xi] = ecdf(tXk);
plot(tAx, xi, f,'Color', obj.CData(k,:),'LineWidth',1.5);
case {'ridge-hist',14}
tobj = histogram(tAx, tXk, linspace(min(tX), max(tX), 20));
binEdges = tobj.BinEdges;
counts = tobj.Values;
delete(tobj);
for i = 1:length(counts)
x = [binEdges(i), binEdges(i), binEdges(i+1), binEdges(i+1)];
y = [0, counts(i), counts(i), 0]./max(counts);
fill(tAx, x, y - k, [0.2, 0.4, 0.8], 'FaceAlpha',0.6, ...
'LineWidth',.8, 'FaceColor',obj.CData(k,:),'EdgeColor',[1 1 1]*.1);
plot(tAx, ([min(tX), max(tX)] - mean(tX)).*2 + mean(tX), [-k, -k], 'LineWidth',1, 'Color','k')
end
tAx.YLim = [-k, 0];
tAx.XLim = [min(tX), max(tX)];
end
else
if (~isempty(obj.Y)) || m > n
tType = obj.LowerType;
else
tType = obj.UpperType;
end
switch tType
case {'none', 0}
XLimUpdate(m, n) = false;
YLimUpdate(m, n) = false;
set(tAx, 'XColor','none','YColor','none')
case {'scatter', 1}
scatter(tAx, tXk, tYk, 50, 'filled', ...
'CData',obj.CData(k,:), 'MarkerFaceAlpha',.6);
case {'contour', 2}
tNum = min(max(50, round(sqrt(obj.S)))*2, 200);
gridx1 = linspace(min(tXk), max(tXk), tNum); gridx1 = (gridx1 - mean(gridx1))*2 + mean(gridx1);
gridx2 = linspace(min(tYk), max(tYk), tNum); gridx2 = (gridx2 - mean(gridx2))*2 + mean(gridx2);
[x1, x2] = meshgrid(gridx1, gridx2); sz = size(x1);
xi = [x1(:), x2(:)]; h = ksdensity([tXk, tYk], xi);
contour(tAx, x1, x2, reshape(h, sz), 'LineWidth',1.2, 'EdgeColor',obj.CData(k,:));
tAx.XLim = [min(tX), max(tX)]; tAx.YLim = [min(tY), max(tY)];
case {'pred',3}
[p, tS] = polyfit(tXk, tYk, 1);
x_fit = linspace(min(tXk), max(tXk), 100);
[y_fit, delta] = polyval(p, x_fit, tS);
uy = y_fit + 2.*delta;
dy = y_fit - 2.*delta;
scatter(tAx, tXk, tYk, 30, 'filled', ...
'CData',obj.CData(k,:),'MarkerFaceAlpha',.6);
plot(tAx, x_fit, y_fit, 'Color',obj.CData(k,:), 'LineWidth',2.5)
fill(tAx, [x_fit, x_fit(end:-1:1)], [uy, dy(end:-1:1)], obj.CData(k,:), 'EdgeColor','none', 'FaceAlpha',.15)
case {'convhull', 4}
[ind, ~]=convhull([tXk, tYk]);
scatter(tAx, tXk, tYk, 30, 'filled', ...
'CData',obj.CData(k,:), 'MarkerFaceAlpha',.9);
fill(tAx, tXk(ind), tYk(ind), obj.CData(k,:), 'FaceAlpha',.3, 'EdgeColor',obj.CData(k,:), 'LineWidth',2)
case {'cover', 5}
scatter(tAx, tXk, tYk, 30, 'filled', ...
'CData',obj.CData(k,:), 'MarkerFaceAlpha',.9);
ratio = max(max(tXk) - min(tXk), max(tXk) - min(tXk))./round(sqrt(size(tXk, 1)));
tt = linspace(0,2*pi,100);
[ind,~] = convhull([tXk, tYk]);
kX = repmat(tXk(ind), [1, 100]) + repmat(cos(tt).*ratio, [length(ind), 1]);
kY = repmat(tYk(ind), [1, 100]) + repmat(sin(tt).*ratio, [length(ind), 1]);
kX = kX(:); kY = kY(:);
[ind, ~] = convhull([kX, kY]);
fill(tAx, kX(ind), kY(ind), obj.CData(k,:), 'FaceAlpha',0.3, 'EdgeColor',obj.CData(k,:), 'LineWidth',2)
case {'ellipse', 6}
scatter(tAx, tXk, tYk, 30, 'filled', ...
'CData',obj.CData(k,:), 'MarkerFaceAlpha',.9);
Mu = mean([tXk, tYk]);
YY = [tXk, tYk] - repmat(Mu, size(tXk,1), 1);
Sigma = cov(YY);% Sigma=(Y'*(ones(size(pntSet,1),1).*Y))./(size(pntSet,1)-1);
[XX, YY] = getEllipse(Mu, Sigma, 9.21, 100);
fill(tAx, XX, YY, obj.CData(k,:), 'FaceAlpha',0.3, 'EdgeColor',obj.CData(k,:), 'LineWidth',2)
case {'centroid', 7}
scatter(tAx, tXk, tYk, 30, 'filled', ...
'CData',obj.CData(k,:), 'MarkerFaceAlpha',.9);
Mu = mean([tXk, tYk]);
LX = [tXk, Mu(1).*ones(size(tXk, 1), 1), nan(size(tXk, 1), 1)].';
LY = [tYk, Mu(2).*ones(size(tYk, 1), 1), nan(size(tYk, 1), 1)].';
plot(tAx, LX(:), LY(:), 'Color',[obj.CData(k,:),.4], 'LineWidth',1.2);
case {'errorbar', 8}
Mu = mean([tXk, tYk]);
SX = std(tXk);
SY = std(tYk);
errorbar(tAx, Mu(1), Mu(2), SY, SY, SX, SX, 'o', 'LineWidth',1.5, 'Color',obj.CData(k,:), 'MarkerSize',10);
case {'conf',9}
mdl = fitlm(tXk, tYk);
x_fit = linspace(min(tXk), max(tXk), 100).';
[y_fit, ci] = predict(mdl, x_fit, 'Alpha',.05);
scatter(tAx, tXk, tYk, 30, 'filled', ...
'CData',obj.CData(k,:),'MarkerFaceAlpha',.6);
plot(tAx, x_fit, y_fit, 'Color',obj.CData(k,:), 'LineWidth',2.5)
fill(tAx, [x_fit; flipud(x_fit)], [ci(:,2); flipud(ci(:,1))], obj.CData(k,:), 'EdgeColor','none', 'FaceAlpha',.15);
case {'dot',10}
plot(tAx, tXk, tYk, ...
'Color',obj.CData(k,:), 'Marker','.', 'LineStyle','none', 'MarkerSize',9);
case {'corr', 11}
XLimUpdate(m, n) = false;
YLimUpdate(m, n) = false;
tAx.XLim = [-1, 1];
tAx.YLim = [-obj.GroupNum - .5, .5];
tAx.XTick = [];
tAx.YTick = [];
if obj.GroupNum == 1
[rho, pval] = corr(tX, tY);
marker = obj.pval2stars(pval, obj.pvalLevels);
text(tAx, 0, 0, ['Corr:',num2str(rho), marker], 'FontSize',13, ...
'FontName','Times New Roman', 'Color','k','HorizontalAlignment','center')
else
[rho, pval] = corr(tXk, tYk);
marker = obj.pval2stars(pval, obj.pvalLevels);
text(tAx, 0, -k, [obj.GroupLabel{k},':',num2str(rho), marker], 'FontSize',13, ...
'FontName','Times New Roman', 'Color',obj.CData(k,:),'HorizontalAlignment','center')
if k == obj.GroupNum
[rho, pval] = corr(tX, tY);
marker = obj.pval2stars(pval, obj.pvalLevels);
text(tAx, 0, 0, ['Corr:',num2str(rho), marker], 'FontSize',13, ...
'FontName','Times New Roman', 'Color','k','HorizontalAlignment','center')
end
end
case {'heatmap', 12}
XLimUpdate(m, n) = false;
YLimUpdate(m, n) = false;
tAx.XLim = [-1, 1];
tAx.YLim = [-obj.GroupNum - .5, .5];
tAx.XTick = [];
tAx.YTick = [];
if obj.GroupNum == 1
[rho, pval] = corr(tX, tY);
marker = obj.pval2stars(pval, obj.pvalLevels);
text(tAx, 0, 0, ['Corr:',num2str(rho), marker], 'FontSize',13, ...
'FontName','Times New Roman', 'Color','k','HorizontalAlignment','center')
else
[rho, pval] = corr(tXk, tYk);
marker = obj.pval2stars(pval, obj.pvalLevels);
color = obj.val2Color(rho, obj.corrCLim, obj.corrColormap);
fill(tAx, [-1,1,1,-1], [-1,-1,1,1]./2-k, color, 'EdgeColor','k','LineWidth',1)
text(tAx, 0, -k, [obj.GroupLabel{k},':',num2str(rho), marker], 'FontSize',13, ...
'FontName','Times New Roman', 'Color', [1,1,1].*(mean(color) < .5),'HorizontalAlignment','center')
if k == obj.GroupNum
[rho, pval] = corr(tX, tY);
marker = obj.pval2stars(pval, obj.pvalLevels);
color = obj.val2Color(rho, obj.corrCLim, obj.corrColormap);
fill(tAx, [-1,1,1,-1], [-1,-1,1,1]./2, color, 'EdgeColor','k','LineWidth',1)
text(tAx, 0, 0, ['Corr:',num2str(rho), marker], 'FontSize',13, ...
'FontName','Times New Roman', 'Color', [1,1,1].*(mean(color) < .5),'HorizontalAlignment','center')
end
end
case {'contourf', 13}
tNum = min(max(50, round(sqrt(obj.S)))*2, 200);
gridx1 = linspace(min(tXk), max(tXk), tNum); gridx1 = (gridx1 - mean(gridx1))*2 + mean(gridx1);
gridx2 = linspace(min(tYk), max(tYk), tNum); gridx2 = (gridx2 - mean(gridx2))*2 + mean(gridx2);
[x1, x2] = meshgrid(gridx1, gridx2); sz = size(x1);
xi = [x1(:), x2(:)]; h = ksdensity([tXk, tYk], xi);
contour(tAx, x1, x2, reshape(h, sz), 'LineWidth',1.2, 'EdgeColor',obj.CData(k,:), 'UserData',k);
tAx.XLim = [min(tX), max(tX)]; tAx.YLim = [min(tY), max(tY)];
tobj = findobj(tAx, 'UserData', k);
tZ = tobj.ZData; tLL = [min(min(tZ)), tobj.LevelList];
tZ = reshape(tLL(sum(tZ(:) >= tLL, 2)), size(tZ));
tZ = (tZ - min(min(tZ)))./(max(max(tZ)) - min(min(tZ)));
surf(tAx, tobj.XData, tobj.YData, tobj.XData.*0, 'FaceColor',obj.CData(k,:),...
'AlphaData',tZ,'EdgeColor','none','FaceAlpha','interp');
case {'cmp-contour', 14}
if k == obj.GroupNum
tNum = min(max(50, round(sqrt(obj.S)))*2, 200);
gridx1 = linspace(min(tX), max(tX), tNum); gridx1 = (gridx1 - mean(gridx1))*2 + mean(gridx1);
gridx2 = linspace(min(tY), max(tY), tNum); gridx2 = (gridx2 - mean(gridx2))*2 + mean(gridx2);
[x1, x2] = meshgrid(gridx1, gridx2); sz = size(x1);
xi = [x1(:), x2(:)]; h = ksdensity([tX, tY], xi);
contourf(tAx, x1, x2, reshape(h, sz), 'LineWidth',1.2, 'EdgeColor','k');
tAx.XLim = [min(tX), max(tX)]; tAx.YLim = [min(tY), max(tY)];
colormap(tAx, obj.Colormap)
end
case {'cmp-scatter', 15}
if k == obj.GroupNum
tNum = min(max(50, round(sqrt(obj.S)))*2, 200);
gridx1 = linspace(min(tX), max(tX), tNum); gridx1 = (gridx1 - mean(gridx1))*2 + mean(gridx1);
gridx2 = linspace(min(tY), max(tY), tNum); gridx2 = (gridx2 - mean(gridx2))*2 + mean(gridx2);
[x1, x2] = meshgrid(gridx1, gridx2); sz = size(x1);
xi = [x1(:), x2(:)]; h = ksdensity([tX, tY], xi); gridz = reshape(h, sz);
hh = interp2(x1, x2, gridz, tX, tY);
scatter(tAx, tX,tY, 'filled','CData',hh);
tAx.XLim = [min(tX), max(tX)]; tAx.YLim = [min(tY), max(tY)];
colormap(tAx, obj.Colormap)
end
end
end
end
tAx.XLabel.FontSize = 17;
tAx.YLabel.FontSize = 17;
end
end
for m = 1:obj.R
for n = 1:obj.C
if XLimUpdate(m, n)
XLimSet(n, 1) = min(XLimSet(n, 1), obj.axMat{m, n}.XLim(1));
XLimSet(n, 2) = max(XLimSet(n, 2), obj.axMat{m, n}.XLim(2));
end
if YLimUpdate(m, n)
YLimSet(m, 1) = min(YLimSet(m, 1), obj.axMat{m, n}.YLim(1));
YLimSet(m, 2) = max(YLimSet(m, 2), obj.axMat{m, n}.YLim(2));
end
end
end
for m = 1:obj.R
for n = 1:obj.C
if XLimUpdate(m, n)
obj.axMat{m, n}.XLim = XLimSet(n, :);
end
if YLimUpdate(m, n)
obj.axMat{m, n}.YLim = YLimSet(m, :);
end
end
end
function [X, Y] = getEllipse(Mu, Sigma, S, pntNum)
% 95%:5.991 | 99%:9.21 | 90%:4.605
% (X - Mu)*inv(Sigma)*(X - Mu) = S
invSig = inv(Sigma);
[V, D] = eig(invSig);
aa = sqrt(S/D(1));
bb = sqrt(S/D(4));
t = linspace(0, 2*pi, pntNum);
XY = V*[aa*cos(t); bb*sin(t)];
X = (XY(1,:) + Mu(1))';
Y = (XY(2,:) + Mu(2))';
end
end
function setAxes(obj, varargin)
for m = 1:obj.R
for n = 1:obj.C
set(obj.axMat{m, n}, varargin{:})
end
end
end
function setXLabel(obj, varargin)
for j = 1:obj.C
set(obj.axMat{obj.R, j}.XLabel, varargin{:});
end
end
function setYLabel(obj, varargin)
for i = 1:obj.R
set(obj.axMat{i, 1}.YLabel, varargin{:});
end
end
function setXLabelString(obj, strCell)
for j = 1:min(obj.C, length(strCell))
obj.axMat{obj.R, j}.XLabel.String = strCell{j};
end
end
function setYLabelString(obj, strCell)
for i = 1:min(obj.R, length(strCell))
obj.axMat{i, 1}.YLabel.String = strCell{i};
end
end
function stars = pval2stars(~, pval, levels)
% pval2stars - Convert p-values to significance stars
% stars = obj.pval2stars(pval) returns significance stars:
% p < 0.05 -> '*'
% p < 0.01 -> '**'
% p < 0.001 -> '***'
%
% stars = obj.pval2stars(pval, levels) custom significance thresholds
% levels = [0.05, 0.01, 0.001] (default)
%
% Examples:
% obj.pval2stars(0.03) % returns '*'
% obj.pval2stars(0.003) % returns '***'
if nargin < 2
levels = [0.05, 0.01, 0.001];
end
% Generate asterisk string based on significance level
stars = repmat('*', 1, sum(pval < levels));
end
function C = val2Color(~, val, clim, cmap)
% Create bin edges for quantizing data values to color
% (创建分箱边界,将数据值量化到颜色)
values = linspace(clim(1), clim(2), size(cmap, 1) + 1);
tind = sum(val >= values);
tind(tind <= 0) = 1;
tind(tind > size(cmap, 1)) = size(cmap, 1);
C = cmap(tind, :);
end
end
end