这期要复刻的是:
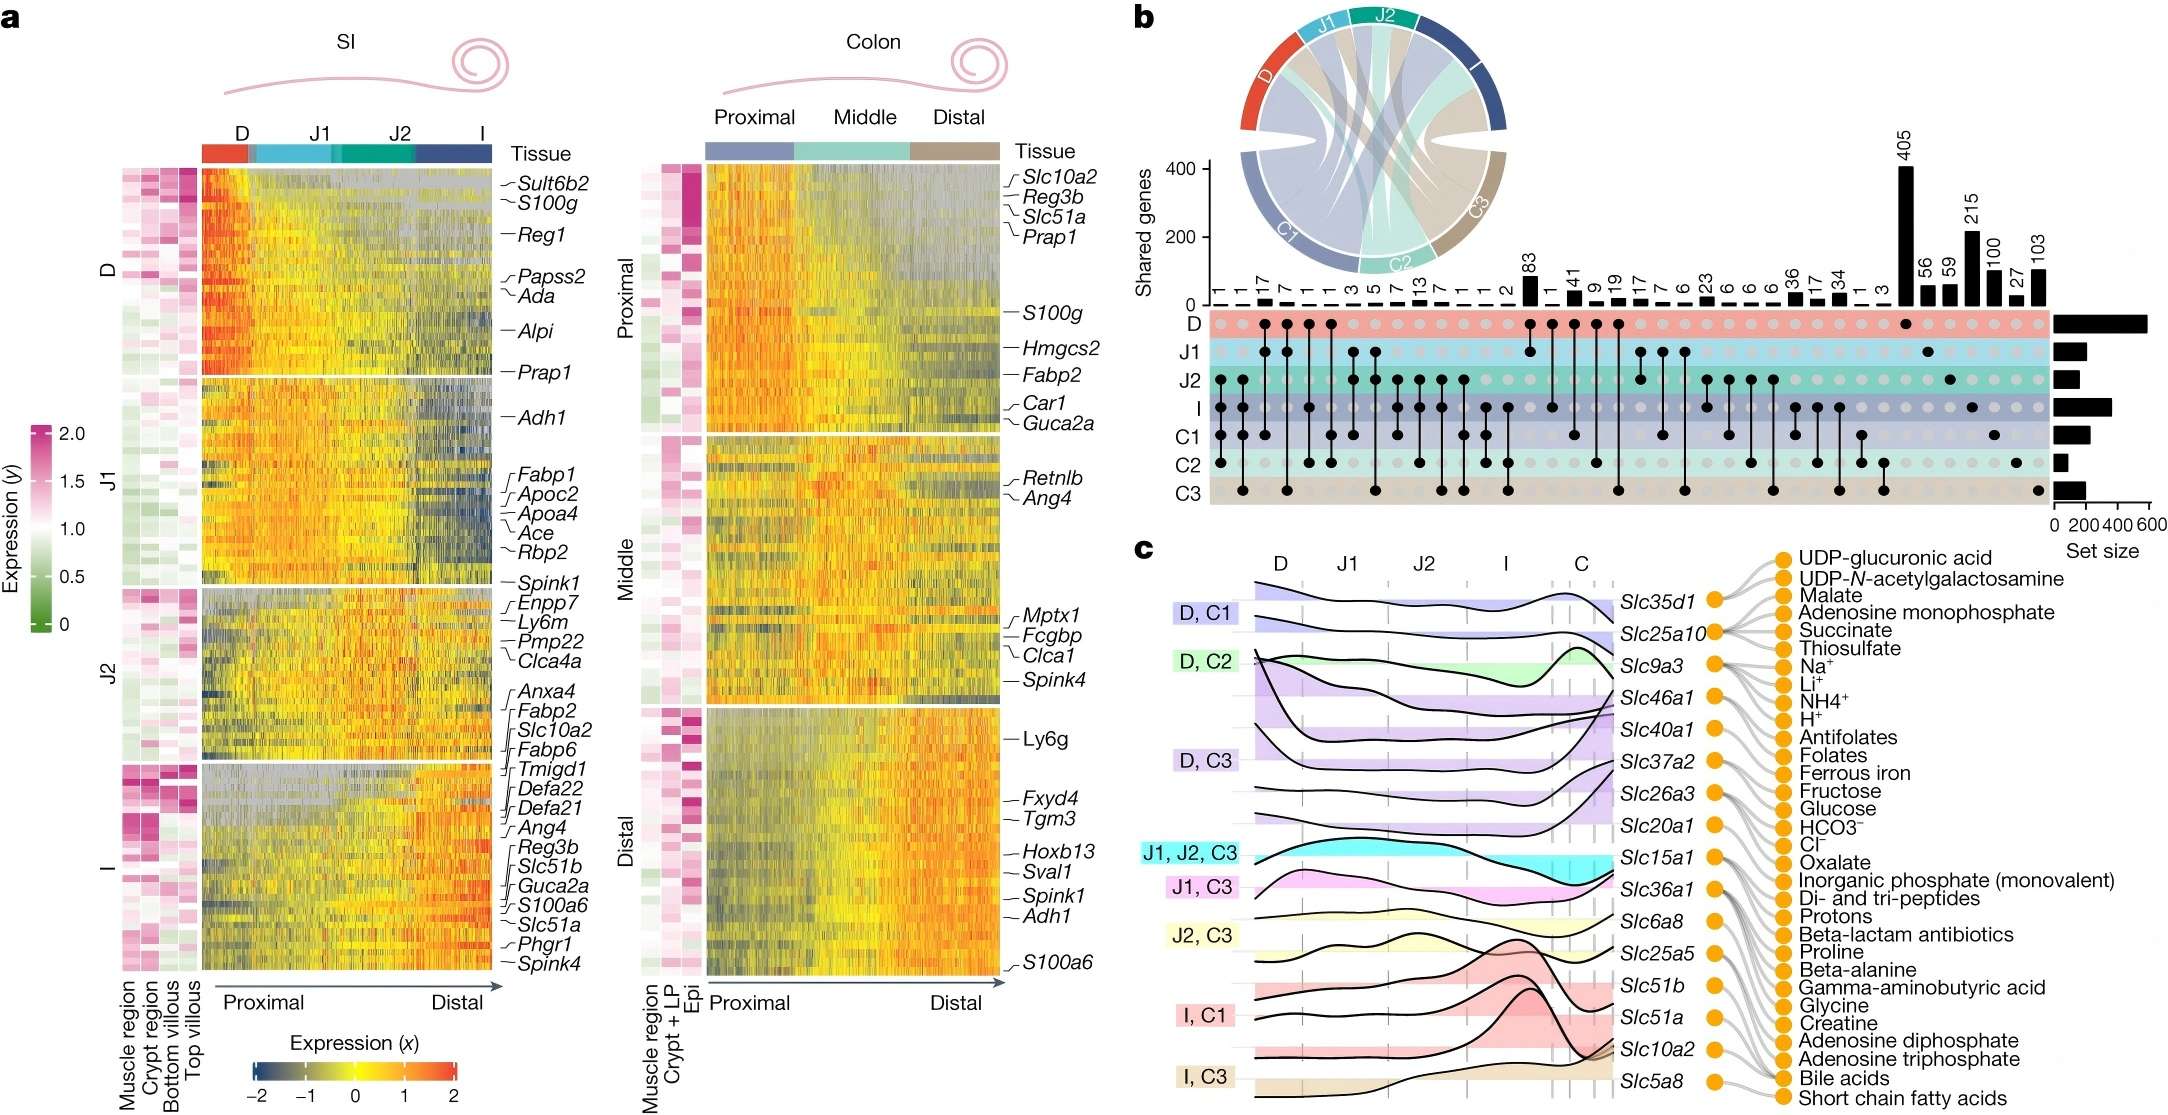
- Mayassi, T., Li, C., Segerstolpe, Å. et al. Spatially restricted immune and microbiota-driven adaptation of the gut. Nature 636, 447--456 (2024). https://doi.org/10.1038/s41586-024-08216-z
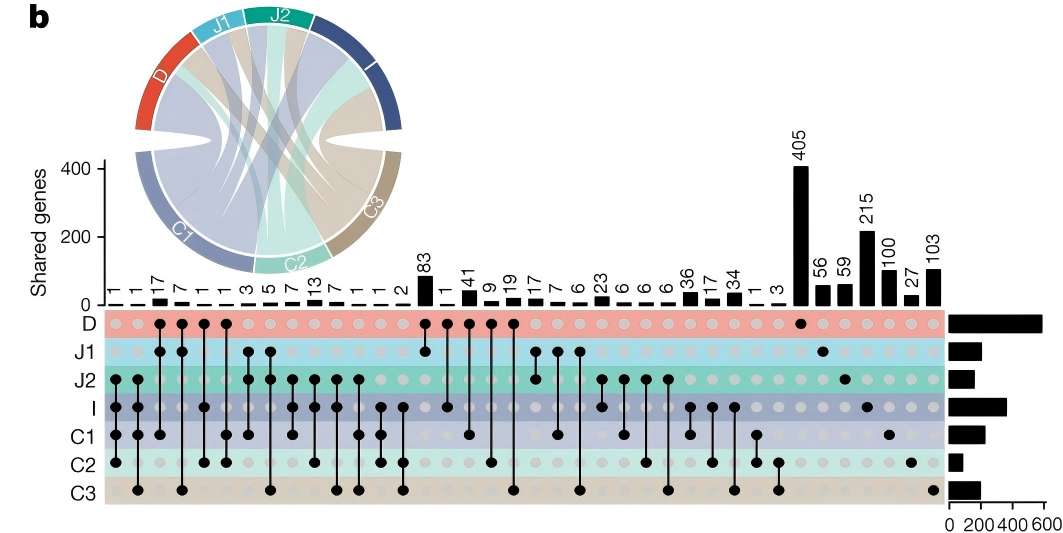
中的 Fig. 1b:
原图长这样:
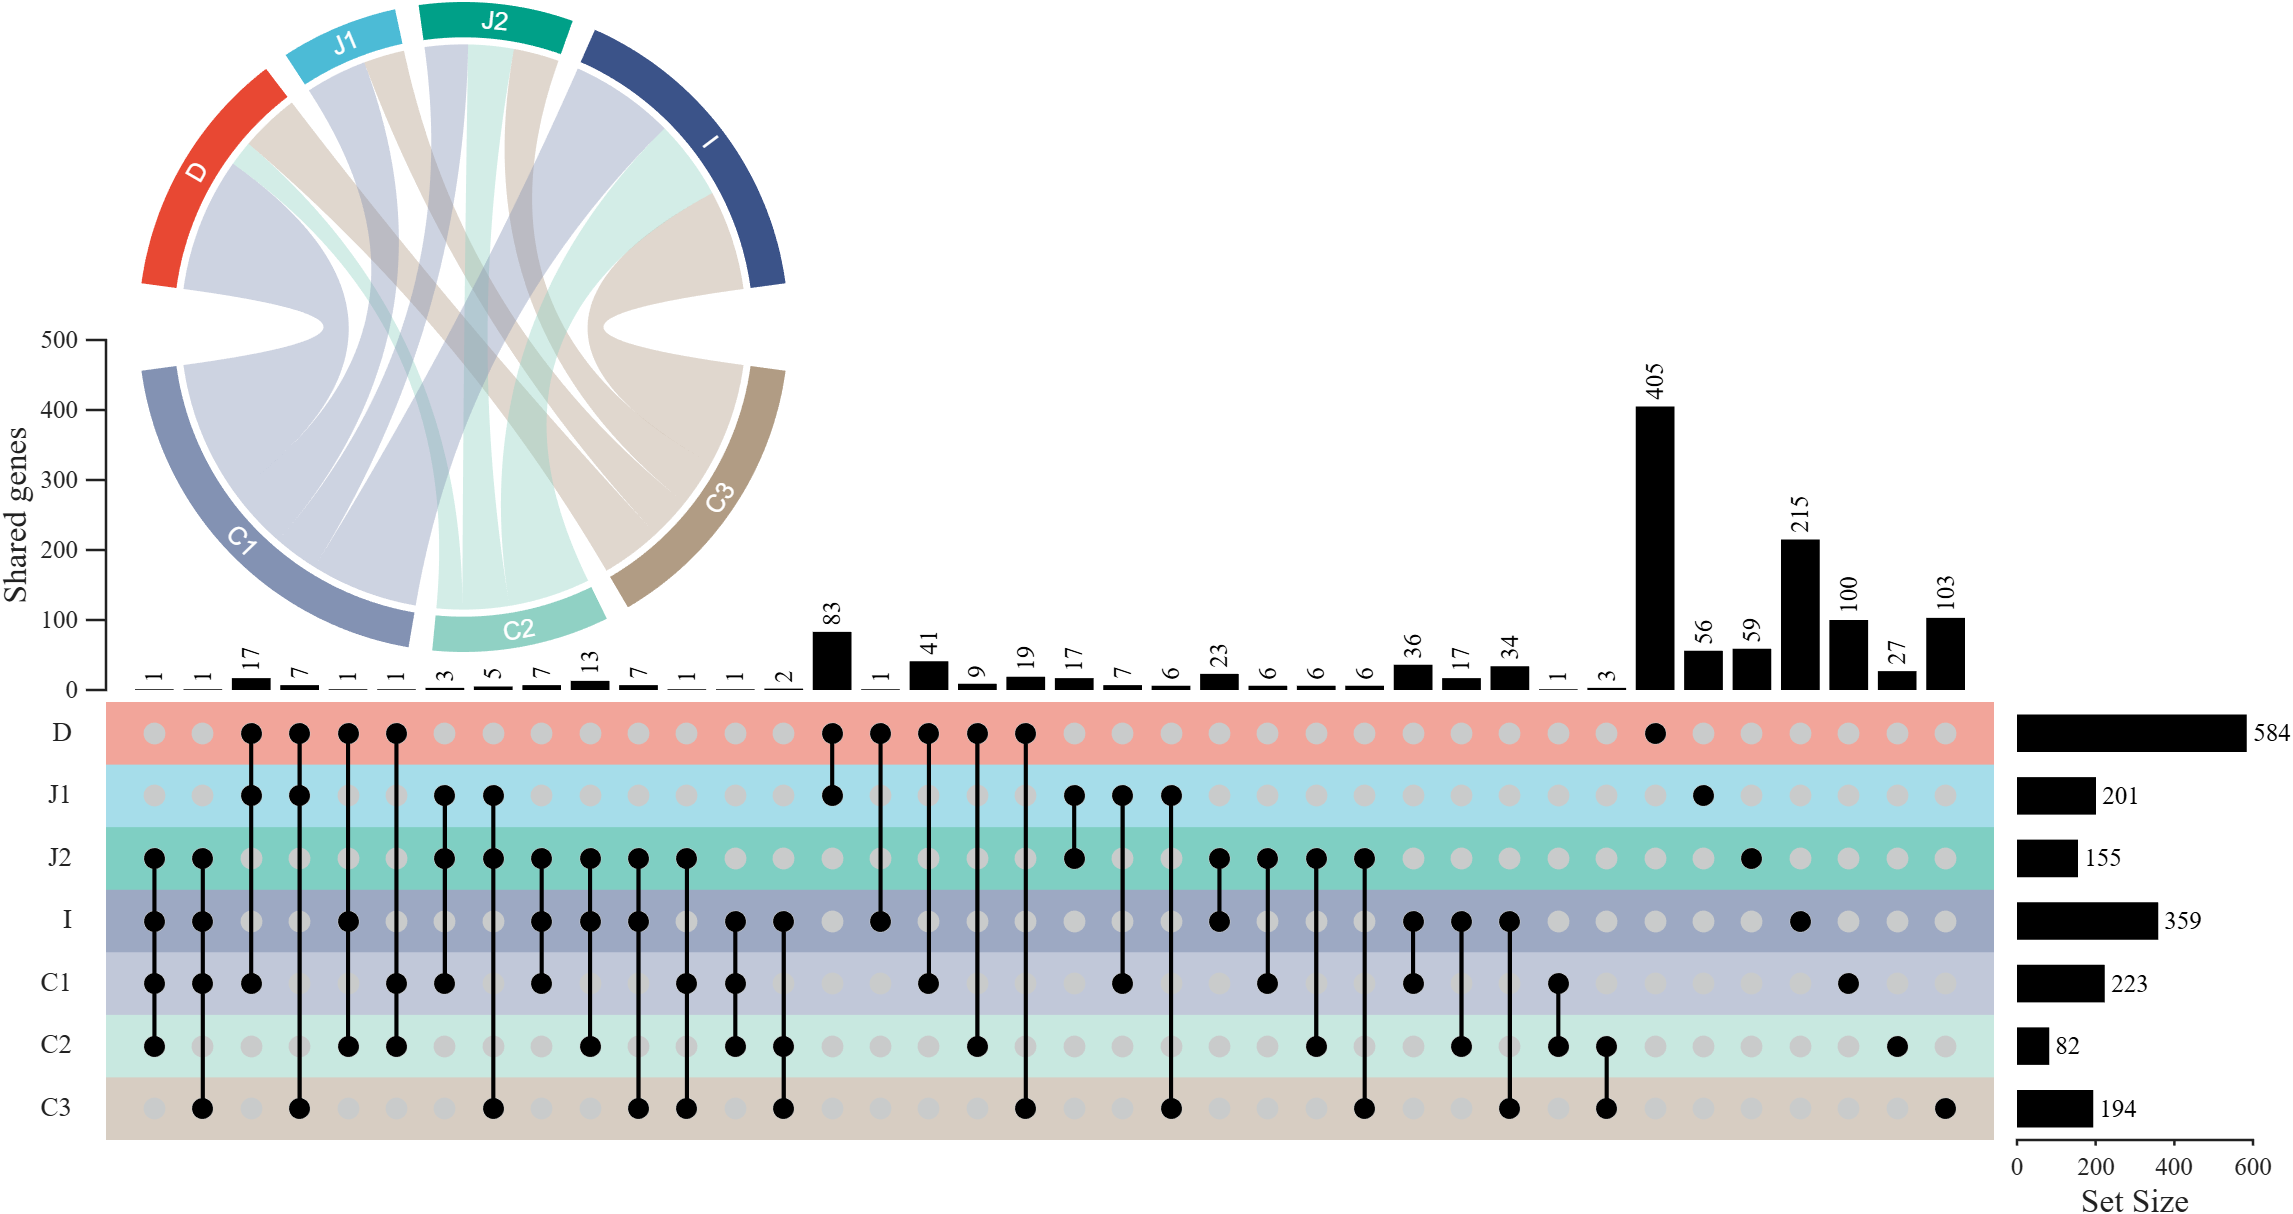
复刻结果:
前言
代码使用时需要下载我开发的 UpSet 图及弦图绘制工具,fileexchange 链接:
- Zhaoxu Liu / slandarer (2026). UpSet plot (https://www.mathworks.com/matlabcentral/fileexchange/123695-upset-plot), MATLAB Central File Exchange. Retrieved June 20, 2026.
- Zhaoxu Liu / slandarer (2026). chordChart (chord diagram | 弦图) (https://www.mathworks.com/matlabcentral/fileexchange/116550-chordchart-chord-diagram), MATLAB Central File Exchange. Retrieved June 20, 2026.
当然文末也会提供工具函数和绘图代码以及数据打包放在一起的 gitee 仓库,更加建议从那里下载。
下面我先说明一下 UpSet 图最近的版本更新,之后再展示如何复刻 Nature 绘图。
版本更新
3.0.0 版本的 UpSet 图主要做出了如下更新:
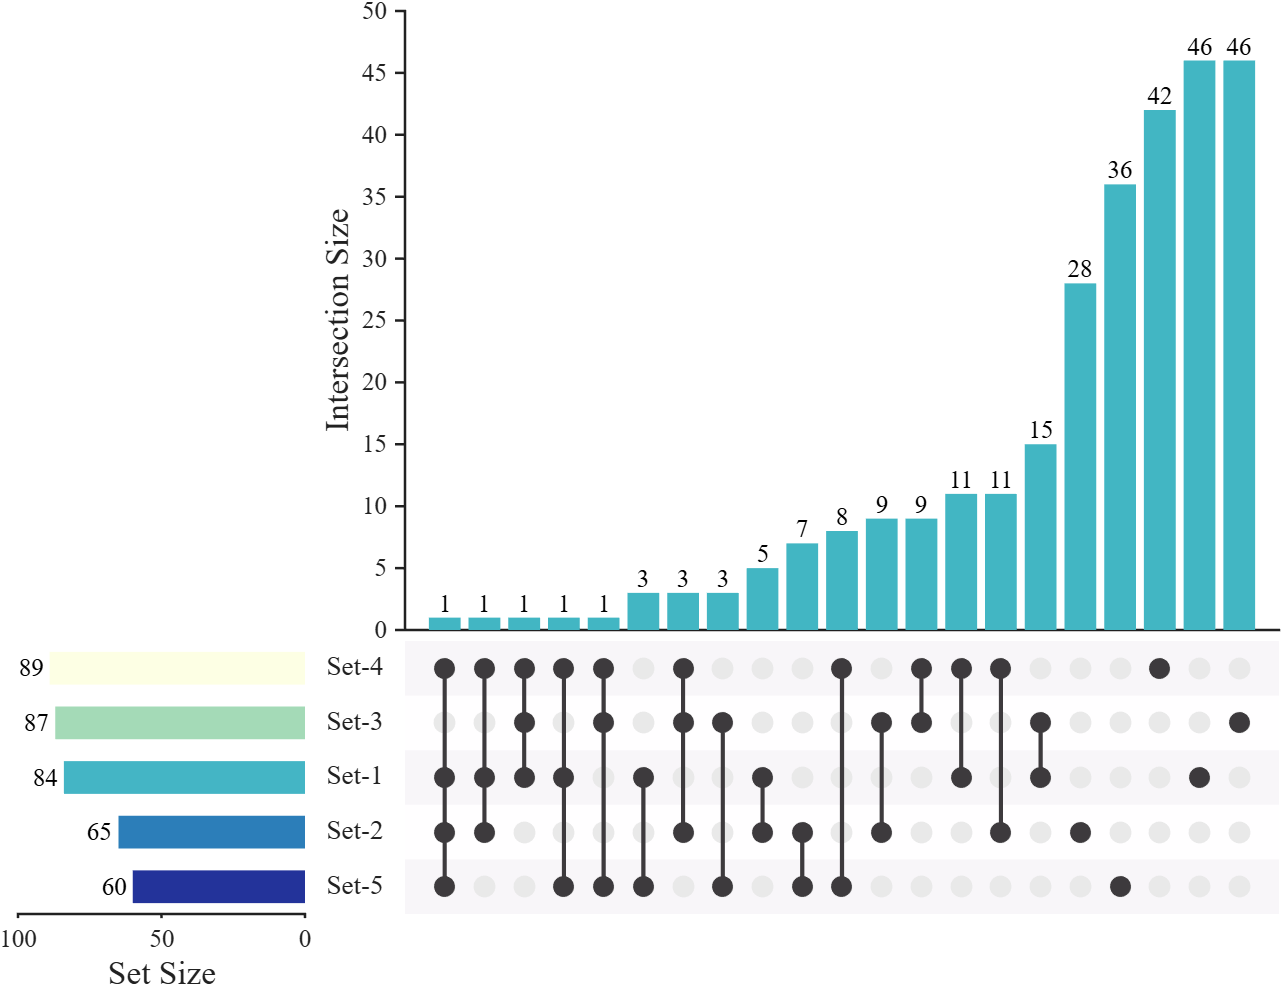
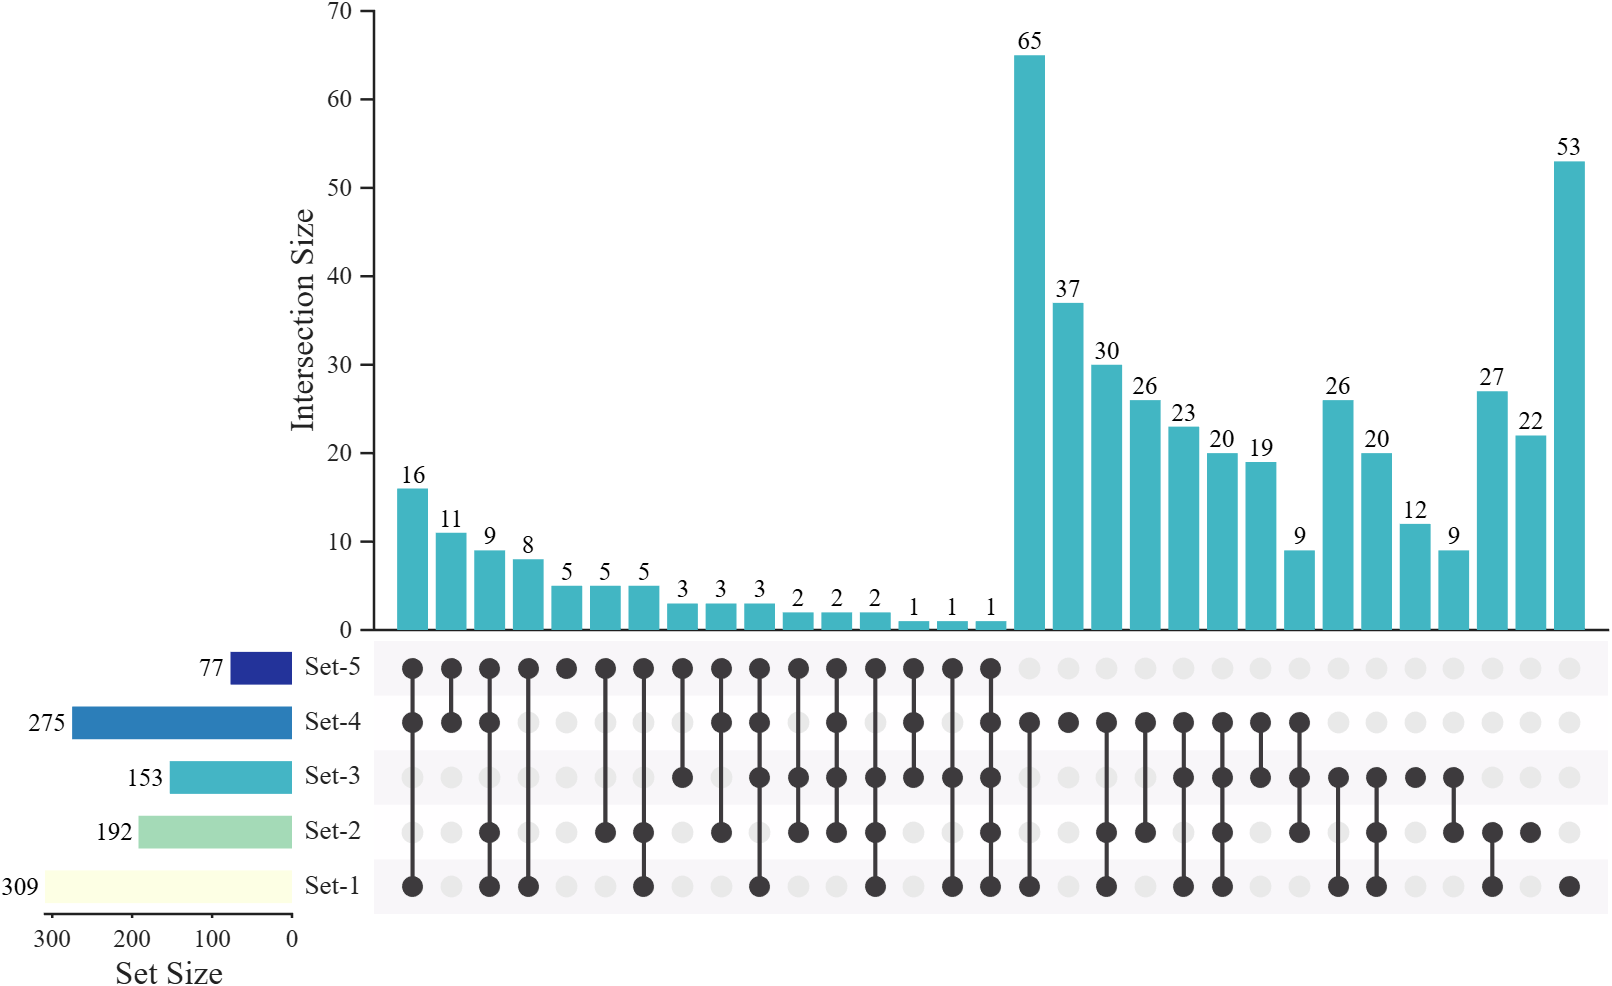
翻转 X-轴 和 Y-轴 方向
添加了 reverseXDir 和 reverseYDir 函数用于更方便的翻转绘图的 X-轴 和 Y-轴 方向:
matlab
setMat = rand([500, 5]) > 0.85;

USP = UpSetPlot(setMat);
USP.calc();
USP.draw(2^5);

USP.reverseXDir()
USP.reverseYDir()
翻转前后对比:
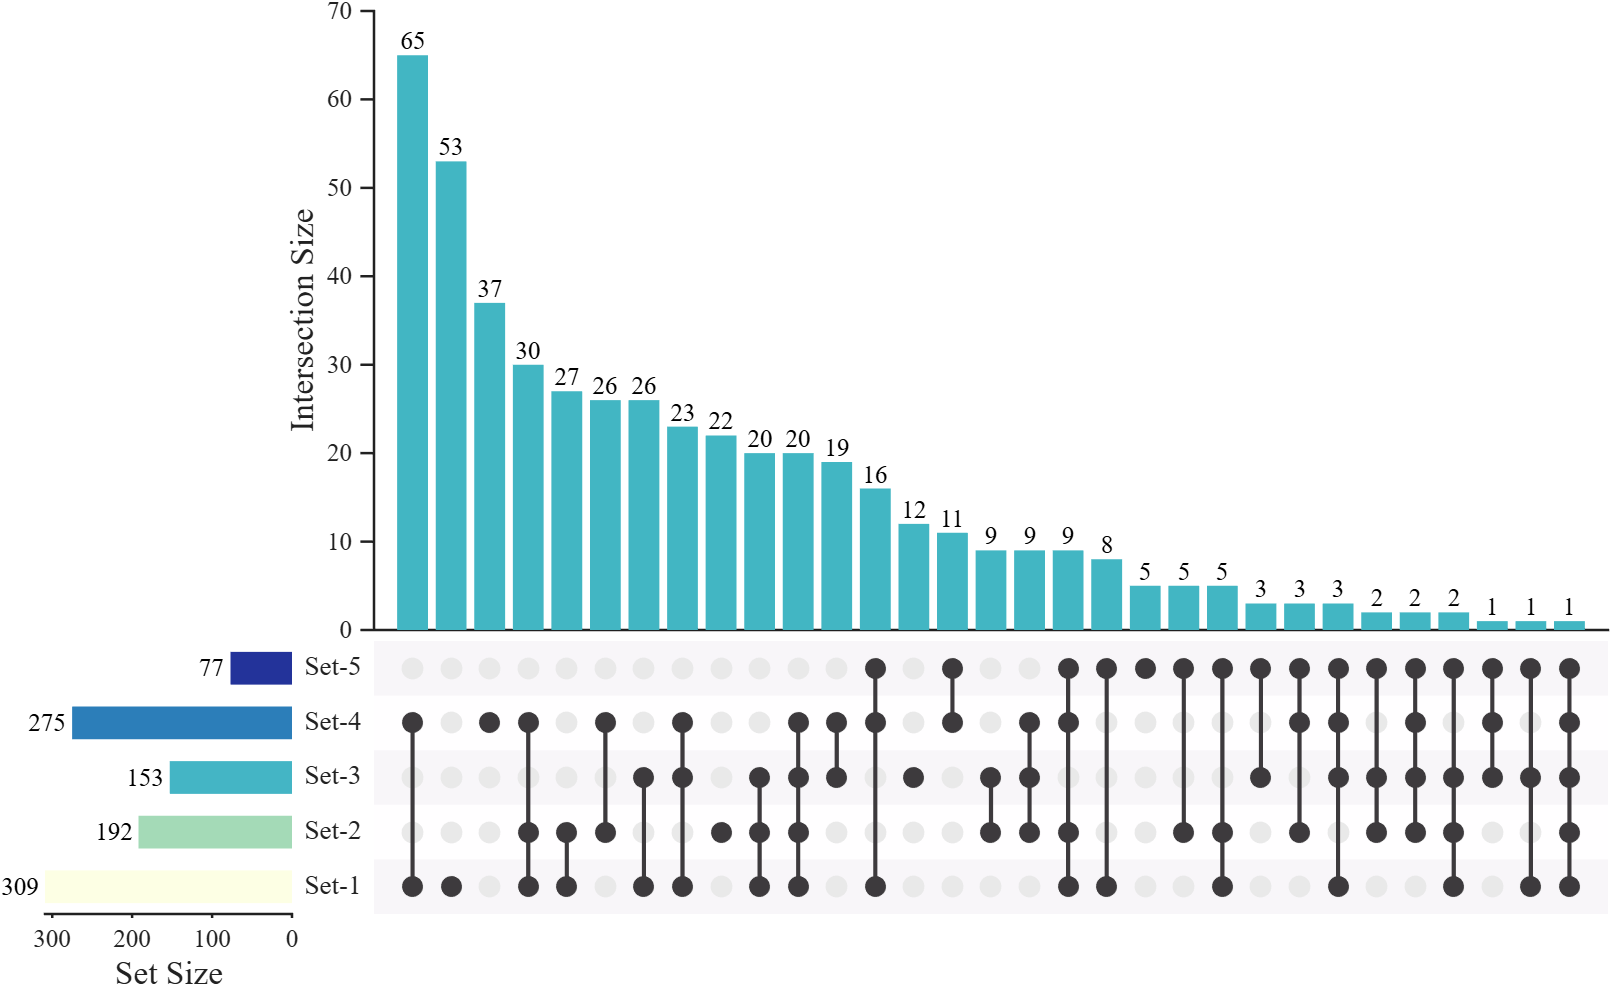
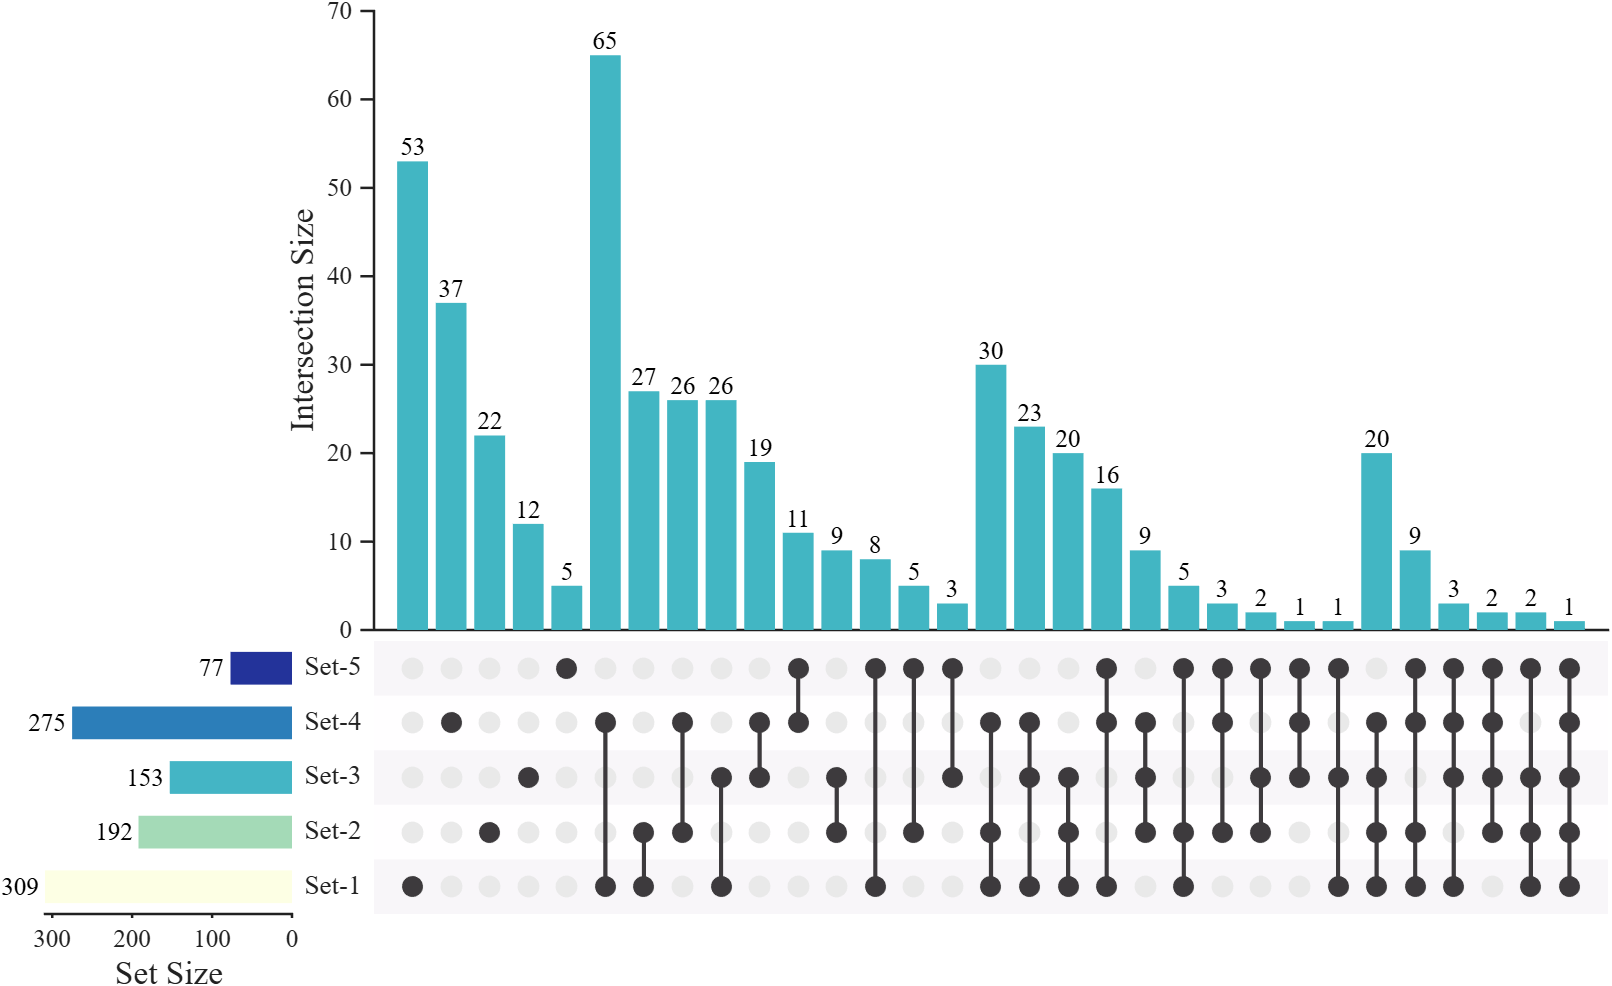
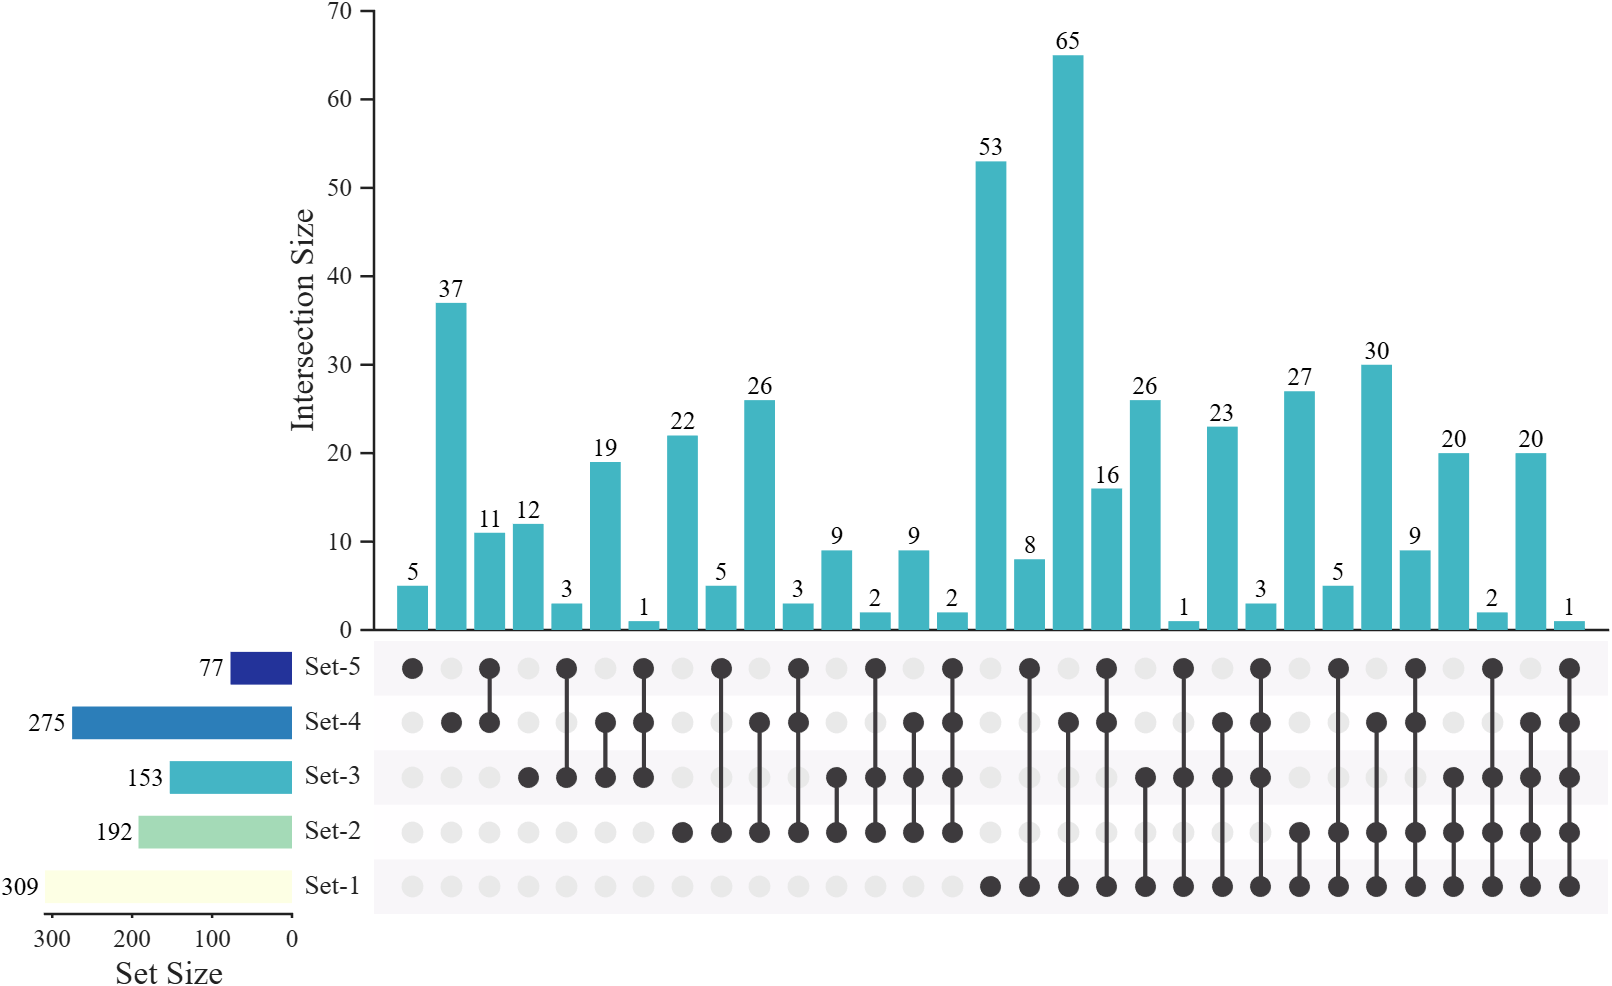
排序方法
有了更多的排序方法:
matlab
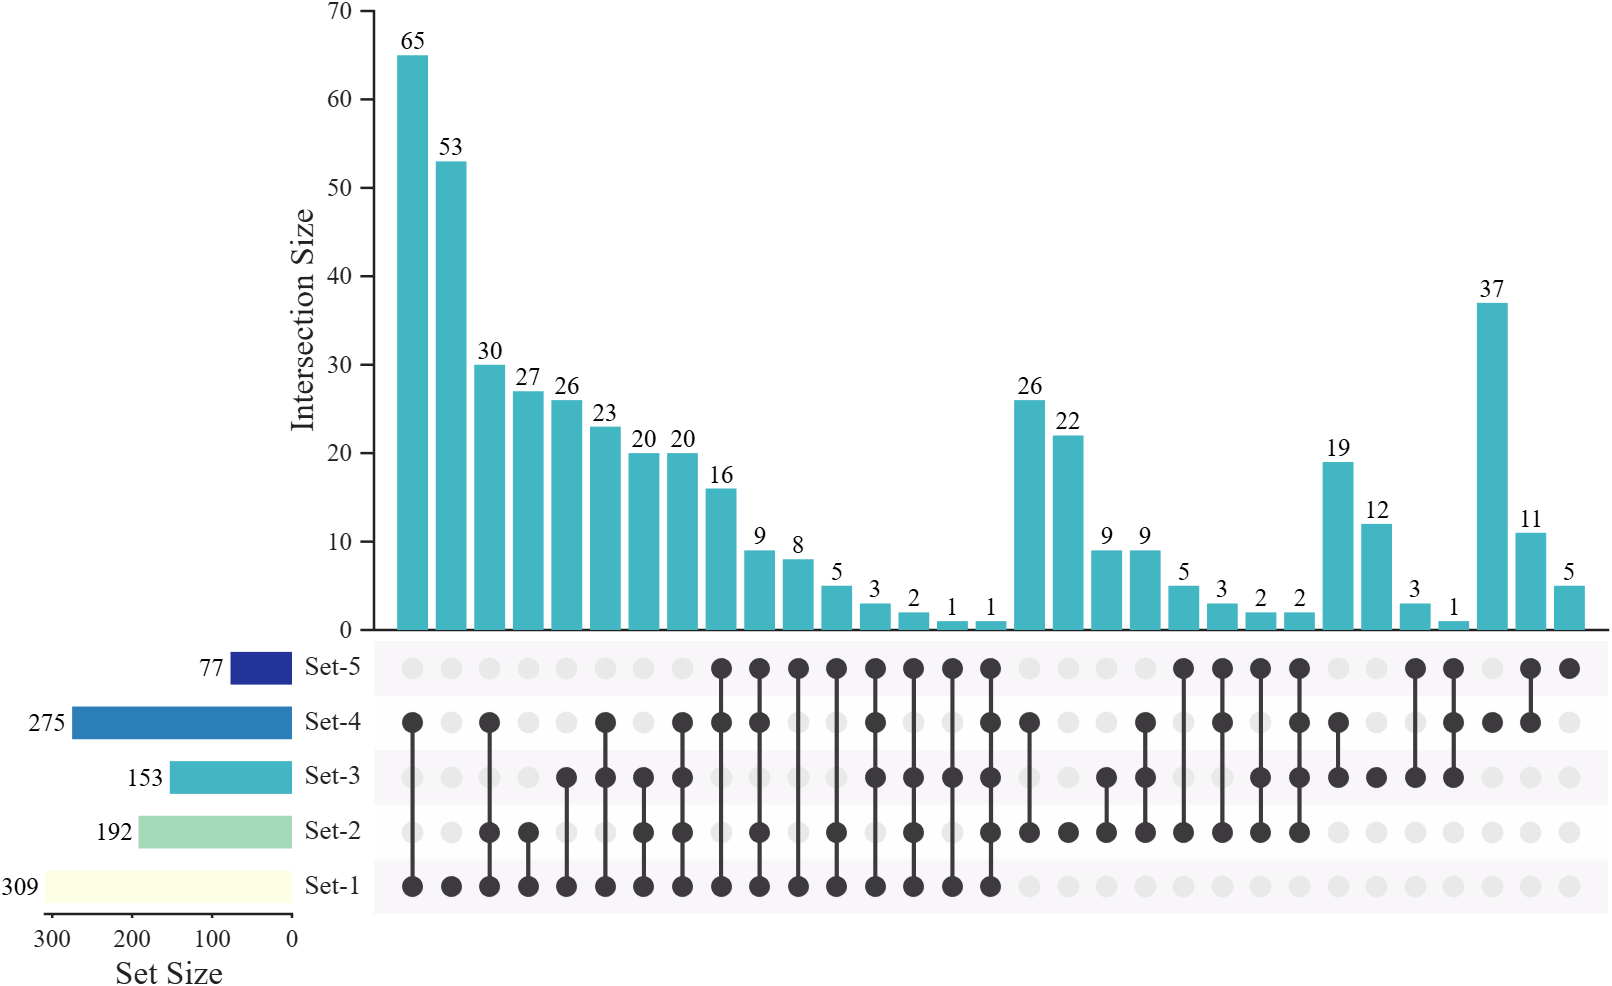
SortI = 'descend'
% 'descend' - Sort by sample count descending (按样本数降序)
% 'degree' - Sort by number of sets ascending, then by sample count descending
% (按集合个数升序,再按样本数降序)
% 'bit' - Sort by the integer value of the membership pattern (按位编码升序)
% Example: [0,0,1] -> 1, [0,1,0] -> 2, [0,1,1] -> 3
% 'revbit' - Sort by the integer value after reversing the bit pattern (翻转位编码后升序)
% Example: [0,0,1] -> reversed [1,0,0] -> 4,
% [0,1,0] -> reversed [0,1,0] -> 2
% 'degbit' - Sort by degree ascending, then by bit encoding ascending within same degree
% (先按degree升序,相同degree内按位编码升序)
% 'degrevbit' - Sort by degree ascending, then by reversed bit encoding ascending within same degree
% (先按degree升序,相同degree内按翻转位编码升序)
% 'pri' - Sort intersections by priority of set membership.
% Intersections containing the first priority set are sorted
% by size descending, followed by intersections containing
% the second priority set (but not the first), and so on.
% (按集合优先级排序:包含第一个优先集的交集按样本量降序排列,
% 然后是不含第一个但含第二个优先集的交集,依此类推)
% 'revpri' - Reverse of 'pri': intersections containing the last priority set
% are listed first, sorted by size descending, then those containing
% the second-to-last (but not the last), and so on.
% (与'pri'相反:包含最后一个优先集合的交集排在前面,按样本量降序排列,
% 然后是不含最后一个但含倒数第二个优先集合的交集,依此类推)
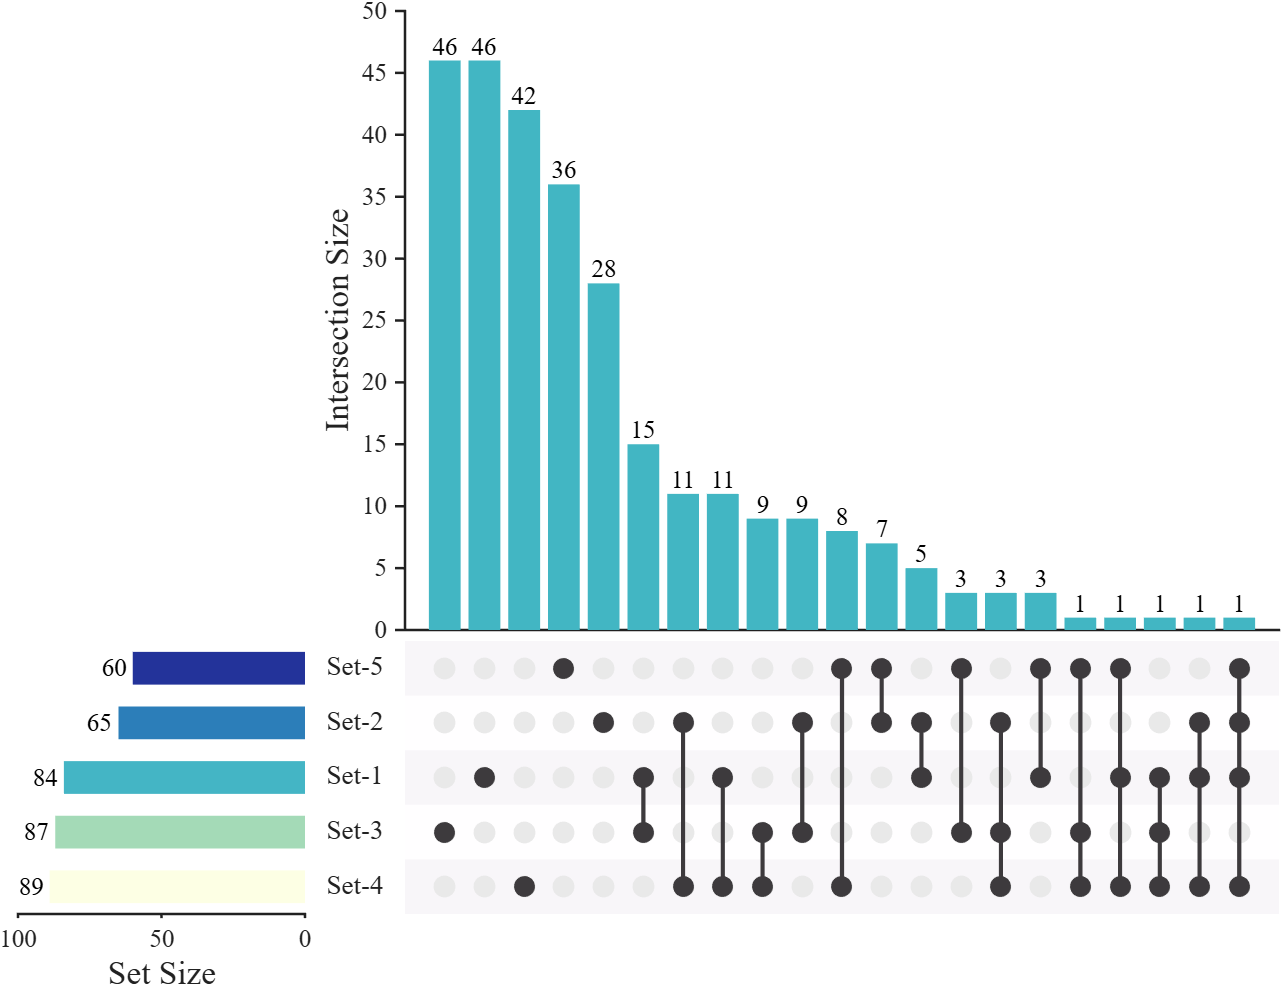
SortS = 'descend' % 'descend'/'none'展示一下各种排序方法:
matlab
setMat = rand([500, 5]) > [.4, .6, .7, .5, .8];

fig = figure('Units','normalized', 'Position',[.1, .2, .62, .63], 'Color','w');
USP = UpSetPlot(fig, setMat);
USP.WRatio = [5, 1, .2];
USP.SortS = 'none';
USP.SortI = 'degree';

USP.calc();
USP.draw(2^5);
descend (default)
degree
bit
revbit
degbit
degrevbit
pri
revpri
正文
Chord 图
matlab
% Read data (数据导入)
adjData = readtable('adjMat.csv');
adjMat = adjData{:, 2:end};
rowName = adjData.Var1;
colName = adjData.Properties.VariableNames(2:end);

% Create chord chart object and draw
CC = chordChart(adjMat, 'RowName',rowName, 'ColName',colName);
CC.SRadius = [1.025, 1.15];
CC.LRadius = 1.09;
CC.draw()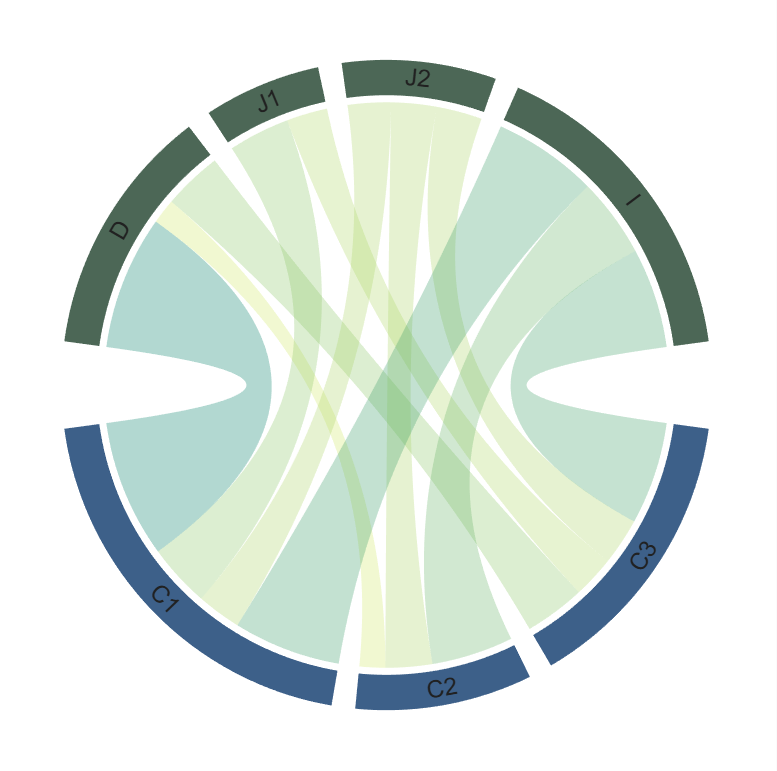
修饰一下:
matlab
% Set fonts, colors, and face alpha (设置字体、颜色、透明度)
CC.setFont('Color','w')
CC.setSquareColorF([177,156,132; 144,209,196; 131,146,179]./255)
CC.setSquareColorT([232,72,51;76,187,214;0,160,136;59,83,137]./255)
CC.setChordColorBySquareF()
CC.setChordProp('FaceAlpha', .4)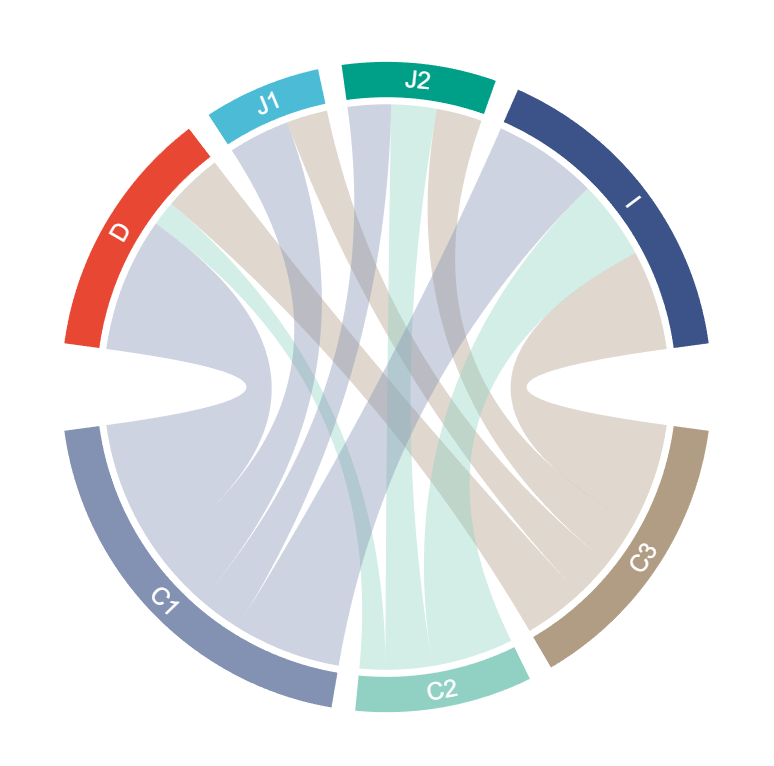
UpSet 图
基础绘图
matlab
% Read data (数据导入)
geneData = readtable('gene.csv');
setMat = geneData.Variables;
setName = geneData.Properties.VariableNames;

% Create figure and initialize UpSet plot object (创建图窗并初始化 UpSet 图对象)
fig = figure('Units','normalized', 'Position',[.05,.1,.88,.75], 'Color','w');
USP = UpSetPlot(fig, setMat, 'SetName', setName);

% Compute and draw the UpSet plot (计算并绘制UpSet图)
USP.calc();
USP.draw(2^7); 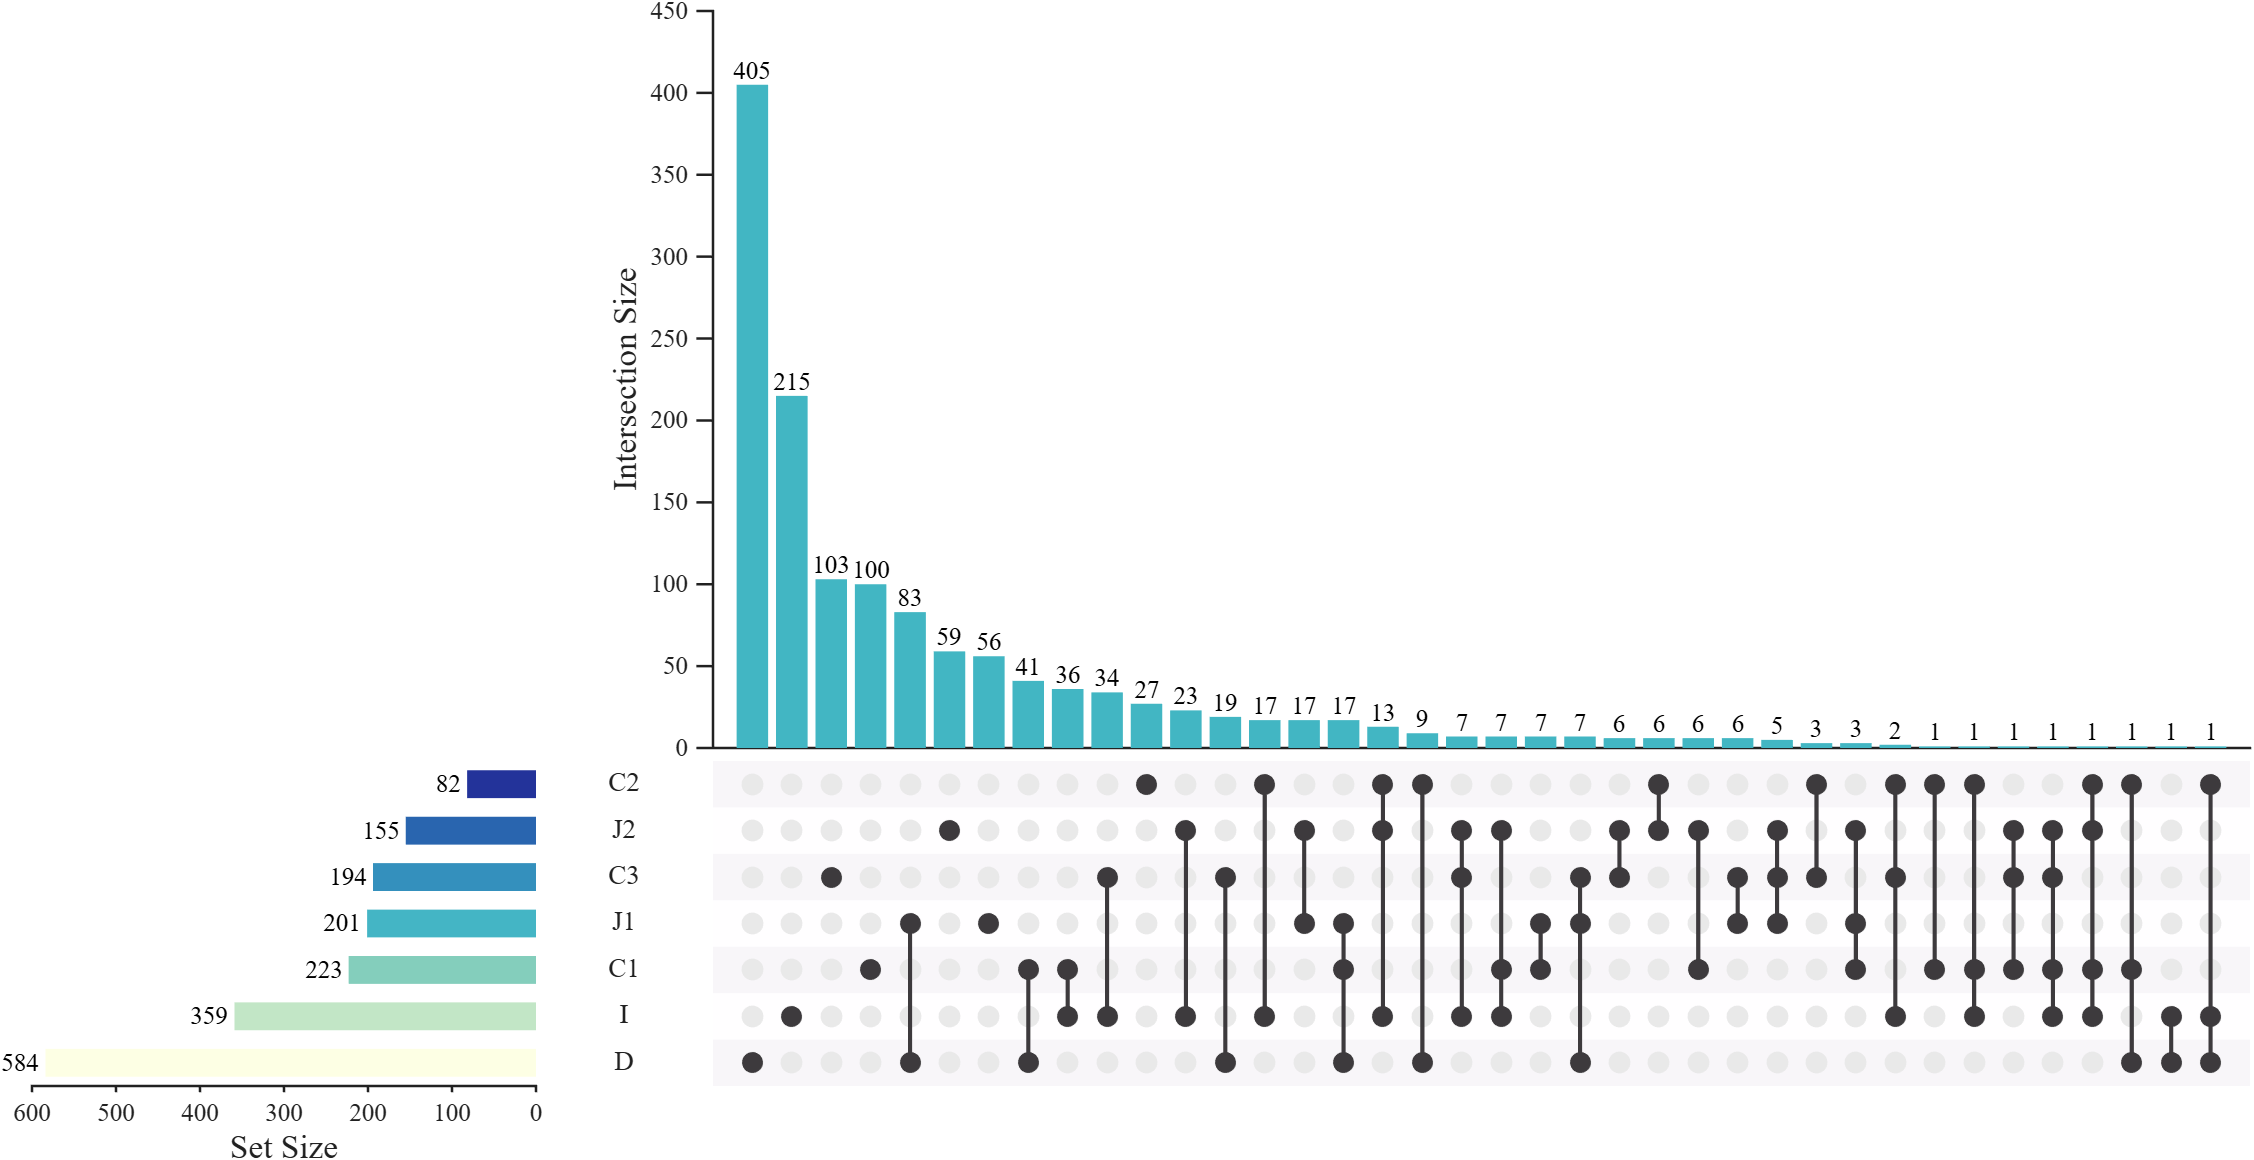
在 draw() 之前修改配色:
matlab
% Set basic colors (设置基本颜色)
USP.BarColorI = [0,0,0];                % Intersection bar color (交集条形颜色)
USP.BarColorS = [0,0,0];                % Set bar color (集合条形颜色)
USP.LineColor = [0,0,0];                % Connection line color (连接线颜色)
USP.BkgDotColor = [201,203,203]./255;   % Background dot color (背景点颜色)
USP.BkgPatchColor = [230,  75,  53;     % Patch background colors (填充背景色)
       77, 187, 213;   0, 160, 135;  60,  84, 136;
132, 145, 180; 145, 209, 194; 176, 156, 133]./255; 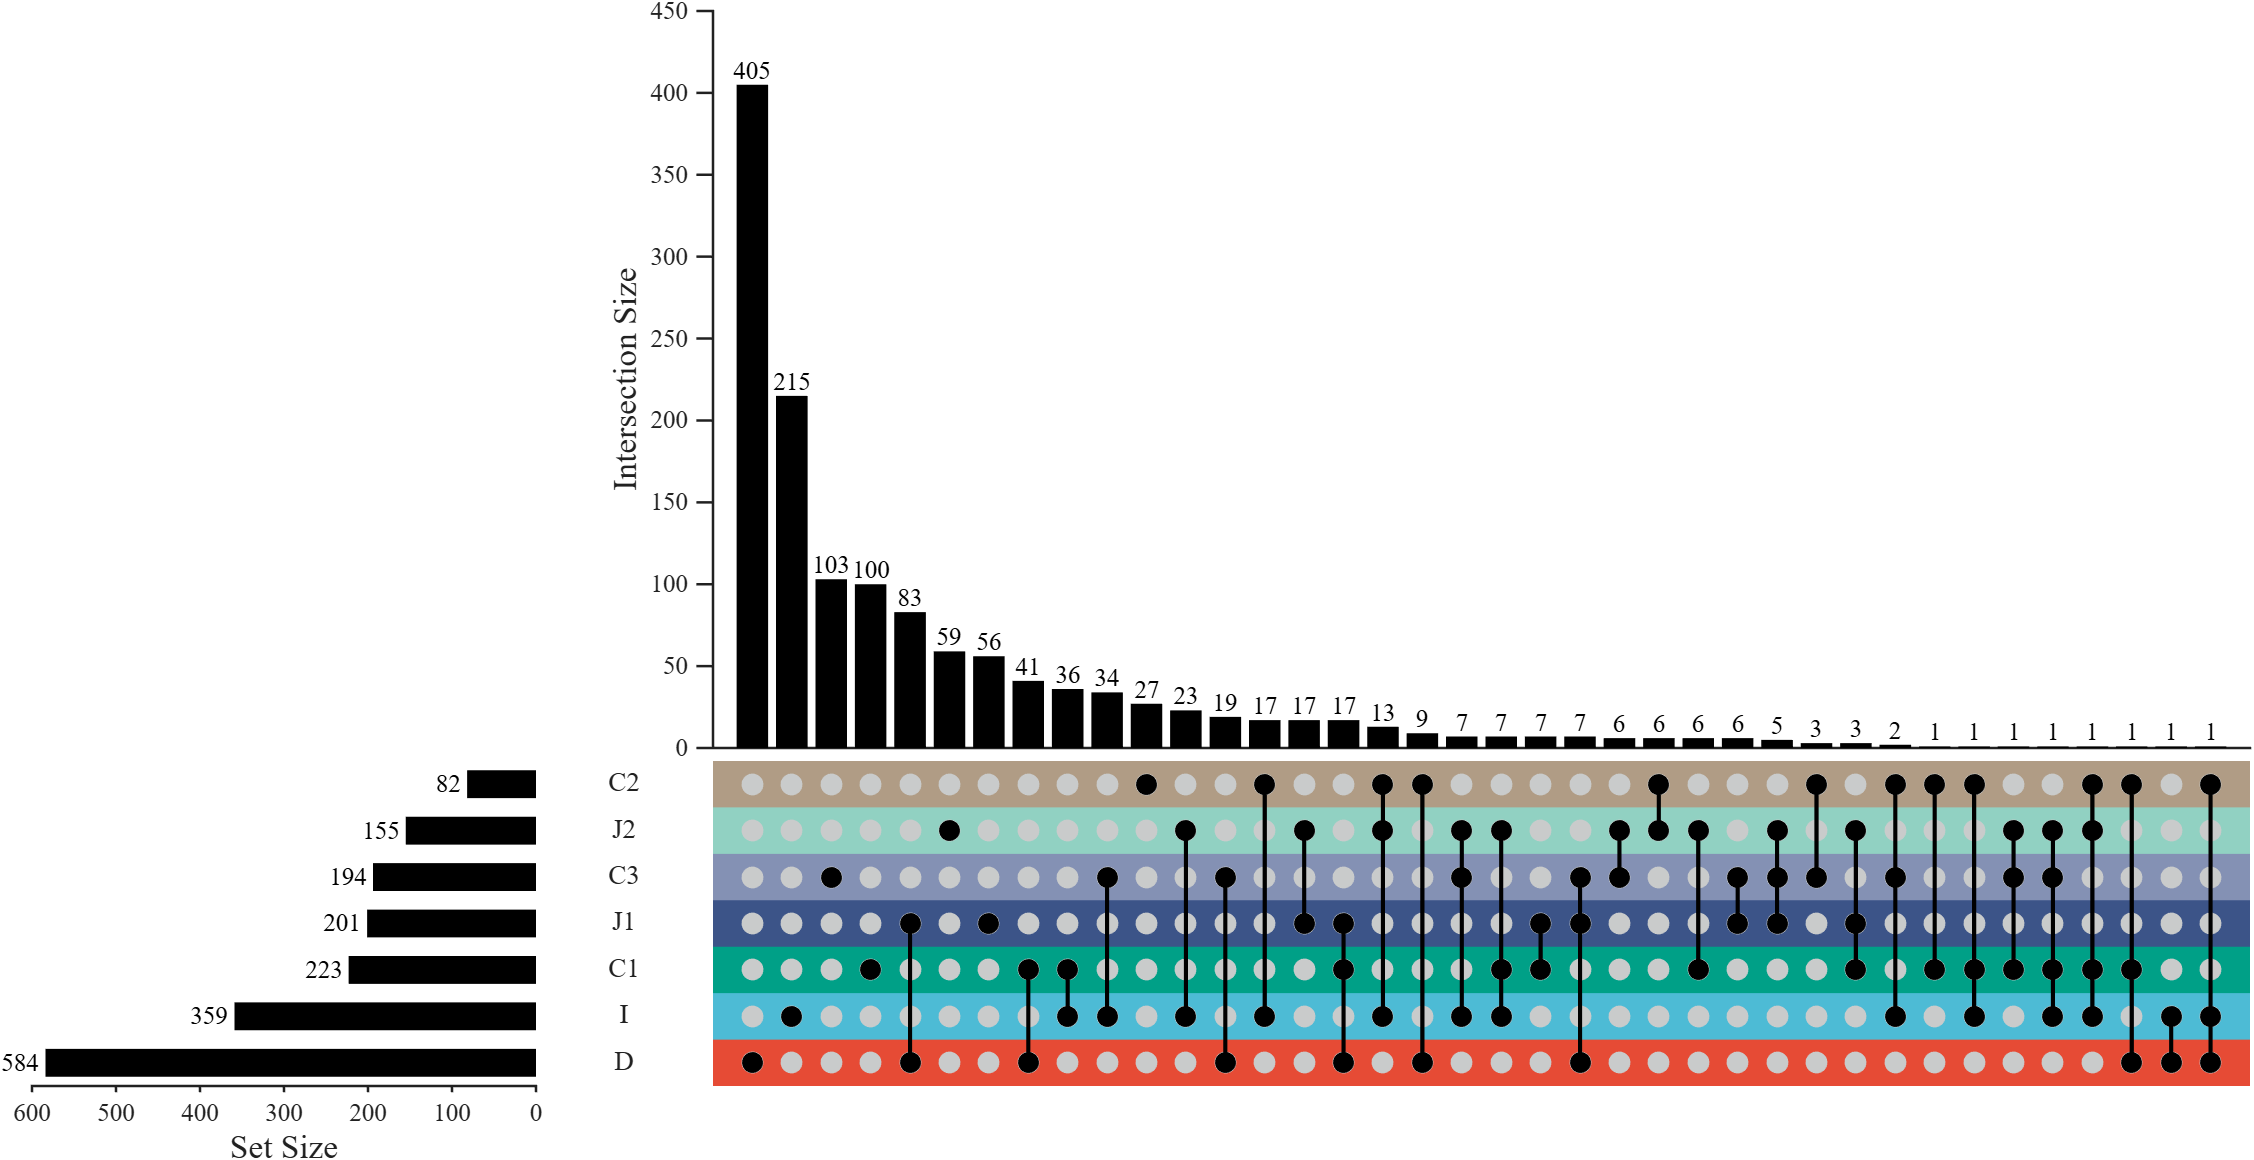
在 draw() 之前修改布局及排序:
matlab
% Set sorting and layout parameters (设置排序与布局参数)
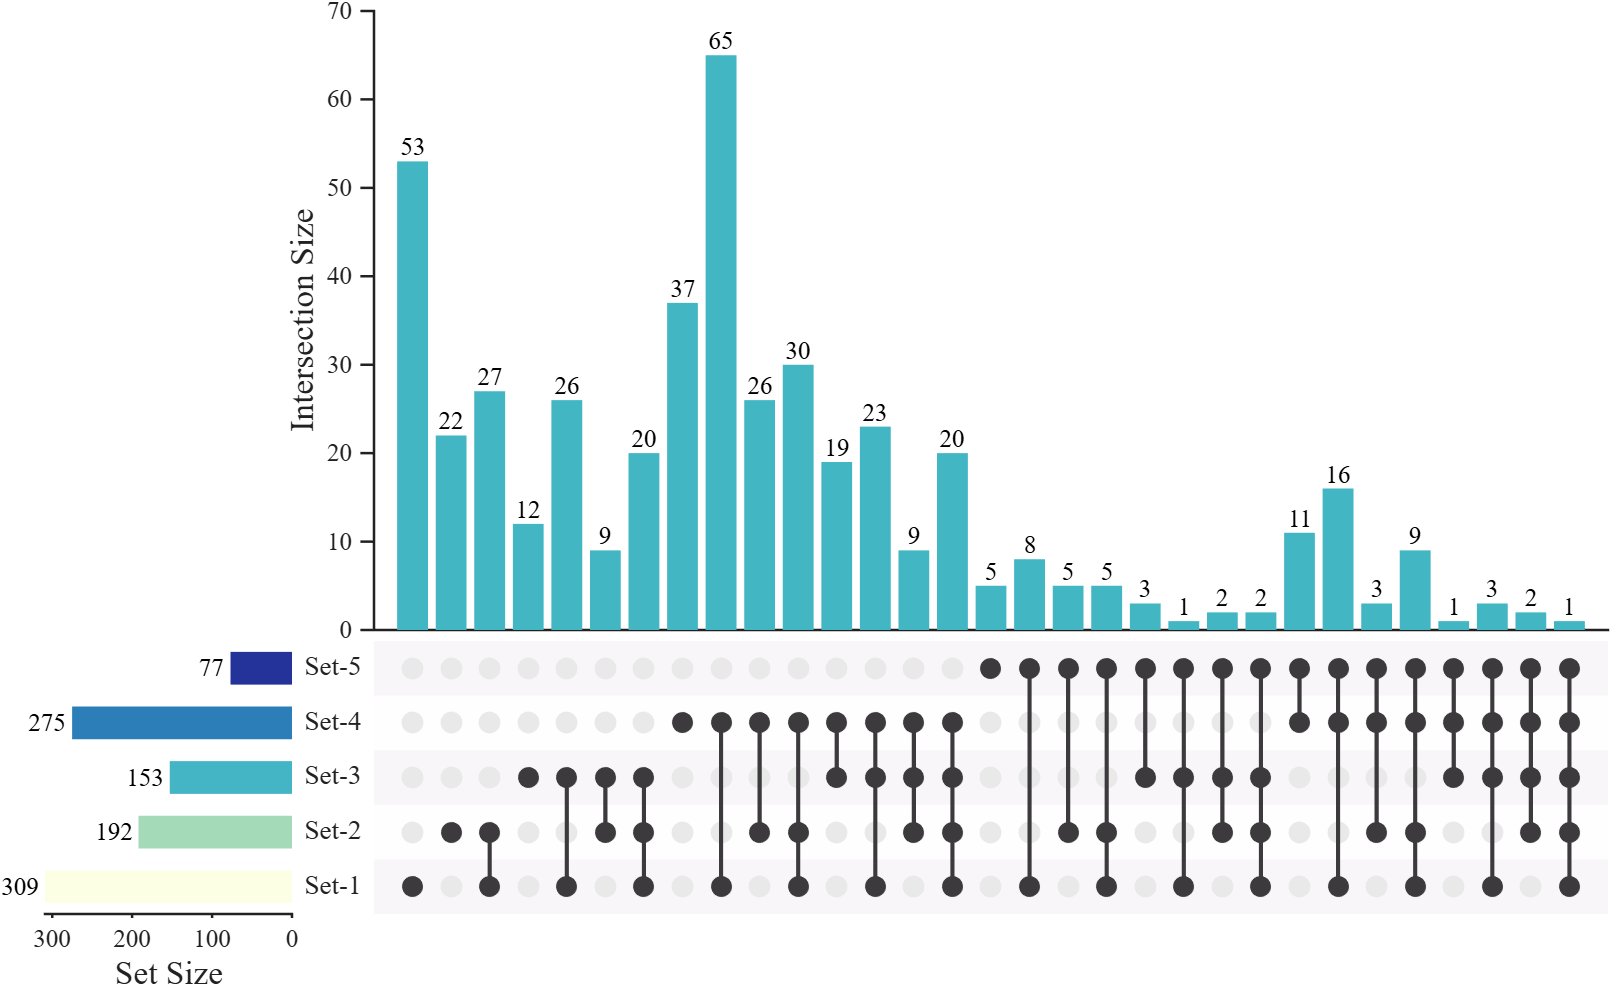
USP.SortS = 'none'; % Set sorting: none (集合排序:无)
USP.SortI = 'degbit'; % Intersection sorting: degree then bit (交集排序:按 degree 再按 bit)
USP.HRatio = [1, .8]; % Height ratio of bars vs matrix (条形与矩阵的高度比)
USP.WRatio = [8, 1, .15]; % Width ratio: matrix, set bars, name labels (宽度比:矩阵、集合条、标签)
USP.Padding = [.04, .08, .02, .28]; % Figure padding [left, right, bottom, top] (图窗边距)
USP.Layout = 3; % Layout style (布局样式)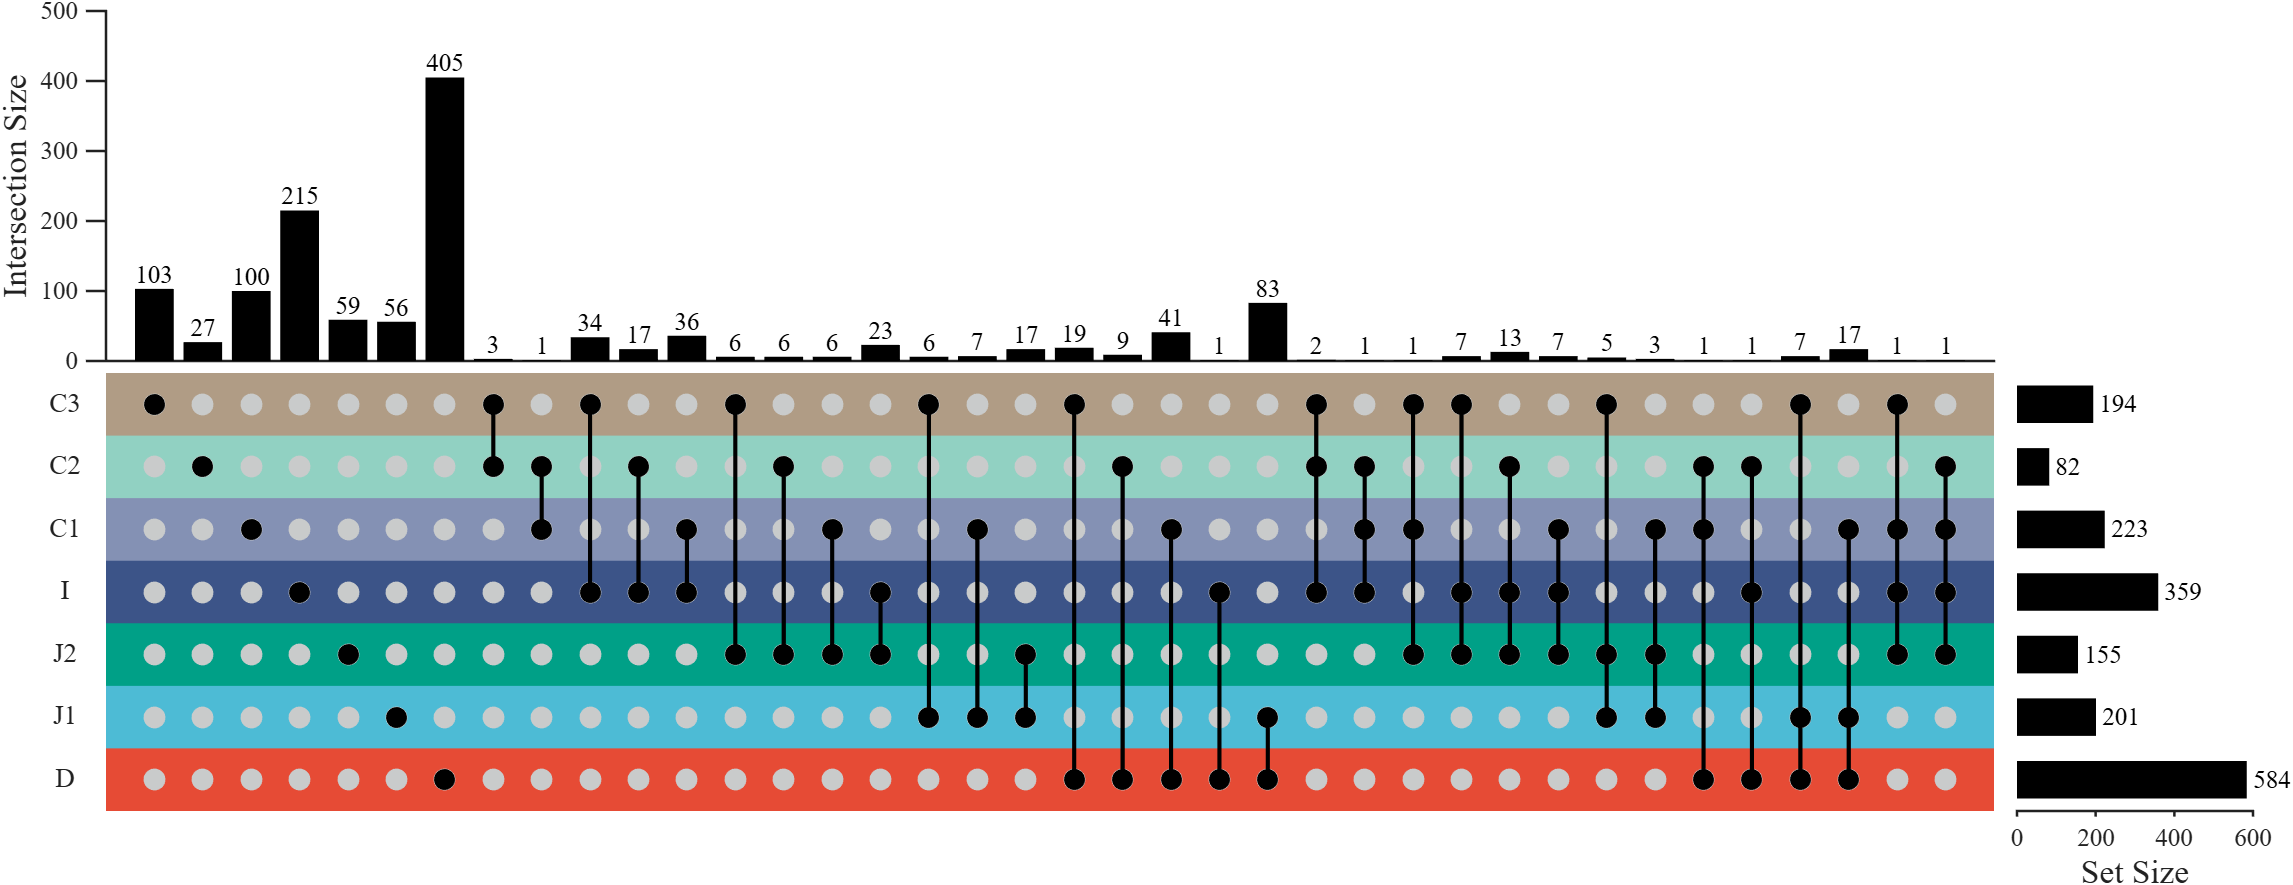
修饰一下:
matlab
% Reverse axes (翻转坐标轴)
USP.reverseXDir()
USP.reverseYDir()

% Adjust labels and decorations (调整标签与装饰)
set(USP.nameHdl, 'HorizontalAlignment','right')
set(USP.txtHdlI, 'Rotation',90, 'HorizontalAlignment','left', 'VerticalAlignment','middle')
set(USP.bkgPatchHdl, 'FaceAlpha',.5)
USP.axI.XColor = 'none';
USP.axI.YLabel.String = 'Shared genes';
USP.barHdlI.BaseLine.Color = 'none'; 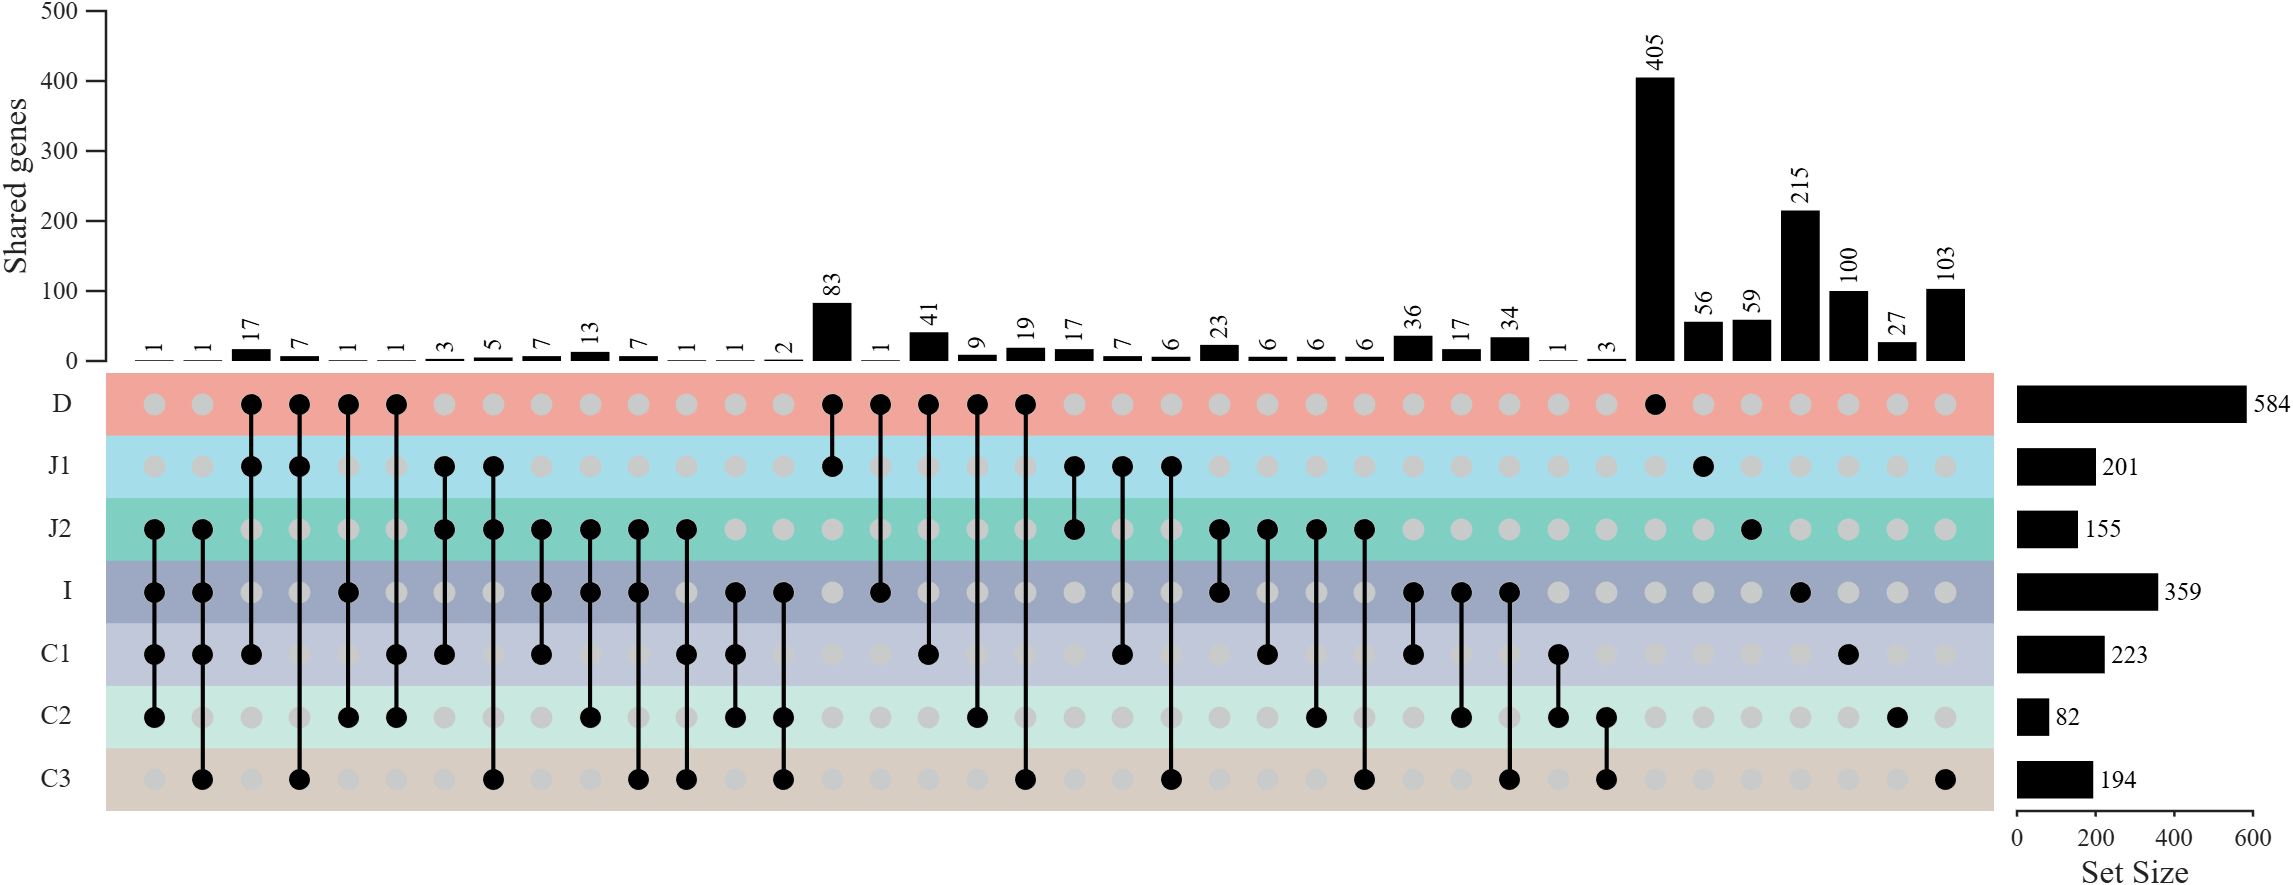
拼接
就在 UpSet 图的基础上创建一个 axes 在上面画弦图即可:
matlab
%... ...
axChord = axes('Parent',fig, 'Position',[.07,.47,.295,.52]);
%... ...
CC = chordChart(axChord, adjMat, 'RowName',rowName, 'ColName',colName);
%... ...
结
有工具函数、完整代码、原始数据的 gitee 仓库: