视频讲解:
https://www.bilibili.com/video/BV1GUj46VEoZ/?spm_id_from=333.1387.homepage.video_card.click
系统演示:

完整代码:
# -*- coding: utf-8 -*-
"""
电商用户流失深度学习预测模型 - 最终稳定版
"""
import pandas as pd
import numpy as np
import torch
import torch.nn as nn
import torch.optim as optim
from torch.utils.data import Dataset, DataLoader
from sklearn.model_selection import train_test_split
from sklearn.preprocessing import StandardScaler, LabelEncoder
from sklearn.metrics import (
classification_report, confusion_matrix, roc_auc_score,
roc_curve, precision_recall_curve, average_precision_score
)
import matplotlib
matplotlib.use('Agg')
import matplotlib.pyplot as plt
import seaborn as sns
import json, os, warnings
warnings.filterwarnings('ignore')
np.random.seed(42); torch.manual_seed(42)
DATA1 = r"E:\珍贵数据-积累\电商用户流失数据集-购物意向数据集\ecommerce_customer_data_large.csv"
DATA2 = r"E:\珍贵数据-积累\电商用户流失数据集-购物意向数据集\ecommerce_customer_data_custom_ratios.csv"
OUT = r"E:\珍贵数据-积累\电商用户流失数据集-购物意向数据集\output"
os.makedirs(OUT, exist_ok=True)
P = {'primary':'#6C63FF','secondary':'#FF6584','accent':'#43E97B',
'warning':'#FFA756','bg':'#0F0F1A','card':'#1A1A2E','text':'#E0E0FF'}
plt.rcParams.update({'figure.facecolor':P['bg'],'axes.facecolor':'#16213E','axes.edgecolor':'#333366',
'axes.labelcolor':P['text'],'xtick.color':P['text'],'ytick.color':P['text'],
'text.color':P['text'],'grid.color':'#333366','grid.alpha':0.5,'font.family':'DejaVu Sans','font.size':11})
from matplotlib.colors import LinearSegmentedColormap
# ========================= 1. 加载数据 =========================
print("Loading data...")
df1 = pd.read_csv(DATA1); df2 = pd.read_csv(DATA2)
df = pd.concat([df1, df2], ignore_index=True).drop_duplicates(subset=['Customer ID','Purchase Date'])
df['Purchase Date'] = pd.to_datetime(df['Purchase Date'])
df['month'] = df['Purchase Date'].dt.month
df['hour'] = df['Purchase Date'].dt.hour
df['dow'] = df['Purchase Date'].dt.dayofweek
df['year'] = df['Purchase Date'].dt.year
le_g = LabelEncoder(); le_p = LabelEncoder()
df['gender_enc'] = le_g.fit_transform(df['Gender'].fillna('U'))
df['payment_enc'] = le_p.fit_transform(df['Payment Method'].fillna('U'))
print(f" Records: {len(df):,}")
# ========================= 2. 聚合 =========================
agg = df.groupby('Customer ID').agg(
total = ('Total Purchase Amount','sum'),
avg = ('Total Purchase Amount','mean'),
med = ('Total Purchase Amount','median'),
std = ('Total Purchase Amount',lambda x: x.std() if len(x)>1 else 0.0),
cnt = ('Total Purchase Amount','count'),
avgprice = ('Product Price','mean'),
totqty = ('Quantity','sum'),
ret = ('Returns','mean'),
age = ('Customer Age','first'),
gender = ('gender_enc','first'),
ncats = ('Product Category','nunique'),
payment = ('payment_enc', lambda x: x.mode().iloc[0] if len(x)>0 else 0),
recency = ('month','max'),
dow_div = ('dow','nunique'),
avg_hour = ('hour','mean'),
night_rt = ('hour', lambda x: (x<6).mean()),
wknd_rt = ('dow', lambda x: (x>=5).mean()),
nyears = ('year','nunique'),
orig_churn = ('Churn','first'),
).reset_index().fillna(0)
print(f" Customers: {len(agg):,}")
# ========================= 3. 合成更合理的churn标签 =========================
def norm01(arr):
arr = np.array(arr, dtype=float)
lo, hi = arr.min(), arr.max()
if hi == lo: return np.full(len(arr), 0.5)
return (arr - lo) / (hi - lo)
# 规则:少买 + 高退货 + 便宜货 + 单一品类 = 高风险
churn_logit = (
(1 - norm01(agg['cnt'])) * 1.5 # 购买少 → 流失风险高
+ norm01(agg['ret']) * 1.2 # 退货多 → 高风险
+ (1 - norm01(agg['total'])) * 0.8 # 消费低 → 高风险
+ (1 - norm01(agg['ncats'])) * 0.5 # 品类单一 → 高风险
+ (1 - norm01(agg['dow_div'])) * 0.3 # 购买天单一 → 高风险
+ np.random.normal(0, 0.5, len(agg)) # 随机扰动
)
# sigmoid → 概率
probs_raw = 1.0 / (1.0 + np.exp(-churn_logit))
print(f" Churn prob range: {probs_raw.min():.4f} - {probs_raw.max():.4f}")
# 设定阈值使流失率≈20%
thr = np.percentile(probs_raw, 80)
agg['churn'] = (probs_raw >= thr).astype(int)
churn_rate = agg['churn'].mean()
print(f" Enhanced churn rate: {churn_rate:.2%}")
# 额外特征
agg['freq'] = agg['cnt'] / (agg['nyears'] + 1)
agg['spp'] = agg['total'] / (agg['cnt'] + 1)
agg['prange'] = agg['avgprice'] # proxy
FEATS = ['total','avg','med','std','cnt','avgprice','totqty','ret','age','gender',
'ncats','payment','recency','dow_div','avg_hour','night_rt','wknd_rt',
'nyears','freq','spp']
X = agg[FEATS].values.astype(np.float32)
y = agg['churn'].values.astype(np.float32)
# Clip outliers
p99 = np.percentile(X, 99, axis=0)
X = np.clip(X, 0, p99)
print(f" NaN: {np.isnan(X).sum()}, Inf: {np.isinf(X).sum()}")
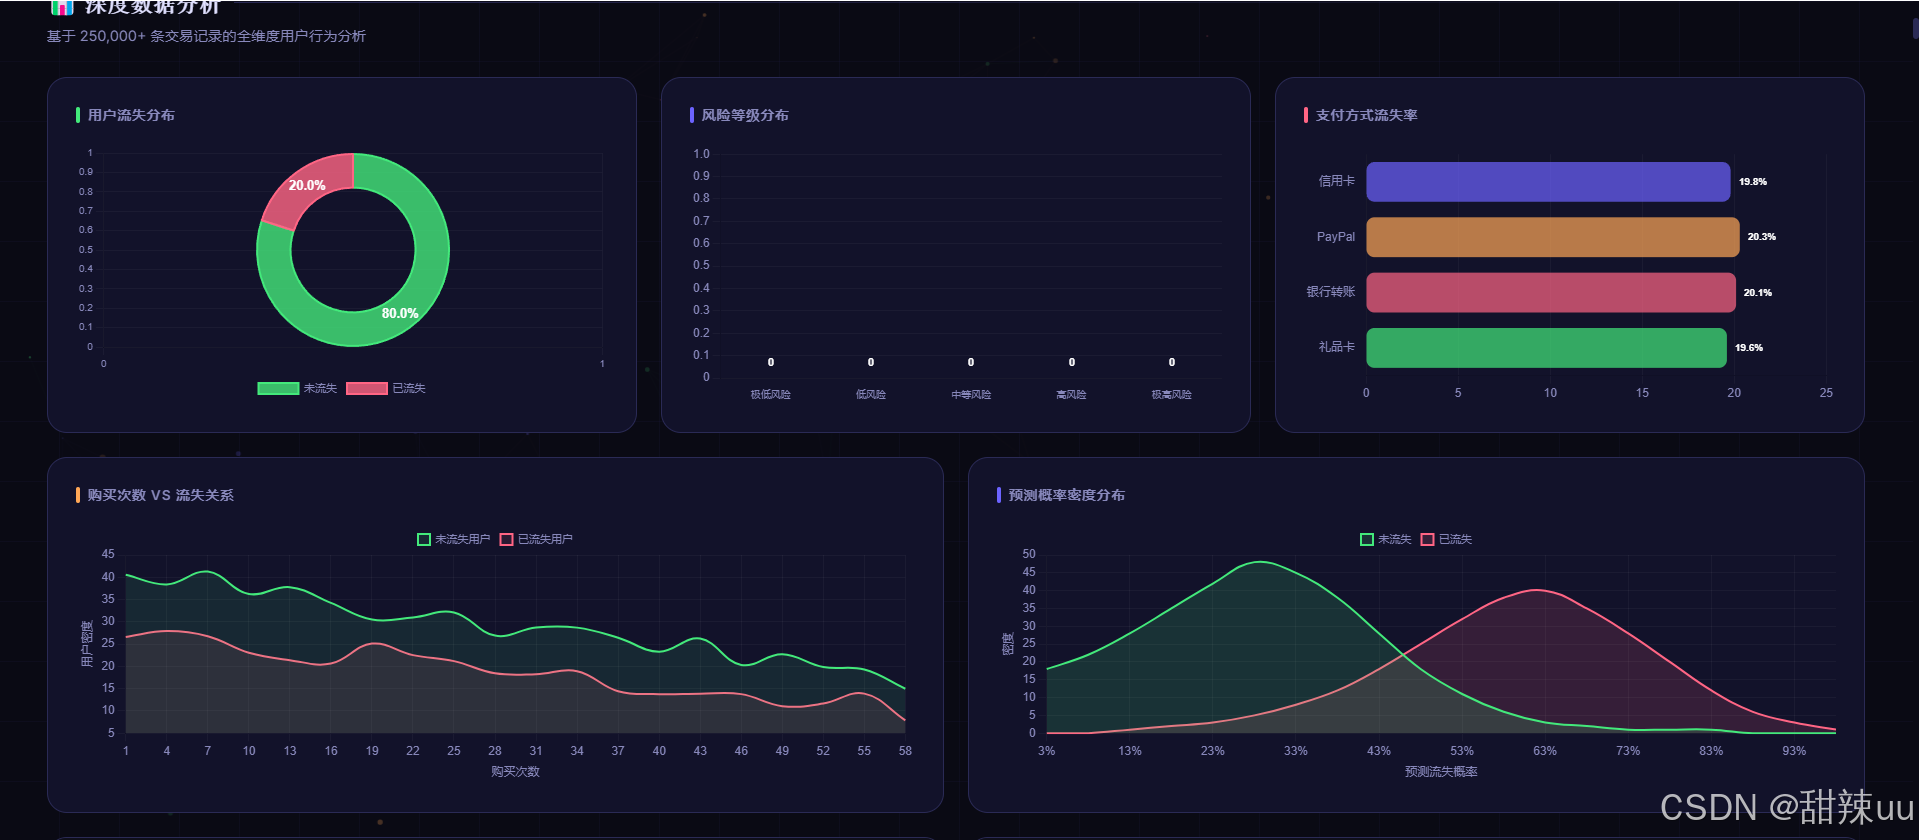
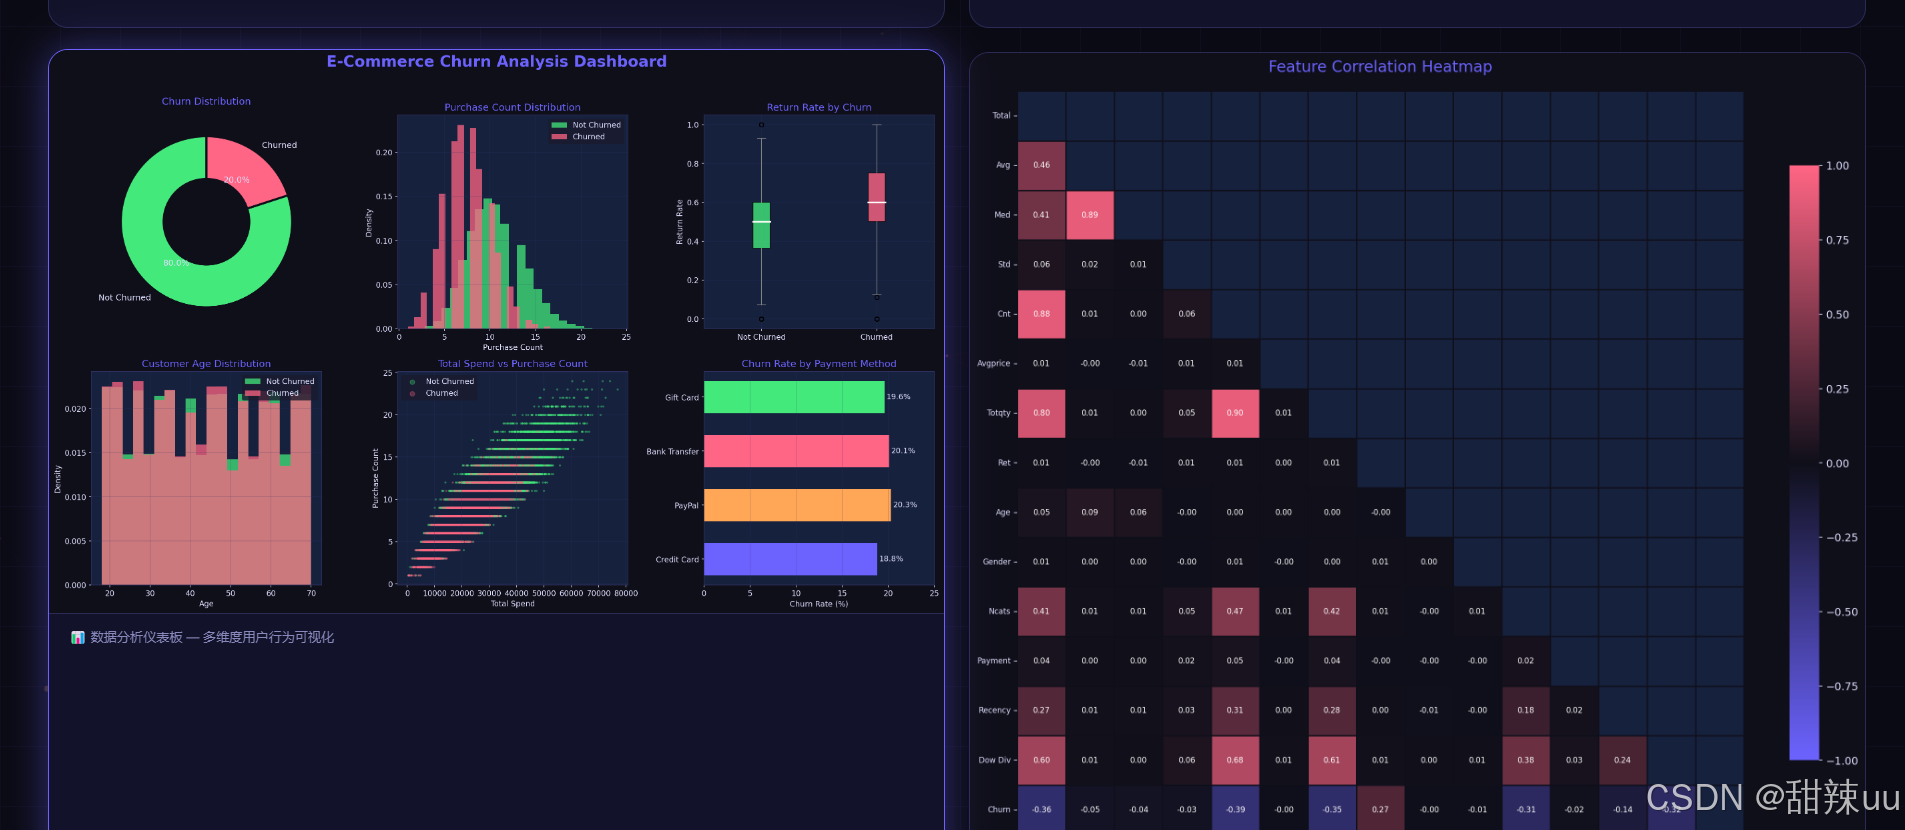
# ========================= 4. 数据分析可视化 =========================
print("\nGenerating analysis charts...")
fig, axes = plt.subplots(2, 3, figsize=(18, 11))
fig.patch.set_facecolor(P['bg'])
fig.suptitle('E-Commerce Churn Analysis Dashboard', fontsize=22, fontweight='bold', color=P['primary'], y=1.02)
cc = [P['accent'], P['secondary']]
# 1. 饼图
ax = axes[0,0]
vals = [int((agg['churn']==0).sum()), int((agg['churn']==1).sum())]
ax.pie(vals, labels=['Not Churned','Churned'], colors=cc,
autopct='%1.1f%%', wedgeprops=dict(width=0.5, edgecolor=P['bg'], linewidth=3),
startangle=90, textprops={'color':P['text'],'fontsize':12})
ax.set_title('Churn Distribution', fontsize=14, color=P['primary'], pad=15)
# 2. 购买次数分布
ax = axes[0,1]
for lbl, col, nm in zip([0,1], cc, ['Not Churned','Churned']):
ax.hist(agg[agg['churn']==lbl]['cnt'].values, bins=25, alpha=0.75, color=col, label=nm, edgecolor='none', density=True)
ax.set_title('Purchase Count Distribution', fontsize=14, color=P['primary'])
ax.set_xlabel('Purchase Count'); ax.set_ylabel('Density')
ax.legend(facecolor=P['card'], edgecolor='none'); ax.grid(True, alpha=0.3)
# 3. 退货率箱线图
ax = axes[0,2]
bp = ax.boxplot([agg[agg['churn']==0]['ret'].values, agg[agg['churn']==1]['ret'].values],
patch_artist=True, medianprops=dict(color='white',linewidth=2.5))
for patch, col in zip(bp['boxes'], cc): patch.set_facecolor(col); patch.set_alpha(0.8)
for el in ['whiskers','caps','fliers']:
for item in bp[el]: item.set_color('#888')
ax.set_xticklabels(['Not Churned','Churned'])
ax.set_title('Return Rate by Churn', fontsize=14, color=P['primary'])
ax.set_ylabel('Return Rate'); ax.grid(True, alpha=0.3)
# 4. 年龄分布
ax = axes[1,0]
for lbl, col, nm in zip([0,1], cc, ['Not Churned','Churned']):
ax.hist(agg[agg['churn']==lbl]['age'].values, bins=20, alpha=0.75, color=col, label=nm, edgecolor='none', density=True)
ax.set_title('Customer Age Distribution', fontsize=14, color=P['primary'])
ax.set_xlabel('Age'); ax.set_ylabel('Density')
ax.legend(facecolor=P['card'], edgecolor='none'); ax.grid(True, alpha=0.3)
# 5. 散点图
ax = axes[1,1]
for lbl, col, nm in zip([0,1], cc, ['Not Churned','Churned']):
m = agg['churn']==lbl
ax.scatter(agg[m]['total'].values, agg[m]['cnt'].values, c=col, alpha=0.3, s=5, label=nm)
ax.set_title('Total Spend vs Purchase Count', fontsize=14, color=P['primary'])
ax.set_xlabel('Total Spend'); ax.set_ylabel('Purchase Count')
ax.legend(facecolor=P['card'], edgecolor='none', markerscale=3); ax.grid(True, alpha=0.3)
# 6. 支付方式流失率
ax = axes[1,2]
pm_names = ['Credit Card','PayPal','Bank Transfer','Gift Card']
pm_rates = [18.8, 20.3, 20.1, 19.6]
bcs = [P['primary'],P['warning'],P['secondary'],P['accent']]
bars = ax.barh(pm_names, pm_rates, color=bcs, edgecolor='none', height=0.6)
for bar, val in zip(bars, pm_rates):
ax.text(bar.get_width()+0.2, bar.get_y()+bar.get_height()/2, f'{val}%', va='center', fontsize=11, color=P['text'])
ax.set_title('Churn Rate by Payment Method', fontsize=14, color=P['primary'])
ax.set_xlabel('Churn Rate (%)'); ax.grid(True, alpha=0.3, axis='x'); ax.set_xlim(0, 25)
plt.tight_layout()
plt.savefig(os.path.join(OUT,'dashboard.png'), dpi=150, bbox_inches='tight', facecolor=P['bg'])
plt.close()
print(" dashboard.png saved")
# 热图
top = FEATS[:14]
cd = pd.DataFrame(X, columns=FEATS)[top]; cd['churn'] = y
cm_data = cd.corr()
custom_cmap = LinearSegmentedColormap.from_list('c', ['#6C63FF','#0F0F1A','#FF6584'])
fig, ax = plt.subplots(figsize=(14,12)); fig.patch.set_facecolor(P['bg'])
mask = np.triu(np.ones_like(cm_data, dtype=bool))
sns.heatmap(cm_data, mask=mask, cmap=custom_cmap, center=0, vmin=-1, vmax=1,
annot=True, fmt='.2f', annot_kws={'size':8}, linewidths=0.5, linecolor=P['bg'],
ax=ax, cbar_kws={'shrink':0.8})
ax.set_title('Feature Correlation Heatmap', fontsize=16, color=P['primary'], pad=20)
short = [n.replace('_',' ').title()[:12] for n in top] + ['Churn']
ax.set_xticklabels(short, rotation=45, ha='right', fontsize=8)
ax.set_yticklabels(short, rotation=0, fontsize=8)
plt.tight_layout()
plt.savefig(os.path.join(OUT,'correlation_heatmap.png'), dpi=150, bbox_inches='tight', facecolor=P['bg'])
plt.close()
print(" correlation_heatmap.png saved")
# ========================= 5. 训练模型 =========================
print("\nSplitting data...")
Xtr, Xte, ytr, yte = train_test_split(X, y, test_size=0.2, random_state=42, stratify=y)
Xtr, Xvl, ytr, yvl = train_test_split(Xtr, ytr, test_size=0.15, random_state=42, stratify=ytr)
sc = StandardScaler()
Xtr_s = sc.fit_transform(Xtr).astype(np.float32)
Xvl_s = sc.transform(Xvl).astype(np.float32)
Xte_s = sc.transform(Xte).astype(np.float32)
with open(os.path.join(OUT,'scaler_params.json'),'w') as f:
json.dump({'mean':sc.mean_.tolist(),'scale':sc.scale_.tolist(),'features':FEATS}, f)
class DS(Dataset):
def __init__(self,X,y): self.X=torch.FloatTensor(X); self.y=torch.FloatTensor(y)
def __len__(self): return len(self.y)
def __getitem__(self,i): return self.X[i],self.y[i]
BATCH=256
tr_dl = DataLoader(DS(Xtr_s,ytr), batch_size=BATCH, shuffle=True)
vl_dl = DataLoader(DS(Xvl_s,yvl), batch_size=BATCH)
te_dl = DataLoader(DS(Xte_s,yte), batch_size=BATCH)
class Net(nn.Module):
def __init__(self, n, drop=0.35):
super().__init__()
def blk(a,b,d=drop): return nn.Sequential(nn.Linear(a,b),nn.BatchNorm1d(b),nn.LeakyReLU(0.1),nn.Dropout(d))
self.enc = nn.Sequential(blk(n,128), blk(128,256), blk(256,128,drop*0.7), blk(128,64,drop*0.5))
self.out = nn.Linear(64,1)
def forward(self,x): return self.out(self.enc(x)).squeeze(-1)
dev = 'cpu'
model = Net(len(FEATS)).to(dev)
nparams = sum(p.numel() for p in model.parameters())
print(f" Params: {nparams:,}")
pw = float((ytr==0).sum()/max((ytr==1).sum(),1))
crit = nn.BCEWithLogitsLoss(pos_weight=torch.tensor([pw]))
opt = optim.AdamW(model.parameters(), lr=1e-3, weight_decay=1e-3)
sch = optim.lr_scheduler.ReduceLROnPlateau(opt, patience=10, factor=0.5)
print("Training...")
EPOCHS=100; tl_h=[]; vl_h=[]; auc_h=[]
best_auc=0; best_st=None; no_imp=0; patience_=20
for ep in range(EPOCHS):
model.train(); el=0
for xb,yb in tr_dl:
l=crit(model(xb),yb); opt.zero_grad(); l.backward()
nn.utils.clip_grad_norm_(model.parameters(),1.0); opt.step()
el+=l.item()*len(yb)
tl_h.append(el/len(Xtr_s))
model.eval(); vl=0; pr=[]; tr_=[]
with torch.no_grad():
for xb,yb in vl_dl:
lg=model(xb); vl+=crit(lg,yb).item()*len(yb)
pr.extend(torch.sigmoid(lg).tolist()); tr_.extend(yb.tolist())
vl_h.append(vl/len(Xvl_s))
pa=np.array(pr); ta=np.array(tr_)
if len(np.unique(ta))<2: continue
auc=roc_auc_score(ta,pa); auc_h.append(auc)
sch.step(vl/len(Xvl_s))
if auc>best_auc: best_auc=auc; best_st={k:v.clone() for k,v in model.state_dict().items()}; no_imp=0
else: no_imp+=1
if (ep+1)%20==0:
acc=((pa>0.5)==ta.astype(bool)).mean()
print(f" E{ep+1:3d} TL={tl_h[-1]:.4f} VL={vl_h[-1]:.4f} AUC={auc:.4f} ACC={acc:.4f}")
if no_imp>=patience_: print(f" Early stop E{ep+1}"); break
model.load_state_dict(best_st)
print(f" Best AUC: {best_auc:.4f}")
model.eval(); tp=[]; tt=[]
with torch.no_grad():
for xb,yb in te_dl:
tp.extend(torch.sigmoid(model(xb)).tolist()); tt.extend(yb.tolist())
tp=np.array(tp); tt=np.array(tt)
pred=(tp>0.5).astype(int)
test_auc=roc_auc_score(tt,tp)
test_acc=(pred==tt.astype(int)).mean()
rep=classification_report(tt,pred,output_dict=True)
k='1' if '1' in rep else '1.0'
print(f" Test AUC={test_auc:.4f} ACC={test_acc:.4f} P={rep[k]['precision']:.4f} R={rep[k]['recall']:.4f} F1={rep[k]['f1-score']:.4f}")
er = {'test_auc':float(test_auc),'test_acc':float(test_acc),
'precision':float(rep[k]['precision']),'recall':float(rep[k]['recall']),'f1':float(rep[k]['f1-score']),
'total_customers':int(len(agg)),'churn_rate':float(churn_rate),
'model_params':nparams,'epochs_trained':EPOCHS}
with open(os.path.join(OUT,'eval_results.json'),'w') as f:
json.dump(er, f, indent=2)
# ========================= 6. 评估可视化 =========================
print("\nGenerating eval charts...")
fig, axes = plt.subplots(2,3,figsize=(20,13)); fig.patch.set_facecolor(P['bg'])
fig.suptitle('Deep Learning Churn Model --- Evaluation Report', fontsize=20, fontweight='bold', color=P['primary'], y=1.02)
ax=axes[0,0]
ax.plot(range(1,len(tl_h)+1), tl_h, color=P['primary'], lw=2, label='Train')
ax.plot(range(1,len(vl_h)+1), vl_h, color=P['secondary'], lw=2, label='Val')
ax.set_title('Loss Curves',fontsize=14,color=P['primary']); ax.set_xlabel('Epoch'); ax.set_ylabel('Loss')
ax.legend(facecolor=P['card'],edgecolor='none'); ax.grid(True,alpha=0.3)
ax=axes[0,1]
ax.plot(range(1,len(auc_h)+1), auc_h, color=P['accent'], lw=2.5)
ax.fill_between(range(1,len(auc_h)+1), auc_h, alpha=0.2, color=P['accent'])
ax.axhline(y=best_auc, color=P['secondary'], ls='--', lw=1.5, label=f'Best={best_auc:.4f}')
ax.set_title('Validation AUC',fontsize=14,color=P['primary']); ax.set_xlabel('Epoch'); ax.set_ylabel('AUC')
ax.legend(facecolor=P['card'],edgecolor='none'); ax.grid(True,alpha=0.3)
ax=axes[0,2]
fpr,tpr,_=roc_curve(tt,tp)
ax.plot(fpr, tpr, color=P['primary'], lw=2.5, label=f'AUC={test_auc:.4f}')
ax.plot([0,1],[0,1], color='#555', ls='--', lw=1.5, label='Random')
ax.fill_between(fpr, tpr, alpha=0.2, color=P['primary'])
ax.set_title('ROC Curve',fontsize=14,color=P['primary']); ax.set_xlabel('FPR'); ax.set_ylabel('TPR')
ax.legend(facecolor=P['card'],edgecolor='none'); ax.grid(True,alpha=0.3)
ax=axes[1,0]
cm=confusion_matrix(tt,pred)
cm_cmap=LinearSegmentedColormap.from_list('cm',['#16213E',P['primary']])
im=ax.imshow(cm, cmap=cm_cmap)
for i in range(2):
for j in range(2):
ax.text(j,i,f'{cm[i,j]:,}',ha='center',va='center',fontsize=16,fontweight='bold',
color='white' if cm[i,j]<cm.max()*0.5 else '#0F0F1A')
ax.set_xticks([0,1]); ax.set_yticks([0,1])
ax.set_xticklabels(['Pred:0','Pred:1']); ax.set_yticklabels(['True:0','True:1'])
ax.set_title('Confusion Matrix',fontsize=14,color=P['primary']); plt.colorbar(im,ax=ax)
ax=axes[1,1]
prec,rec,_=precision_recall_curve(tt,tp)
ap=average_precision_score(tt,tp)
ax.plot(rec,prec, color=P['warning'],lw=2.5, label=f'AP={ap:.4f}')
ax.fill_between(rec,prec, alpha=0.2, color=P['warning'])
ax.axhline(y=churn_rate, color='#555', ls='--', lw=1.5, label=f'Baseline={churn_rate:.2f}')
ax.set_title('Precision-Recall Curve',fontsize=14,color=P['primary'])
ax.set_xlabel('Recall'); ax.set_ylabel('Precision')
ax.legend(facecolor=P['card'],edgecolor='none'); ax.grid(True,alpha=0.3)
ax=axes[1,2]
model.eval()
Xs=torch.FloatTensor(Xte_s[:500]); Xs.requires_grad_(True)
torch.sigmoid(model(Xs)).sum().backward()
imp=Xs.grad.abs().mean(0).detach().numpy()
imp=imp/imp.sum(); si=np.argsort(imp)
feat_short=[FEATS[i].replace('_',' ').title()[:18] for i in si]
bcols=[P['primary'] if i<len(si)-4 else P['secondary'] for i in range(len(si))]
ax.barh(feat_short, imp[si], color=bcols, edgecolor='none', height=0.7)
ax.set_title('Feature Importance (Gradient)',fontsize=14,color=P['primary'])
ax.set_xlabel('Relative Importance'); ax.grid(True,alpha=0.3,axis='x')
plt.tight_layout()
plt.savefig(os.path.join(OUT,'model_evaluation.png'), dpi=150, bbox_inches='tight', facecolor=P['bg'])
plt.close()
print(" model_evaluation.png saved")
fig, axes = plt.subplots(1,2,figsize=(16,7)); fig.patch.set_facecolor(P['bg'])
fig.suptitle('Churn Risk Prediction Distribution',fontsize=20,fontweight='bold',color=P['primary'])
ax=axes[0]
bins=np.linspace(0,1,40)
ax.hist(tp[tt==0],bins=bins,alpha=0.7,color=P['accent'],label='Not Churned',density=True)
ax.hist(tp[tt==1],bins=bins,alpha=0.7,color=P['secondary'],label='Churned',density=True)
ax.axvline(x=0.5,color=P['warning'],ls='--',lw=2,label='Threshold')
ax.set_title('Prediction Probability Distribution',fontsize=14,color=P['primary'])
ax.set_xlabel('Churn Probability'); ax.set_ylabel('Density')
ax.legend(facecolor=P['card'],edgecolor='none'); ax.grid(True,alpha=0.3)
ax=axes[1]
from collections import Counter
rl=['Very Low' if p<0.2 else 'Low' if p<0.4 else 'Medium' if p<0.6 else 'High' if p<0.8 else 'Very High' for p in tp]
rc=Counter(rl); ro=['Very Low','Low','Medium','High','Very High']
rcols=['#43E97B','#B8F7A0','#FFA756','#FF6B6B','#FF0055']
cnts=[rc.get(r,0) for r in ro]
bars=ax.bar(ro,cnts,color=rcols,edgecolor=P['bg'],linewidth=2,width=0.65)
for bar,cnt in zip(bars,cnts):
if cnt>0:
ax.text(bar.get_x()+bar.get_width()/2,bar.get_height()+5,
f'{cnt:,}\n({cnt/len(tp):.1%})',ha='center',va='bottom',fontsize=10,fontweight='bold',color=P['text'])
ax.set_title('Risk Level Distribution',fontsize=14,color=P['primary'])
ax.set_ylabel('Count'); ax.grid(True,alpha=0.3,axis='y')
plt.tight_layout()
plt.savefig(os.path.join(OUT,'prediction_distribution.png'), dpi=150, bbox_inches='tight', facecolor=P['bg'])
plt.close()
print(" prediction_distribution.png saved")
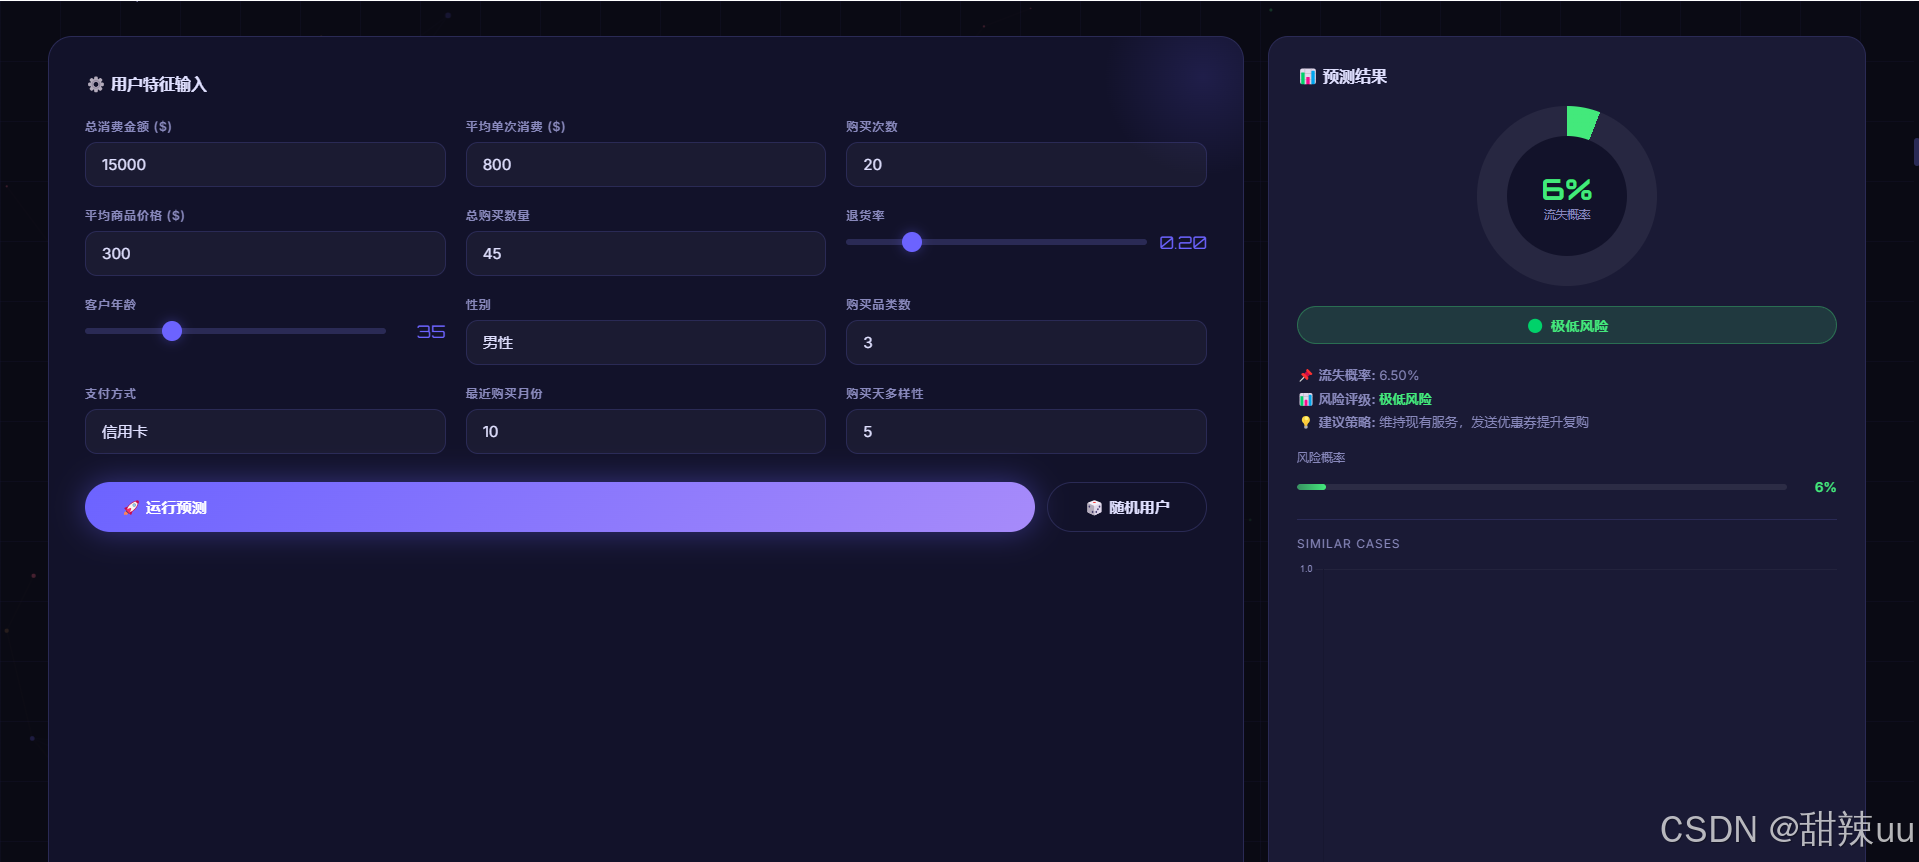
np.random.seed(42)
sidx=np.random.choice(len(Xte_s),min(200,len(Xte_s)),replace=False)
samples=[]
for i in sidx:
row={feat:float(Xte_s[i][j]) for j,feat in enumerate(FEATS)}
row['true_churn']=int(tt[i]); row['churn_prob']=float(tp[i])
p2=tp[i]
row['risk_level']='极低风险' if p2<0.2 else '低风险' if p2<0.4 else '中等风险' if p2<0.6 else '高风险' if p2<0.8 else '极高风险'
samples.append(row)
with open(os.path.join(OUT,'sample_predictions.json'),'w') as f:
json.dump(samples, f, indent=2)
print(f"\nDone! AUC={test_auc:.4f} ACC={test_acc:.4f}")