在项目管理场景中,甘特图的时间跨度往往长达数年甚至十年以上。vxe-gantt 提供了年视图(year),让你可以清晰展示长期任务的规划和进度。本文介绍年视图的两种使用方式:默认模式和精确模式,并通过示例对比它们的区别与应用场景。
概述
vxe-gantt 通过 taskViewConfig.scales 配置项控制时间轴的展示粒度。当设置为 'year' 时,甘特图以"年"为最小时间单位进行渲染。
| 配置项 | 值 | 说明 |
|---|---|---|
| taskViewConfig.scales | 'year' | 以年为维度渲染时间轴,每个单元格代表一年。 |
| taskViewConfig.viewStyle.cellWidth | 数值(如 120) | 每个年份单元格的宽度(单位:px)。 |
| taskConfig.dateFormat | 日期格式字符串 | 控制日期解析精度,决定甘特条在单元格内的精确位置。 |
适用场景:跨年度的大型工程规划、产品路线图、长期战略项目等。
默认模式:以年为粒度渲染
在默认模式下,甘特图仅解析任务的 年份(yyyy),每个单元格对应一整年。任务条以年份为单位在时间轴上定位,不区分具体的月份或日期。
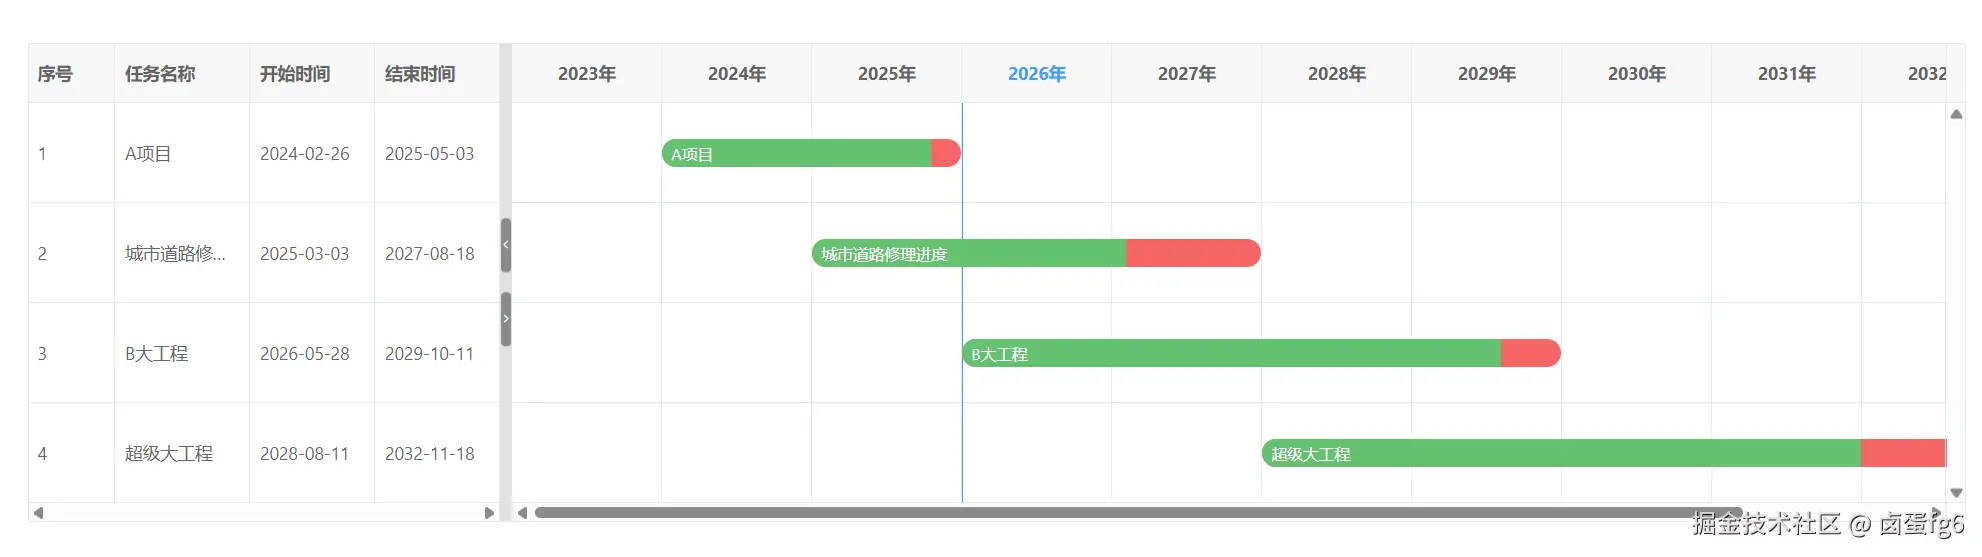
| 特点 | 说明 |
|---|---|
| ✅ 简单直观 | 无需关心具体日期,只看年份即可。 |
| ✅ 性能更优 | 按年渲染,单元格数量少,滚动流畅。 |
| ⚠️ 精度有限 | 无法区分同一年的不同月份或季度。 |
| 💡 适用场景 | 宏观规划、高层汇报、年度里程碑展示。 |
html
<template>
  <div>
    <vxe-gantt v-bind="ganttOptions"></vxe-gantt>
  </div>
</template>

<script setup>
import { reactive } from 'vue'

const ganttOptions = reactive({
  border: true,
  showOverflow: true,
  cellConfig: {
    height: 80
  },
  taskBarConfig: {
    showProgress: true,
    showContent: true,
    barStyle: {
      round: true,
      bgColor: '#f56565',
      completedBgColor: '#65c16f'
    }
  },
  taskViewConfig: {
    scales: ['year'],
    tableStyle: {
      width: 320
    },
    viewStyle: {
      cellWidth: 120
    }
  },
  columns: [
    { type: 'seq', field: 'seq', width: 70 },
    { field: 'title', title: '任务名称' },
    { field: 'start', title: '开始时间', width: 100 },
    { field: 'end', title: '结束时间', width: 100 }
  ],
  data: [
    { id: 10001, title: 'A项目', start: '2024-02-26', end: '2025-05-03', progress: 90 },
    { id: 10002, title: '城市道路修理进度', start: '2025-03-03', end: '2027-08-18', progress: 70 },
    { id: 10003, title: 'B大工程', start: '2026-05-28', end: '2029-10-11', progress: 90 },
    { id: 10004, title: '超级大工程', start: '2028-08-11', end: '2032-11-18', progress: 80 }
  ]
})
</script>
精确模式
通过设置 taskConfig.dateFormat,可以指定日期解析格式,让甘特条在单元格内按实际开始/结束日期精确显示进度。即使是年视图,也能在单元格内呈现出任务在一年中的具体起止位置。
注意:精确模式下,任务的 start 和 end 字段必须与 dateFormat 格式保持一致。
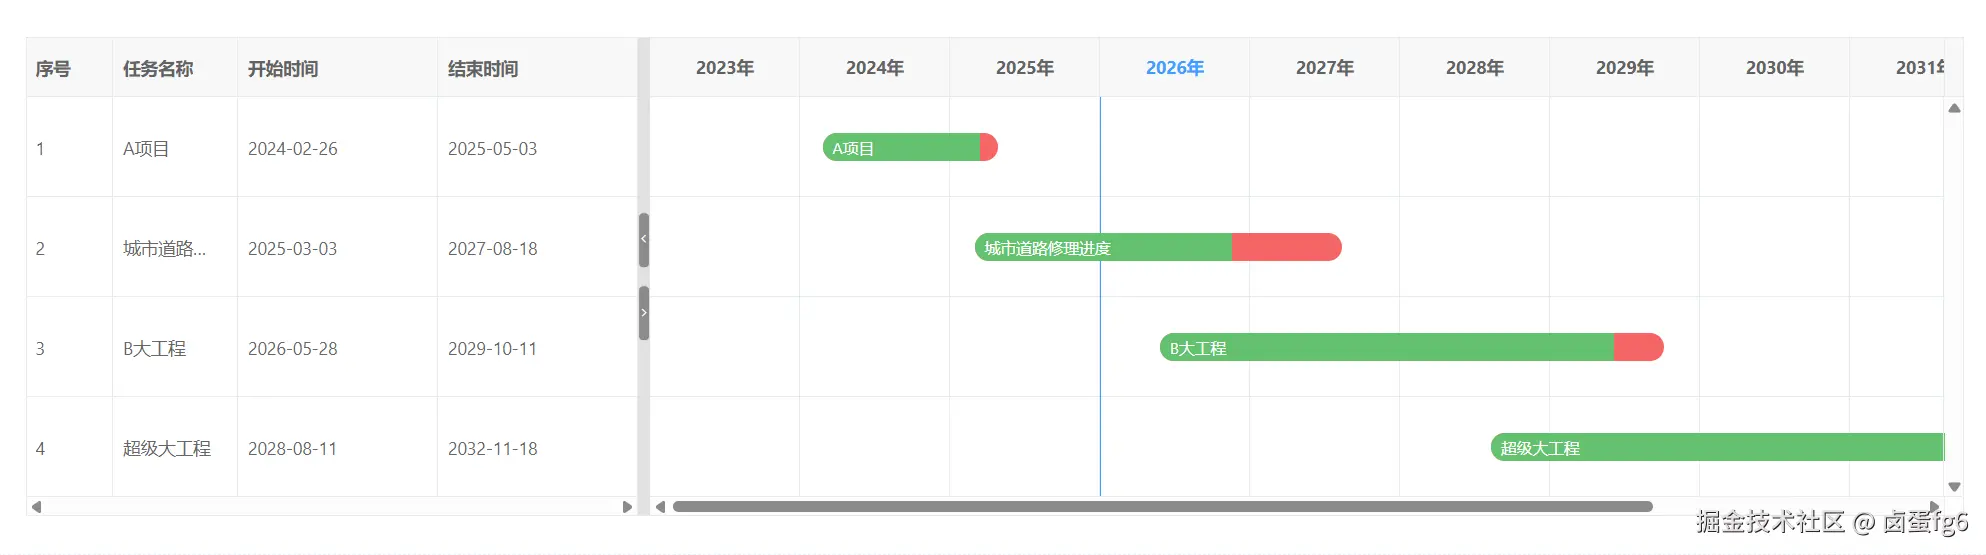
| 特点 | 说明 |
|---|---|
| ✅ 精度高 | 可精确到月或日,甘特条位置与实际日期对应。 |
| ✅ 视觉更细腻 | 单元格内能直观看出任务在年内的分布。 |
| ⚠️ 数据要求更高 | 日期字段必须包含完整的年月日信息。 |
| 💡 适用场景 | 详细进度跟踪、需要区分年内时间点的场景。 |
html
<template>
  <div>
    <vxe-gantt v-bind="ganttOptions"></vxe-gantt>
  </div>
</template>

<script setup>
import { reactive } from 'vue'

const ganttOptions = reactive({
  border: true,
  showOverflow: true,
  cellConfig: {
    height: 80
  },
  taskConfig: {
    dateFormat: 'yyyy-MM-dd'
  },
  taskBarConfig: {
    showProgress: true,
    showContent: true,
    barStyle: {
      round: true,
      bgColor: '#f56565',
      completedBgColor: '#65c16f'
    }
  },
  taskViewConfig: {
    scales: ['year'],
    tableStyle: {
      width: 320
    },
    viewStyle: {
      cellWidth: 120
    }
  },
  columns: [
    { type: 'seq', field: 'seq', width: 70 },
    { field: 'title', title: '任务名称' },
    { field: 'start', title: '开始时间', width: 160 },
    { field: 'end', title: '结束时间', width: 160 }
  ],
  data: [
    { id: 10001, title: 'A项目', start: '2024-02-26', end: '2025-05-03', progress: 90 },
    { id: 10002, title: '城市道路修理进度', start: '2025-03-03', end: '2027-08-18', progress: 70 },
    { id: 10003, title: 'B大工程', start: '2026-05-28', end: '2029-10-11', progress: 90 },
    { id: 10004, title: '超级大工程', start: '2028-08-11', end: '2032-11-18', progress: 80 }
  ]
})
</script>
两种模式对比
| 对比维度 | 默认模式 | 精确模式 |
|---|---|---|
| 日期解析 | 仅解析年份(yyyy) | 按 dateFormat 解析(如 yyyy-MM-dd) |
| 甘特条精度 | 以年为单位,占据整年位置 | 精确到月/日,在单元格内按比例定位 |
| 数据字段要求 | start/end 至少包含年份 | start/end 必须包含完整的月/日信息 |
| 视觉表现 | 甘特条左对齐年份起始位置 | 甘特条根据实际日期在单元格内偏移 |
| 性能开销 | 较低 | 稍高(需要更精细的日期计算) |
| 典型场景 | 高层规划、年度概览 | 执行跟踪、详细排期 |
- vxe-gantt 的年视图提供了两种使用模式:
- 默认模式:简单直观,以年为粒度展示任务,适合宏观规划场景。
- 精确模式:通过 taskConfig.dateFormat 指定日期精度,在年视图内精确定位任务起止,适合需要细粒度展示的跟踪场景。
可根据实际业务需求,在"简洁性"与"精确性"之间选择合适的模式。