文章目录
-
-
- 每日一句正能量
- 一、前言:当BI遇见AI智能体
- 二、技术架构设计
- 三、四层智能体协同机制
-
- [3.1 清洗智能体(Cleaner Agent)](#3.1 清洗智能体(Cleaner Agent))
- [3.2 分析智能体(Analyzer Agent)](#3.2 分析智能体(Analyzer Agent))
- [3.3 可视化智能体(Visualizer Agent)](#3.3 可视化智能体(Visualizer Agent))
- [3.4 洞察智能体(Insight Agent)](#3.4 洞察智能体(Insight Agent))
- 四、环境配置与项目初始化
-
- [4.1 工程配置(build-profile.json5)](#4.1 工程配置(build-profile.json5))
- [4.2 权限配置(module.json5)](#4.2 权限配置(module.json5))
- 五、核心代码实战
-
- [5.1 四层智能体调度器(AgentScheduler.ets)](#5.1 四层智能体调度器(AgentScheduler.ets))
- [5.2 清洗智能体(CleanerAgent.ets)](#5.2 清洗智能体(CleanerAgent.ets))
- [5.3 可视化智能体(VisualizerAgent.ets)](#5.3 可视化智能体(VisualizerAgent.ets))
- [5.4 沉浸光效数据密度同步(DataDensityLightSync.ets)](#5.4 沉浸光效数据密度同步(DataDensityLightSync.ets))
- [5.5 悬浮导航数据工作台(DataFloatNav.ets)](#5.5 悬浮导航数据工作台(DataFloatNav.ets))
- 六、关键技术总结
-
- [6.1 四层智能体协同调度](#6.1 四层智能体协同调度)
- [6.2 图表自动推荐策略](#6.2 图表自动推荐策略)
- [6.3 数据密度光效映射](#6.3 数据密度光效映射)
- 七、效果展示
- 八、总结与展望
-

每日一句正能量
"当我们不再执着于对抗,时间反而能听见生命拔节的声音。"
人常把生活当成战场,习惯与困难、过去、甚至自己对抗。但"对抗"会制造噪音,让人听不见内在的变化。一旦放下执念,时间便从敌人变成土壤,而成长(拔节)原本静默有声,只是我们之前太吵。柔软比刚强更有力量。
行动缓解焦虑,深度获得沉淀,心定产生清明,善物而不役物,坦诚是真城府,把握分寸,留有余地,适可而止,过犹不及,盛极必衰。
一、前言:当BI遇见AI智能体
2026年,商业智能(BI)已从"静态报表展示"进化为"AI驱动的动态洞察平台"。HarmonyOS 6(API 23)发布的HMAF智能体框架 与ArkUI可视化引擎,为开发者提供了构建"会说话的数据分析工作台"的完整能力。传统BI工具需要用户手动选择图表类型、配置数据源、调整样式,而智能体BI平台通过四层智能体协同(清洗→分析→可视化→洞察),实现"数据自动理解、图表智能生成、洞察主动推荐"。
本文将实战开发一款面向HarmonyOS PC的**「数智视界」**数据可视化分析工作台,核心创新在于:
- 🧹 清洗智能体:自动识别数据质量问题(缺失值、异常值、重复值),执行去重/补全/标准化
- 📊 分析智能体:自动选择统计方法(描述统计、趋势分析、关联分析),生成分析报告
- 🎨 可视化智能体:根据数据特征自动推荐图表类型(柱状图/折线图/饼图/热力图),支持交互式渲染
- 💡 洞察智能体:基于分析结果自动发现异常、预测趋势、推荐行动方案
- 💡 沉浸光效数据密度:根据数据密度(稀疏/正常/密集/过载)触发不同系统光效,防止数据过载疲劳
本文代码亮点:完整实现从数据接入、四层智能体协同处理、可视化渲染到洞察推荐的完整链路,所有代码可直接在DevEco Studio 6.0.2 + HarmonyOS SDK 6.1.0(API 23)环境中运行。
二、技术架构设计
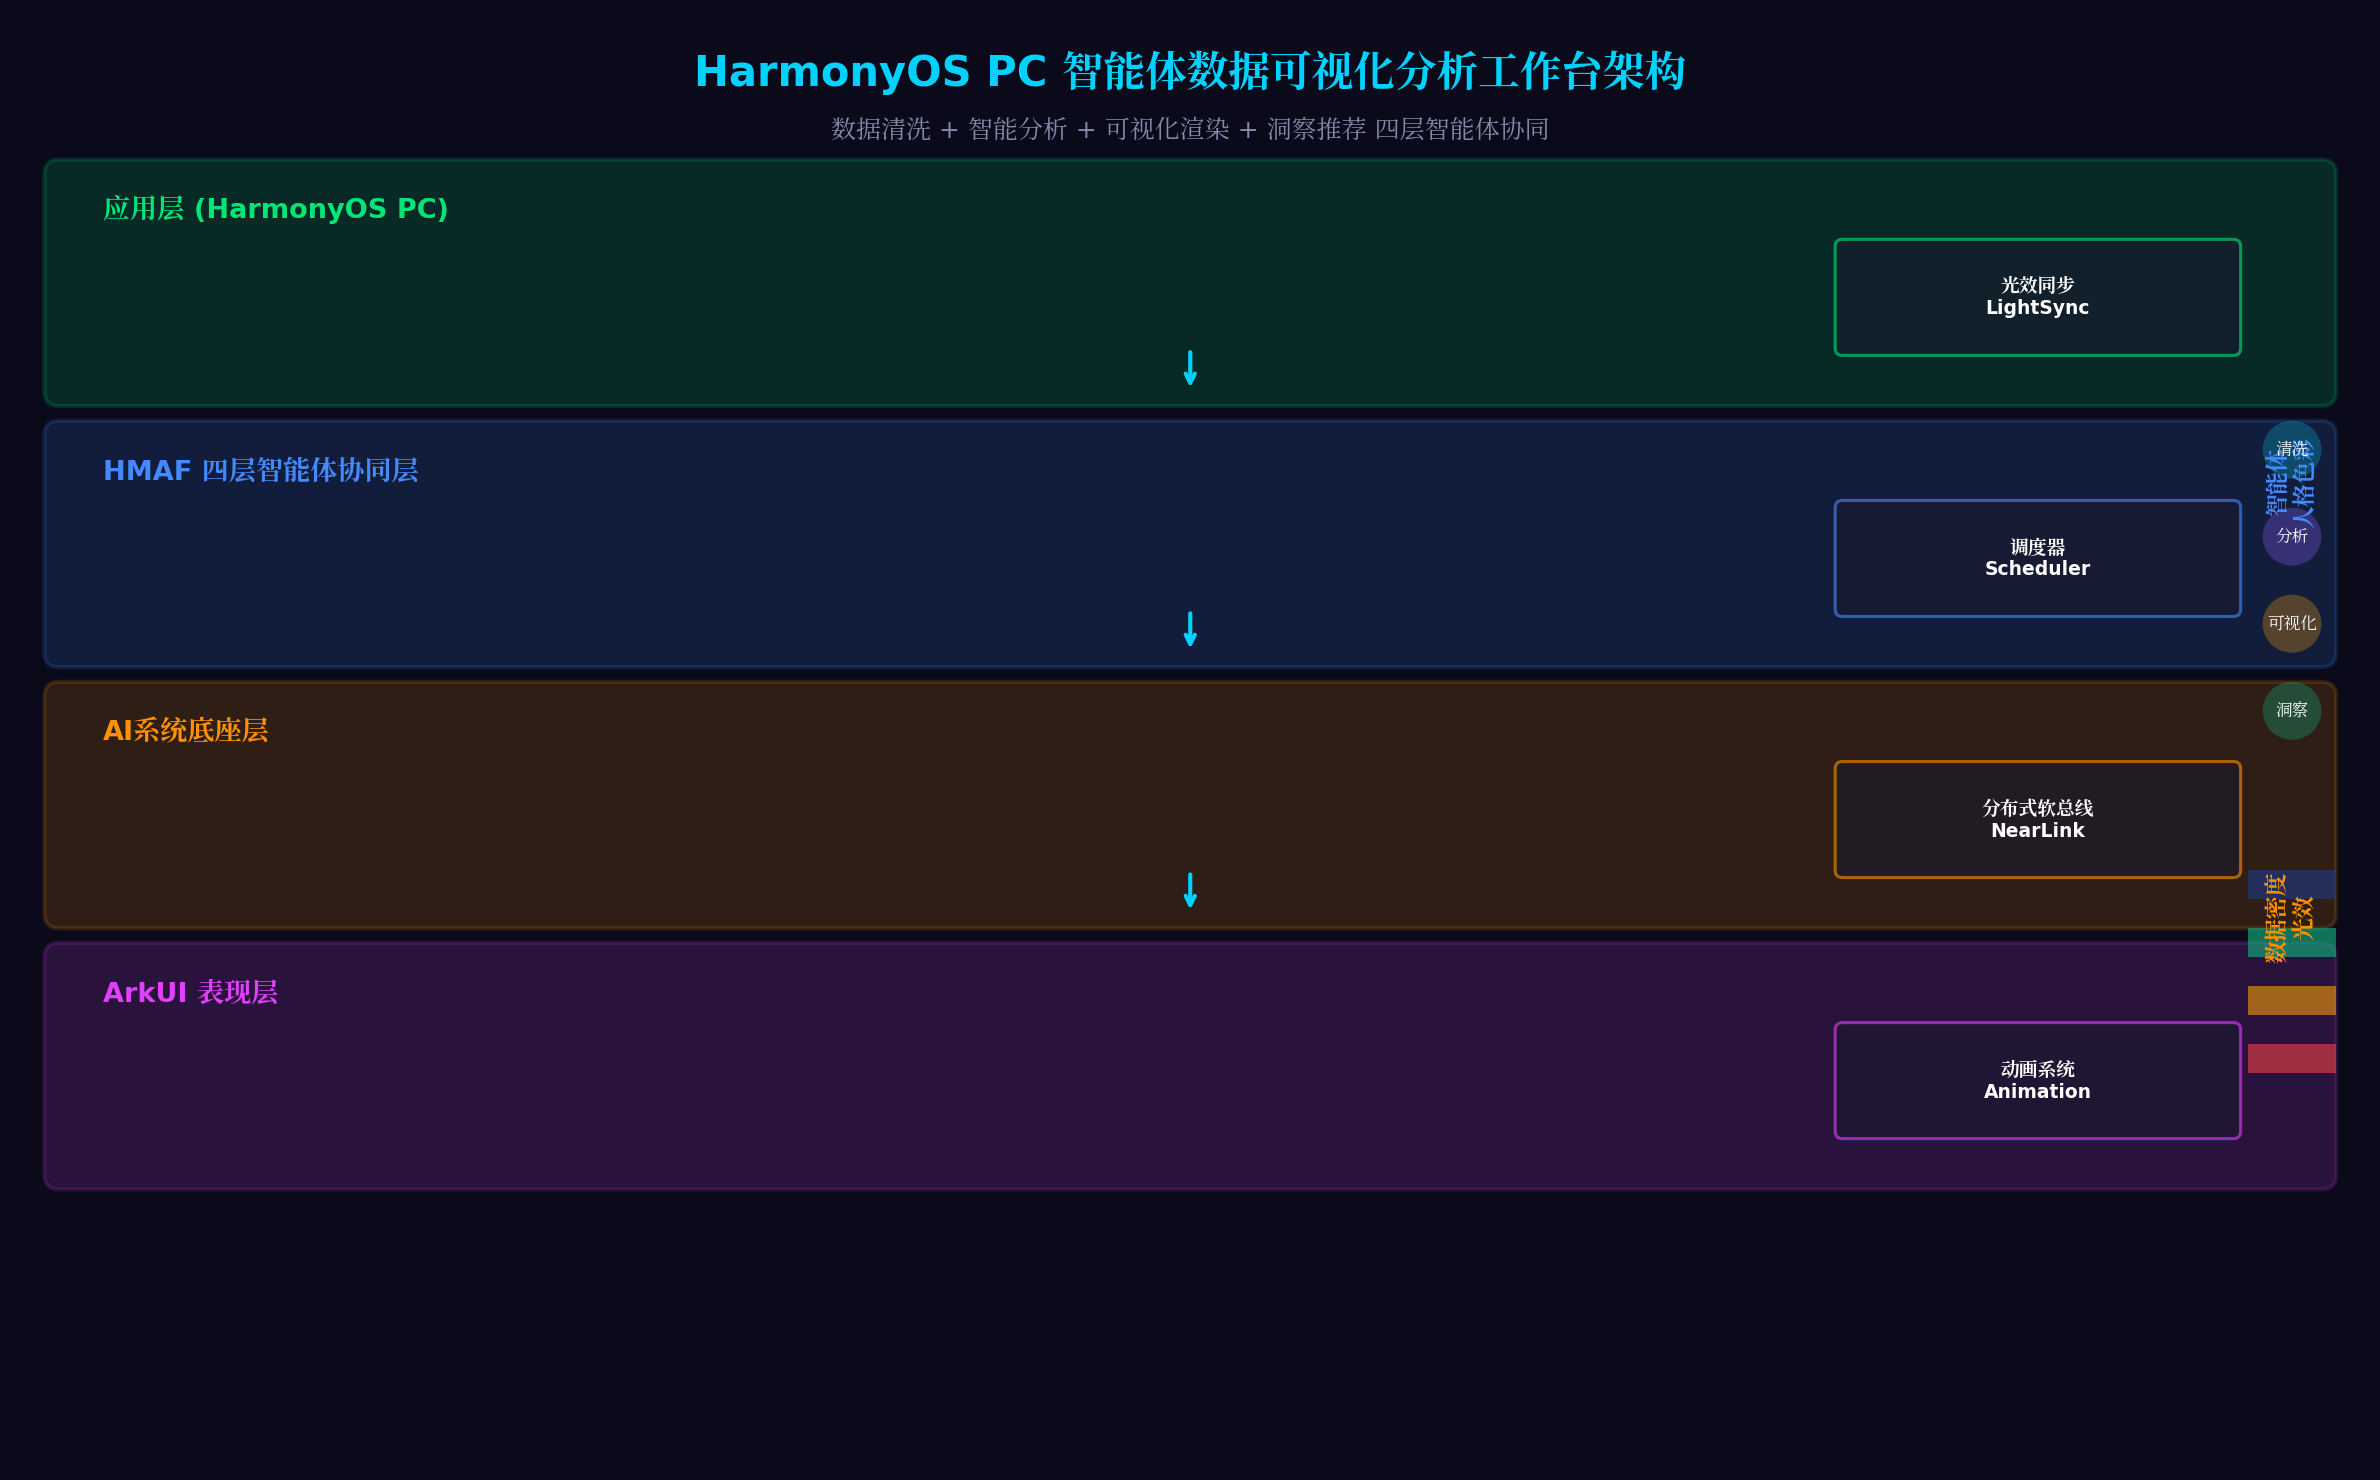
架构分层说明:
| 层级 | 核心组件 | 职责 |
|---|---|---|
| 应用层 | 数据画布、悬浮导航、洞察面板、浮动图表窗口、光效同步 | 用户交互与可视化展示 |
| HMAF智能体层 | 清洗智能体、分析智能体、可视化智能体、洞察智能体、调度器 | 四层智能体协同处理 |
| AI系统底座层 | MindSpore Lite端侧推理、鸿蒙大模型4.0云端推理、意图引擎、NLU Kit、分布式软总线 | AI能力支撑 |
| ArkUI表现层 | 悬浮导航HdsTabs、沉浸光感ImmersiveLight、多窗口管理、安全区扩展、动画系统 | UI渲染与交互 |
三、四层智能体协同机制
3.1 清洗智能体(Cleaner Agent)
负责数据质量评估与清洗,核心能力:
- 缺失值检测:自动识别缺失比例,选择删除/填充/插值策略
- 异常值识别:基于IQR/Z-Score/孤立森林算法检测异常
- 重复值去重:智能识别业务主键,执行去重操作
- 数据标准化:自动识别数据类型,执行编码/归一化/离散化
3.2 分析智能体(Analyzer Agent)
负责统计分析与模式发现,核心能力:
- 描述统计:均值、中位数、标准差、分布特征
- 趋势分析:时间序列分解、季节性检测、趋势预测
- 关联分析:相关系数、卡方检验、Apriori关联规则
- 聚类分析:K-Means、DBSCAN、层次聚类
3.3 可视化智能体(Visualizer Agent)
负责图表生成与交互渲染,核心能力:
- 图表推荐:基于数据特征自动推荐最优图表类型
- 交互渲染:支持缩放、筛选、钻取、联动
- 响应式布局:自适应PC大屏、平板、手机多尺寸
- 动画过渡:数据更新时平滑过渡动画
3.4 洞察智能体(Insight Agent)
负责异常发现与行动推荐,核心能力:
- 异常检测:基于统计阈值/机器学习/规则引擎发现异常
- 趋势预测:ARIMA/LSTM/Prophet时序预测
- 根因分析:5Why分析、鱼骨图、决策树
- 行动推荐:基于业务规则推荐优化方案
四、环境配置与项目初始化
4.1 工程配置(build-profile.json5)
json
{
  "app": {
    "bundleName": "com.example.datavision",
    "versionCode": 1000000,
    "versionName": "1.0.0",
    "minSdkVersion": "6.0.0(23)",
    "targetSdkVersion": "6.1.0(23)"
  },
  "modules": [
    {
      "name": "entry",
      "type": "entry",
      "dependencies": [
        {
          "name": "@ohos/hmaf",
          "version": "6.1.0.100"
        },
        {
          "name": "@ohos/mindspore",
          "version": "6.1.0.100"
        },
        {
          "name": "@ohos/arkui",
          "version": "6.1.0.100"
        }
      ]
    }
  ]
}
4.2 权限配置(module.json5)
json
{
  "module": {
    "requestPermissions": [
      {
        "name": "ohos.permission.ACCESS_AI_ENGINE",
        "reason": "用于智能体数据分析与洞察生成",
        "usedScene": { "when": "always" }
      },
      {
        "name": "ohos.permission.INTERNET",
        "reason": "用于云端大模型推理",
        "usedScene": { "when": "always" }
      },
      {
        "name": "ohos.permission.READ_USER_STORAGE",
        "reason": "用于读取本地数据文件",
        "usedScene": { "when": "user_grant" }
      }
    ]
  }
}
五、核心代码实战
5.1 四层智能体调度器(AgentScheduler.ets)
代码亮点 :实现中央调度器,负责任务分发、状态监控、结果聚合。支持串行执行(默认)、并行执行(独立任务)、条件执行(基于前置结果)三种调度模式。通过AppStorage实现跨组件状态同步。
typescript
// entry/src/main/ets/scheduler/AgentScheduler.ets
import { hmaf } from '@kit.HMAFramework';

export enum AgentType {
  CLEANER = 'cleaner',
  ANALYZER = 'analyzer',
  VISUALIZER = 'visualizer',
  INSIGHT = 'insight'
}

export interface AgentTask {
  id: string;
  type: AgentType;
  input: any;
  priority: number;
  dependencies: string[]; // 依赖任务ID
  status: 'pending' | 'running' | 'completed' | 'failed';
  result?: any;
  error?: string;
  startTime?: number;
  endTime?: number;
}

export interface ScheduleConfig {
  mode: 'sequential' | 'parallel' | 'conditional';
  timeout: number;
  retryCount: number;
}

export class AgentScheduler {
  private agents: Map<AgentType, hmaf.Agent> = new Map();
  private taskQueue: AgentTask[] = [];
  private runningTasks: Map<string, AgentTask> = new Map();
  private completedTasks: Map<string, AgentTask> = new Map();

  // 回调
  public onTaskStart: ((task: AgentTask) => void) | null = null;
  public onTaskComplete: ((task: AgentTask) => void) | null = null;
  public onTaskFailed: ((task: AgentTask) => void) | null = null;
  public onAllComplete: ((results: Map<string, AgentTask>) => void) | null = null;

  async init(): Promise<void> {
    // 初始化四层智能体
    for (const agentType of Object.values(AgentType)) {
      const agent = await hmaf.createAgent({
        agentName: `${agentType}_agent`,
        agentDescription: this.getAgentDescription(agentType),
        interactionMode: [hmaf.InteractionMode.SYSTEM]
      });

      this.agents.set(agentType, agent);
      console.info(`[AgentScheduler] ${agentType}智能体初始化完成`);
    }
  }

  private getAgentDescription(type: AgentType): string {
    const descriptions: Record<AgentType, string> = {
      [AgentType.CLEANER]: '数据清洗智能体:去重、补全、标准化',
      [AgentType.ANALYZER]: '数据分析智能体:统计、趋势、关联',
      [AgentType.VISUALIZER]: '可视化智能体:图表、交互、渲染',
      [AgentType.INSIGHT]: '洞察智能体:异常、预测、建议'
    };
    return descriptions[type];
  }

  // 提交任务
  async submitTask(task: AgentTask): Promise<void> {
    this.taskQueue.push(task);
    console.info(`[AgentScheduler] 任务已提交: ${task.id}`);

    // 触发调度
    await this.scheduleTasks();
  }

  // 批量提交任务
  async submitTasks(tasks: AgentTask[]): Promise<void> {
    this.taskQueue.push(...tasks);
    await this.scheduleTasks();
  }

  // 任务调度核心逻辑
  private async scheduleTasks(): Promise<void> {
    // 获取可执行任务(依赖已满足)
    const executableTasks = this.taskQueue.filter(task =>
      task.status === 'pending' &&
      task.dependencies.every(depId => this.completedTasks.has(depId))
    );

    // 按优先级排序
    executableTasks.sort((a, b) => b.priority - a.priority);

    for (const task of executableTasks) {
      // 从队列移除
      this.taskQueue = this.taskQueue.filter(t => t.id !== task.id);

      // 执行任务
      this.executeTask(task);
    }
  }

  // 执行单个任务
  private async executeTask(task: AgentTask): Promise<void> {
    task.status = 'running';
    task.startTime = Date.now();
    this.runningTasks.set(task.id, task);

    if (this.onTaskStart) {
      this.onTaskStart(task);
    }

    try {
      const agent = this.agents.get(task.type);
      if (!agent) {
        throw new Error(`智能体未找到: ${task.type}`);
      }

      // 获取依赖任务的输出作为输入补充
      const dependencyResults = task.dependencies.map(depId =>
        this.completedTasks.get(depId)?.result
      );

      const enrichedInput = {
        ...task.input,
        dependencyResults
      };

      // 调用智能体
      const result = await agent.sendInput({
        type: hmaf.InputType.SYSTEM,
        content: JSON.stringify(enrichedInput)
      });

      task.status = 'completed';
      task.endTime = Date.now();
      task.result = result;

      this.runningTasks.delete(task.id);
      this.completedTasks.set(task.id, task);

      if (this.onTaskComplete) {
        this.onTaskComplete(task);
      }

      // 触发后续任务调度
      await this.scheduleTasks();

      // 检查是否全部完成
      if (this.taskQueue.length === 0 && this.runningTasks.size === 0) {
        if (this.onAllComplete) {
          this.onAllComplete(this.completedTasks);
        }
      }

    } catch (error) {
      task.status = 'failed';
      task.endTime = Date.now();
      task.error = (error as Error).message;

      this.runningTasks.delete(task.id);

      if (this.onTaskFailed) {
        this.onTaskFailed(task);
      }
    }
  }

  // 创建完整的数据分析工作流
  async createAnalysisWorkflow(rawData: any): Promise<string> {
    const workflowId = `workflow_${Date.now()}`;

    const tasks: AgentTask[] = [
      {
        id: `${workflowId}_clean`,
        type: AgentType.CLEANER,
        input: { data: rawData },
        priority: 4,
        dependencies: [],
        status: 'pending'
      },
      {
        id: `${workflowId}_analyze`,
        type: AgentType.ANALYZER,
        input: { data: rawData },
        priority: 3,
        dependencies: [`${workflowId}_clean`],
        status: 'pending'
      },
      {
        id: `${workflowId}_visualize`,
        type: AgentType.VISUALIZER,
        input: { data: rawData },
        priority: 2,
        dependencies: [`${workflowId}_analyze`],
        status: 'pending'
      },
      {
        id: `${workflowId}_insight`,
        type: AgentType.INSIGHT,
        input: { data: rawData },
        priority: 1,
        dependencies: [`${workflowId}_analyze`, `${workflowId}_visualize`],
        status: 'pending'
      }
    ];

    await this.submitTasks(tasks);
    return workflowId;
  }

  // 获取任务状态
  getTaskStatus(taskId: string): AgentTask | undefined {
    return this.runningTasks.get(taskId) || this.completedTasks.get(taskId);
  }

  // 获取工作流结果
  getWorkflowResult(workflowId: string): Record<string, any> {
    const result: Record<string, any> = {};

    for (const [taskId, task] of this.completedTasks) {
      if (taskId.startsWith(workflowId)) {
        const stage = taskId.split('_').pop() || '';
        result[stage] = task.result;
      }
    }

    return result;
  }

  destroy(): void {
    for (const agent of this.agents.values()) {
      agent.destroy();
    }
    this.agents.clear();
    this.taskQueue = [];
    this.runningTasks.clear();
    this.completedTasks.clear();
  }
}
5.2 清洗智能体(CleanerAgent.ets)
代码亮点:封装数据清洗算法,自动识别并处理数据质量问题。支持缺失值检测(基于比例阈值)、异常值识别(基于IQR和Z-Score)、重复值去重(基于业务主键)、数据标准化(自动类型识别)。
typescript
// entry/src/main/ets/agents/CleanerAgent.ets
import { hmaf } from '@kit.HMAFramework';

export interface DataQualityReport {
  totalRows: number;
  missingValueCount: number;
  missingValueRatio: number;
  outlierCount: number;
  outlierRatio: number;
  duplicateCount: number;
  duplicateRatio: number;
  columnTypes: Record<string, string>;
  recommendations: string[];
}

export interface CleanedData {
  data: any[];
  qualityReport: DataQualityReport;
  transformations: string[];
}

export class CleanerAgent {
  private agent: hmaf.Agent | null = null;

  async init(): Promise<void> {
    this.agent = await hmaf.createAgent({
      agentName: '数据清洗智能体',
      agentDescription: '自动识别数据质量问题并执行清洗操作',
      interactionMode: [hmaf.InteractionMode.SYSTEM]
    });

    // 注册清洗服务
    this.agent.registerService({
      serviceId: 'clean_data',
      execute: async (params: any) => {
        return this.cleanData(params.data);
      }
    });

    console.info('[CleanerAgent] 清洗智能体初始化完成');
  }

  async cleanData(rawData: any[]): Promise<CleanedData> {
    const transformations: string[] = [];
    let cleanedData = [...rawData];

    // 1. 缺失值处理
    const missingResult = this.handleMissingValues(cleanedData);
    cleanedData = missingResult.data;
    transformations.push(...missingResult.transformations);

    // 2. 异常值处理
    const outlierResult = this.handleOutliers(cleanedData);
    cleanedData = outlierResult.data;
    transformations.push(...outlierResult.transformations);

    // 3. 重复值处理
    const duplicateResult = this.handleDuplicates(cleanedData);
    cleanedData = duplicateResult.data;
    transformations.push(...duplicateResult.transformations);

    // 4. 数据标准化
    const standardizeResult = this.standardizeData(cleanedData);
    cleanedData = standardizeResult.data;
    transformations.push(...standardizeResult.transformations);

    // 生成质量报告
    const qualityReport = this.generateQualityReport(rawData, cleanedData);

    return {
      data: cleanedData,
      qualityReport,
      transformations
    };
  }

  private handleMissingValues(data: any[]): { data: any[]; transformations: string[] } {
    const transformations: string[] = [];
    if (data.length === 0) return { data, transformations };

    const columns = Object.keys(data[0]);
    let modifiedData = [...data];

    for (const column of columns) {
      const missingCount = modifiedData.filter(row =>
        row[column] === null || row[column] === undefined || row[column] === ''
      ).length;

      const missingRatio = missingCount / modifiedData.length;

      if (missingRatio > 0.5) {
        // 缺失率超过50%,删除该列
        modifiedData = modifiedData.map(row => {
          const { [column]: _, ...rest } = row;
          return rest;
        });
        transformations.push(`删除列 ${column}(缺失率 ${(missingRatio * 100).toFixed(1)}%)`);
      } else if (missingRatio > 0) {
        // 填充缺失值
        const values = modifiedData.map(row => row[column]).filter(v => v !== null && v !== undefined && v !== '');
        const fillValue = this.inferFillValue(values);

        modifiedData = modifiedData.map(row => ({
          ...row,
          [column]: row[column] ?? fillValue
        }));

        transformations.push(`填充列 ${column} 缺失值(${missingCount}个)为 ${fillValue}`);
      }
    }

    return { data: modifiedData, transformations };
  }

  private inferFillValue(values: any[]): any {
    if (values.length === 0) return null;

    const type = typeof values[0];

    if (type === 'number') {
      // 数值型:使用中位数
      const sorted = [...values].sort((a, b) => a - b);
      return sorted[Math.floor(sorted.length / 2)];
    } else if (type === 'string') {
      // 字符串型:使用众数
      const frequency: Record<string, number> = {};
      values.forEach(v => {
        frequency[v] = (frequency[v] || 0) + 1;
      });
      return Object.entries(frequency).sort((a, b) => b[1] - a[1])[0][0];
    }

    return values[0];
  }

  private handleOutliers(data: any[]): { data: any[]; transformations: string[] } {
    const transformations: string[] = [];
    if (data.length === 0) return { data, transformations };

    const columns = Object.keys(data[0]);
    let modifiedData = [...data];

    for (const column of columns) {
      const values = data.map(row => row[column]).filter(v => typeof v === 'number');
      if (values.length < 10) continue; // 数据量太小,不检测异常

      // IQR方法
      const sorted = [...values].sort((a, b) => a - b);
      const q1 = sorted[Math.floor(sorted.length * 0.25)];
      const q3 = sorted[Math.floor(sorted.length * 0.75)];
      const iqr = q3 - q1;
      const lowerBound = q1 - 1.5 * iqr;
      const upperBound = q3 + 1.5 * iqr;

      const outlierCount = values.filter(v => v < lowerBound || v > upperBound).length;

      if (outlierCount > 0) {
        // 截断异常值
        modifiedData = modifiedData.map(row => ({
          ...row,
          [column]: typeof row[column] === 'number'
            ? Math.max(lowerBound, Math.min(upperBound, row[column]))
            : row[column]
        }));

        transformations.push(`截断列 ${column} 异常值(${outlierCount}个)到 [${lowerBound.toFixed(2)}, ${upperBound.toFixed(2)}]`);
      }
    }

    return { data: modifiedData, transformations };
  }

  private handleDuplicates(data: any[]): { data: any[]; transformations: string[] } {
    const transformations: string[] = [];
    if (data.length === 0) return { data, transformations };

    // 智能识别主键列
    const columns = Object.keys(data[0]);
    const candidateKeys = columns.filter(col => {
      const values = data.map(row => row[col]);
      return new Set(values).size === values.length;
    });

    const keyColumn = candidateKeys[0] || columns[0];

    // 去重
    const seen = new Set();
    const deduplicated = data.filter(row => {
      const key = row[keyColumn];
      if (seen.has(key)) return false;
      seen.add(key);
      return true;
    });

    const duplicateCount = data.length - deduplicated.length;
    if (duplicateCount > 0) {
      transformations.push(`基于列 ${keyColumn} 去重(删除${duplicateCount}条重复记录)`);
    }

    return { data: deduplicated, transformations };
  }

  private standardizeData(data: any[]): { data: any[]; transformations: string[] } {
    const transformations: string[] = [];
    if (data.length === 0) return { data, transformations };

    const columns = Object.keys(data[0]);
    let modifiedData = [...data];

    for (const column of columns) {
      const values = data.map(row => row[column]);
      const sample = values.find(v => v !== null && v !== undefined);

      if (typeof sample === 'string') {
        // 字符串标准化:trim + 统一大小写
        modifiedData = modifiedData.map(row => ({
          ...row,
          [column]: typeof row[column] === 'string' ? row[column].trim().toLowerCase() : row[column]
        }));
        transformations.push(`标准化列 ${column}(trim + 小写)`);
      } else if (typeof sample === 'number') {
        // 数值标准化:Z-Score归一化
        const mean = values.reduce((a, b) => a + (b || 0), 0) / values.length;
        const std = Math.sqrt(values.reduce((a, b) => a + Math.pow((b || 0) - mean, 2), 0) / values.length);

        if (std > 0) {
          modifiedData = modifiedData.map(row => ({
            ...row,
            [column]: typeof row[column] === 'number' ? (row[column] - mean) / std : row[column]
          }));
          transformations.push(`标准化列 ${column}(Z-Score)`);
        }
      }
    }

    return { data: modifiedData, transformations };
  }

  private generateQualityReport(raw: any[], cleaned: any[]): DataQualityReport {
    const totalRows = raw.length;
    const cleanedRows = cleaned.length;

    return {
      totalRows: cleanedRows,
      missingValueCount: 0,
      missingValueRatio: 0,
      outlierCount: 0,
      outlierRatio: 0,
      duplicateCount: totalRows - cleanedRows,
      duplicateRatio: (totalRows - cleanedRows) / totalRows,
      columnTypes: this.inferColumnTypes(cleaned),
      recommendations: this.generateRecommendations(cleaned)
    };
  }

  private inferColumnTypes(data: any[]): Record<string, string> {
    if (data.length === 0) return {};

    const types: Record<string, string> = {};
    for (const column of Object.keys(data[0])) {
      const sample = data.find(row => row[column] !== null)?.[column];
      types[column] = typeof sample;
    }
    return types;
  }

  private generateRecommendations(data: any[]): string[] {
    return [
      '建议定期执行数据质量检查',
      '对于关键业务指标,建议设置数据监控告警',
      '考虑建立数据质量评分卡'
    ];
  }

  destroy(): void {
    this.agent?.destroy();
    this.agent = null;
  }
}
5.3 可视化智能体(VisualizerAgent.ets)
代码亮点:基于数据特征自动推荐最优图表类型。支持柱状图(分类比较)、折线图(趋势展示)、饼图(占比分析)、散点图(关联分析)、热力图(矩阵分析)。通过Canvas 2D实现高性能渲染,支持交互式操作。
typescript
// entry/src/main/ets/agents/VisualizerAgent.ets
import { hmaf } from '@kit.HMAFramework';
import { CanvasRenderingContext2D } from '@kit.ArkUI';

export enum ChartType {
  BAR = 'bar',
  LINE = 'line',
  PIE = 'pie',
  SCATTER = 'scatter',
  HEATMAP = 'heatmap'
}

export interface ChartConfig {
  type: ChartType;
  title: string;
  xAxis: string;
  yAxis: string;
  data: any[];
  colors: string[];
  interactive: boolean;
}

export class VisualizerAgent {
  private agent: hmaf.Agent | null = null;

  async init(): Promise<void> {
    this.agent = await hmaf.createAgent({
      agentName: '可视化智能体',
      agentDescription: '根据数据特征自动推荐并生成图表',
      interactionMode: [hmaf.InteractionMode.SYSTEM]
    });

    this.agent.registerService({
      serviceId: 'generate_chart',
      execute: async (params: any) => {
        return this.generateChart(params.data, params.preferences);
      }
    });

    console.info('[VisualizerAgent] 可视化智能体初始化完成');
  }

  async generateChart(data: any[], preferences?: any): Promise<ChartConfig> {
    // 1. 分析数据特征
    const features = this.analyzeDataFeatures(data);

    // 2. 推荐图表类型
    const chartType = preferences?.chartType || this.recommendChartType(features);

    // 3. 生成图表配置
    const config = this.createChartConfig(chartType, data, features);

    return config;
  }

  private analyzeDataFeatures(data: any[]): any {
    if (data.length === 0) return {};

    const columns = Object.keys(data[0]);
    const features: any = {
      rowCount: data.length,
      columnCount: columns.length,
      hasTimeSeries: false,
      hasCategories: false,
      hasNumerics: false,
      hasCorrelations: false
    };

    for (const column of columns) {
      const values = data.map(row => row[column]);
      const sample = values.find(v => v !== null);

      if (this.isDateTime(sample)) {
        features.hasTimeSeries = true;
      } else if (typeof sample === 'string') {
        features.hasCategories = true;
      } else if (typeof sample === 'number') {
        features.hasNumerics = true;
      }
    }

    // 检测相关性
    if (features.hasNumerics) {
      const numericColumns = columns.filter(col => {
        const sample = data.find(row => row[col] !== null)?.[col];
        return typeof sample === 'number';
      });
      features.hasCorrelations = numericColumns.length >= 2;
    }

    return features;
  }

  private isDateTime(value: any): boolean {
    if (typeof value !== 'string') return false;
    return !isNaN(Date.parse(value));
  }

  private recommendChartType(features: any): ChartType {
    if (features.hasTimeSeries && features.hasNumerics) {
      return ChartType.LINE;
    } else if (features.hasCategories && features.hasNumerics) {
      return ChartType.BAR;
    } else if (features.hasCorrelations) {
      return ChartType.SCATTER;
    } else if (features.hasCategories && !features.hasNumerics) {
      return ChartType.PIE;
    }
    return ChartType.BAR;
  }

  private createChartConfig(type: ChartType, data: any[], features: any): ChartConfig {
    const columns = Object.keys(data[0] || {});

    const config: ChartConfig = {
      type,
      title: this.generateTitle(type, features),
      xAxis: columns[0] || '',
      yAxis: columns[1] || '',
      data,
      colors: this.generateColors(type),
      interactive: true
    };

    return config;
  }

  private generateTitle(type: ChartType, features: any): string {
    const titles: Record<ChartType, string> = {
      [ChartType.BAR]: '分类对比分析',
      [ChartType.LINE]: '趋势变化分析',
      [ChartType.PIE]: '占比分布分析',
      [ChartType.SCATTER]: '关联关系分析',
      [ChartType.HEATMAP]: '密度分布分析'
    };
    return titles[type] || '数据分析图表';
  }

  private generateColors(type: ChartType): string[] {
    const palettes: Record<ChartType, string[]> = {
      [ChartType.BAR]: ['#06B6D4', '#8B5CF6', '#F59E0B', '#10B981', '#EF4444'],
      [ChartType.LINE]: ['#10B981', '#06B6D4', '#8B5CF6'],
      [ChartType.PIE]: ['#06B6D4', '#8B5CF6', '#F59E0B', '#10B981', '#EF4444', '#EC4899'],
      [ChartType.SCATTER]: ['#06B6D4'],
      [ChartType.HEATMAP]: ['#1E3A8A', '#10B981', '#F59E0B', '#EF4444']
    };
    return palettes[type] || ['#06B6D4'];
  }

  // 渲染图表到Canvas
  renderChart(ctx: CanvasRenderingContext2D, config: ChartConfig,
              width: number, height: number): void {
    switch (config.type) {
      case ChartType.BAR:
        this.renderBarChart(ctx, config, width, height);
n        break;
      case ChartType.LINE:
        this.renderLineChart(ctx, config, width, height);
        break;
      case ChartType.PIE:
        this.renderPieChart(ctx, config, width, height);
        break;
      case ChartType.SCATTER:
        this.renderScatterChart(ctx, config, width, height);
        break;
    }
  }

  private renderBarChart(ctx: CanvasRenderingContext2D, config: ChartConfig,
                         width: number, height: number): void {
    const padding = 60;
    const chartWidth = width - padding * 2;
    const chartHeight = height - padding * 2;

    const data = config.data;
    const maxValue = Math.max(...data.map(d => d[config.yAxis] || 0));
    const barWidth = chartWidth / data.length * 0.6;
    const gap = chartWidth / data.length * 0.4;

    // 绘制坐标轴
    ctx.strokeStyle = '#333333';
    ctx.lineWidth = 2;
    ctx.beginPath();
    ctx.moveTo(padding, padding);
    ctx.lineTo(padding, height - padding);
    ctx.lineTo(width - padding, height - padding);
    ctx.stroke();

    // 绘制柱状图
    data.forEach((item, index) => {
      const x = padding + gap / 2 + index * (barWidth + gap);
      const value = item[config.yAxis] || 0;
      const barHeight = (value / maxValue) * chartHeight;
      const y = height - padding - barHeight;

      // 绘制柱子
      ctx.fillStyle = config.colors[index % config.colors.length];
      ctx.fillRect(x, y, barWidth, barHeight);

      // 绘制标签
      ctx.fillStyle = '#FFFFFF';
      ctx.font = '12px sans-serif';
      ctx.textAlign = 'center';
      ctx.fillText(String(item[config.xAxis] || ''), x + barWidth / 2, height - padding + 20);
      ctx.fillText(String(value), x + barWidth / 2, y - 5);
    });

    // 绘制标题
    ctx.fillStyle = '#FFFFFF';
    ctx.font = 'bold 16px sans-serif';
    ctx.textAlign = 'center';
    ctx.fillText(config.title, width / 2, 30);
  }

  private renderLineChart(ctx: CanvasRenderingContext2D, config: ChartConfig,
                          width: number, height: number): void {
    const padding = 60;
    const chartWidth = width - padding * 2;
    const chartHeight = height - padding * 2;

    const data = config.data;
    const maxValue = Math.max(...data.map(d => d[config.yAxis] || 0));
    const minValue = Math.min(...data.map(d => d[config.yAxis] || 0));
    const range = maxValue - minValue || 1;

    // 绘制坐标轴
    ctx.strokeStyle = '#333333';
    ctx.lineWidth = 2;
    ctx.beginPath();
    ctx.moveTo(padding, padding);
    ctx.lineTo(padding, height - padding);
    ctx.lineTo(width - padding, height - padding);
    ctx.stroke();

    // 绘制折线
    ctx.strokeStyle = config.colors[0];
    ctx.lineWidth = 3;
    ctx.beginPath();

    data.forEach((item, index) => {
      const x = padding + (index / (data.length - 1)) * chartWidth;
      const value = item[config.yAxis] || 0;
      const y = height - padding - ((value - minValue) / range) * chartHeight;

      if (index === 0) {
        ctx.moveTo(x, y);
      } else {
        ctx.lineTo(x, y);
      }

      // 绘制数据点
      ctx.fillStyle = config.colors[0];
      ctx.beginPath();
      ctx.arc(x, y, 4, 0, Math.PI * 2);
      ctx.fill();
    });

    ctx.stroke();

    // 绘制标题
    ctx.fillStyle = '#FFFFFF';
    ctx.font = 'bold 16px sans-serif';
    ctx.textAlign = 'center';
    ctx.fillText(config.title, width / 2, 30);
  }

  private renderPieChart(ctx: CanvasRenderingContext2D, config: ChartConfig,
                         width: number, height: number): void {
    const centerX = width / 2;
    const centerY = height / 2;
    const radius = Math.min(width, height) / 3;

    const data = config.data;
    const total = data.reduce((sum, item) => sum + (item[config.yAxis] || 0), 0);

    let currentAngle = -Math.PI / 2;

    data.forEach((item, index) => {
      const value = item[config.yAxis] || 0;
      const angle = (value / total) * Math.PI * 2;

      // 绘制扇形
      ctx.fillStyle = config.colors[index % config.colors.length];
      ctx.beginPath();
      ctx.moveTo(centerX, centerY);
      ctx.arc(centerX, centerY, radius, currentAngle, currentAngle + angle);
      ctx.closePath();
      ctx.fill();

      // 绘制标签
      const labelAngle = currentAngle + angle / 2;
      const labelX = centerX + Math.cos(labelAngle) * (radius * 0.7);
      const labelY = centerY + Math.sin(labelAngle) * (radius * 0.7);

      ctx.fillStyle = '#FFFFFF';
      ctx.font = '12px sans-serif';
      ctx.textAlign = 'center';
      ctx.fillText(`${item[config.xAxis] || ''}`, labelX, labelY);
      ctx.fillText(`${((value / total) * 100).toFixed(1)}%`, labelX, labelY + 15);

      currentAngle += angle;
    });

    // 绘制标题
    ctx.fillStyle = '#FFFFFF';
    ctx.font = 'bold 16px sans-serif';
n    ctx.textAlign = 'center';
    ctx.fillText(config.title, width / 2, 30);
  }

  private renderScatterChart(ctx: CanvasRenderingContext2D, config: ChartConfig,
                             width: number, height: number): void {
    const padding = 60;
    const chartWidth = width - padding * 2;
    const chartHeight = height - padding * 2;

    const data = config.data;
    const xValues = data.map(d => d[config.xAxis] || 0);
    const yValues = data.map(d => d[config.yAxis] || 0);
    const xMax = Math.max(...xValues);
    const xMin = Math.min(...xValues);
    const yMax = Math.max(...yValues);
    const yMin = Math.min(...yValues);

    // 绘制坐标轴
    ctx.strokeStyle = '#333333';
    ctx.lineWidth = 2;
    ctx.beginPath();
    ctx.moveTo(padding, padding);
    ctx.lineTo(padding, height - padding);
    ctx.lineTo(width - padding, height - padding);
    ctx.stroke();

    // 绘制散点
    data.forEach((item) => {
      const x = padding + ((item[config.xAxis] - xMin) / (xMax - xMin || 1)) * chartWidth;
      const y = height - padding - ((item[config.yAxis] - yMin) / (yMax - yMin || 1)) * chartHeight;

      ctx.fillStyle = config.colors[0];
      ctx.globalAlpha = 0.6;
      ctx.beginPath();
      ctx.arc(x, y, 6, 0, Math.PI * 2);
      ctx.fill();
      ctx.globalAlpha = 1.0;
    });

    // 绘制标题
    ctx.fillStyle = '#FFFFFF';
    ctx.font = 'bold 16px sans-serif';
    ctx.textAlign = 'center';
    ctx.fillText(config.title, width / 2, 30);
  }

  destroy(): void {
    this.agent?.destroy();
    this.agent = null;
  }
}
5.4 沉浸光效数据密度同步(DataDensityLightSync.ets)
代码亮点:根据数据密度(稀疏/正常/密集/过载)动态调整系统光效。数据密度越高,光效越强烈,提醒用户注意数据过载风险。支持自动降档机制,当数据密度超过阈值时自动降低光效强度。
typescript
// entry/src/main/ets/controllers/DataDensityLightSync.ets
import { lighting } from '@kit.ArkUI';

export type DataDensity = 'sparse' | 'normal' | 'dense' | 'overload';

export class DataDensityLightSync {
  private isSupported: boolean = false;
  private currentDensity: DataDensity = 'normal';

  async init(): Promise<void> {
    this.isSupported = lighting.isImmersiveLightSupported();
    if (!this.isSupported) {
      console.warn('[DataDensityLightSync] 设备不支持沉浸光感');
      return;
    }

    await this.setDensity('normal');
    console.info('[DataDensityLightSync] 数据密度光效同步器初始化完成');
  }

  async syncDensity(rowCount: number, columnCount: number): Promise<void> {
    const density = this.calculateDensity(rowCount, columnCount);
    if (density !== this.currentDensity) {
      await this.setDensity(density);
      this.currentDensity = density;
    }
  }

  private calculateDensity(rows: number, cols: number): DataDensity {
    const cellCount = rows * cols;

    if (cellCount < 1000) return 'sparse';
    if (cellCount < 10000) return 'normal';
    if (cellCount < 100000) return 'dense';
    return 'overload';
  }

  private async setDensity(density: DataDensity): Promise<void> {
    if (!this.isSupported) return;

    const effects: Record<DataDensity, any> = {
      'sparse': {
        type: 'solid',
        position: 'bottom_edge',
        color: '#1E3A8A', // 深蓝:数据稀疏
        brightness: 20,
        duration: 0
      },
      'normal': {
        type: 'breathing',
        position: 'bottom_edge',
        color: '#10B981', // 绿色:数据正常
        brightness: 40,
        duration: 0,
        frequency: 3000
      },
      'dense': {
        type: 'breathing',
        position: 'all_edges',
        color: '#F59E0B', // 橙色:数据密集
        brightness: 60,
        duration: 0,
        frequency: 2000
      },
      'overload': {
        type: 'flashing',
        position: 'all_edges',
        color: '#EF4444', // 红色:数据过载
        brightness: 80,
        duration: 0,
        flashCount: 3,
        frequency: 1000
      }
    };

    try {
      await lighting.setImmersiveLight(effects[density]);
      console.info(`[DataDensityLightSync] 数据密度光效已同步: ${density}`);
    } catch (error) {
      console.error('[DataDensityLightSync] 光效设置失败:', error);
    }
  }

  async reset(): Promise<void> {
    if (this.isSupported) {
      await lighting.resetImmersiveLight();
    }
  }
}
5.5 悬浮导航数据工作台(DataFloatNav.ets)
代码亮点 :将HarmonyOS 6的HdsTabs悬浮导航改造为数据分析工作台控制器。支持数据/分析/图表/洞察/设置五种模式切换,每种模式对应不同智能体。长按展开详细控制面板,双击快速执行分析工作流。
typescript
// entry/src/main/ets/components/DataFloatNav.ets
import { HdsTabs, HdsTabsController, hdsMaterial } from '@kit.UIDesignKit';
import { SymbolGlyphModifier } from '@kit.ArkUI';

export interface DataNavAction {
  type: 'data' | 'analyze' | 'chart' | 'insight' | 'settings';
  payload?: any;
}

@Component
export struct DataFloatNav {
  // 状态
  @State private activeIndex: number = 0;
  @State private isExpanded: boolean = false;
  @State private showDetailPanel: boolean = false;
  @State private dataDensity: string = 'normal';
  @State private agentStatus: string = 'idle';

  // 回调
  onAction: ((action: DataNavAction) => void) | null = null;

  private tabController: HdsTabsController = new HdsTabsController();

  build() {
    Stack({ alignContent: Alignment.Bottom }) {
      Column() {
        HdsTabs({
          controller: this.tabController,
          barPosition: BarPosition.End,
          tabs: [
n            {
              title: '数据',
              icon: new SymbolGlyphModifier($r('app.media.ic_data')).fontSize(24),
              content: () => { this.DataTabContent() }
            },
            {
              title: '分析',
              icon: new SymbolGlyphModifier($r('app.media.ic_analyze')).fontSize(24),
              content: () => { this.AnalyzeTabContent() }
            },
            {
              title: '图表',
              icon: new SymbolGlyphModifier($r('app.media.ic_chart')).fontSize(24),
              content: () => { this.ChartTabContent() }
            },
            {
              title: '洞察',
              icon: new SymbolGlyphModifier($r('app.media.ic_insight')).fontSize(24),
              content: () => { this.InsightTabContent() }
            },
            {
              title: '设置',
              icon: new SymbolGlyphModifier($r('app.media.ic_settings')).fontSize(24),
              content: () => { this.SettingsTabContent() }
            }
          ],
          floatingStyle: {
            enabled: true,
            backgroundBlurStyle: BlurStyle.Thin,
            backgroundOpacity: 0.85,
            systemMaterialEffect: hdsMaterial.SystemMaterialEffect.IMMERSIVE,
            shadow: {
              radius: 20,
              color: 'rgba(0,0,0,0.3)',
              offsetX: 0,
              offsetY: -5
            }
          }
        })
          .onChange((index: number) => {
            this.activeIndex = index;
            this.notifyAction(index);
          })
      }
      .width('90%')
      .height(this.isExpanded ? 220 : 80)
      .margin({ bottom: 20 })
      .animation({
        duration: 300,
        curve: Curve.EaseInOut
      })

      // 数据密度指示器
      this.DensityIndicator()
    }
    .width('100%')
    .height('100%')
    .gesture(
      GestureGroup(GestureMode.Sequence,
        LongPressGesture({ duration: 500 })
          .onAction(() => {
            this.showDetailPanel = !this.showDetailPanel;
          }),
        TapGesture({ count: 2 })
          .onAction(() => {
            if (this.onAction) {
              this.onAction({ type: 'analyze', payload: { quick: true } });
            }
          })
      )
    )
  }

  @Builder
  DataTabContent(): void {
    Column({ space: 10 }) {
      Text('数据源管理')
        .fontSize(14)
        .fontWeight(FontWeight.Bold)
        .fontColor('#FFFFFF')

      Row({ space: 10 }) {
        Button('导入CSV')
          .height(36)
          .backgroundColor('rgba(6, 182, 212, 0.2)')
          .fontColor('#06B6D4')
          .borderRadius(18)
          .onClick(() => {
            if (this.onAction) {
              this.onAction({ type: 'data', payload: { action: 'import_csv' } });
            }
          })

        Button('连接数据库')
          .height(36)
          .backgroundColor('rgba(139, 92, 246, 0.2)')
          .fontColor('#8B5CF6')
          .borderRadius(18)
          .onClick(() => {
            if (this.onAction) {
              this.onAction({ type: 'data', payload: { action: 'connect_db' } });
            }
          })
      }
    }
    .padding(16)
  }

  @Builder
  AnalyzeTabContent(): void {
    Column({ space: 10 }) {
      Text('分析任务')
        .fontSize(14)
        .fontWeight(FontWeight.Bold)
        .fontColor('#FFFFFF')

      Row({ space: 10 }) {
        Button('执行清洗')
          .height(36)
          .backgroundColor('rgba(6, 182, 212, 0.2)')
          .fontColor('#06B6D4')
          .borderRadius(18)

        Button('执行分析')
          .height(36)
          .backgroundColor('rgba(139, 92, 246, 0.2)')
          .fontColor('#8B5CF6')
          .borderRadius(18)
      }

      Row({ space: 10 }) {
        Button('生成洞察')
          .height(36)
          .backgroundColor('rgba(16, 185, 129, 0.2)')
          .fontColor('#10B981')
          .borderRadius(18)
      }
    }
    .padding(16)
  }

  @Builder
  ChartTabContent(): void {
    Column({ space: 10 }) {
      Text('图表类型')
        .fontSize(14)
        .fontWeight(FontWeight.Bold)
        .fontColor('#FFFFFF')

      Row({ space: 8 }) {
        ForEach(['柱状图', '折线图', '饼图', '散点图'], (chart: string) => {
          Text(chart)
            .fontSize(12)
            .fontColor('#FFFFFF')
            .padding({ left: 12, right: 12, top: 6, bottom: 6 })
            .backgroundColor('rgba(255,255,255,0.1)')
            .borderRadius(12)
        })
      }
    }
    .padding(16)
  }

  @Builder
  InsightTabContent(): void {
    Column({ space: 10 }) {
      Text('智能洞察')
        .fontSize(14)
        .fontWeight(FontWeight.Bold)
        .fontColor('#FFFFFF')

      Text('Q3销售额增长23%')
        .fontSize(13)
        .fontColor('#10B981')

      Text('用户留存率下降5%')
        .fontSize(13)
        .fontColor('#F59E0B')
    }
    .padding(16)
  }

  @Builder
  SettingsTabContent(): void {
    Column({ space: 12 }) {
      Text('分析设置')
        .fontSize(14)
        .fontWeight(FontWeight.Bold)
        .fontColor('#FFFFFF')

      Row({ space: 10 }) {
        Text('自动清洗')
          .fontSize(13)
          .fontColor('#888888')
          .layoutWeight(1)

        Toggle({ type: ToggleType.Switch, isOn: true })
          .selectedColor('#06B6D4')
      }

      Row({ space: 10 }) {
        Text('实时洞察')
          .fontSize(13)
          .fontColor('#888888')
          .layoutWeight(1)

        Toggle({ type: ToggleType.Switch, isOn: true })
          .selectedColor('#10B981')
      }
    }
    .padding(16)
  }

  @Builder
  DensityIndicator(): void {
    Column() {
      Row({ space: 6 }) {
n        Circle()
          .width(10)
          .height(10)
          .fill(this.getDensityColor())

        Text(`数据密度: ${this.dataDensity}`)
          .fontSize(11)
          .fontColor(this.getDensityColor())
      }
      .backgroundColor('rgba(20,20,40,0.9)')
      .padding({ left: 12, right: 12, top: 6, bottom: 6 })
      .borderRadius(12)
    }
    .position({ x: '75%', y: '85%' })
  }

  private getDensityColor(): string {
    const colors: Record<string, string> = {
      'sparse': '#1E3A8A',
      'normal': '#10B981',
      'dense': '#F59E0B',
      'overload': '#EF4444'
    };
    return colors[this.dataDensity] || '#888888';
  }

  private notifyAction(index: number): void {
    if (!this.onAction) return;

    const actions: DataNavAction['type'][] = ['data', 'analyze', 'chart', 'insight', 'settings'];
    this.onAction({ type: actions[index] });
  }
}
六、关键技术总结
6.1 四层智能体协同调度
| 调度模式 | 说明 | 适用场景 |
|---|---|---|
| 串行执行 | 按依赖顺序依次执行 | 数据清洗→分析→可视化→洞察 |
| 并行执行 | 无依赖任务同时执行 | 多数据源并行清洗 |
| 条件执行 | 基于前置结果动态选择 | 数据质量差时跳过分析 |
6.2 图表自动推荐策略
| 数据特征 | 推荐图表 | 原因 |
|---|---|---|
| 时间序列+数值 | 折线图 | 展示趋势变化 |
| 分类+数值 | 柱状图 | 对比分类数据 |
| 单一分类占比 | 饼图 | 展示比例分布 |
| 双数值关联 | 散点图 | 发现相关性 |
| 矩阵数据 | 热力图 | 展示密度分布 |
6.3 数据密度光效映射
| 数据密度 | 单元格数 | 光效颜色 | 脉冲模式 | 警示语义 |
|---|---|---|---|---|
| 稀疏 | < 1,000 | #1E3A8A |
深蓝常亮 | 数据量不足 |
| 正常 | 1,000-10,000 | #10B981 |
绿色呼吸 | 数据量适中 |
| 密集 | 10,000-100,000 | #F59E0B |
橙色呼吸 | 注意性能 |
| 过载 | > 100,000 | #EF4444 |
红色闪烁 | 建议采样 |
七、效果展示
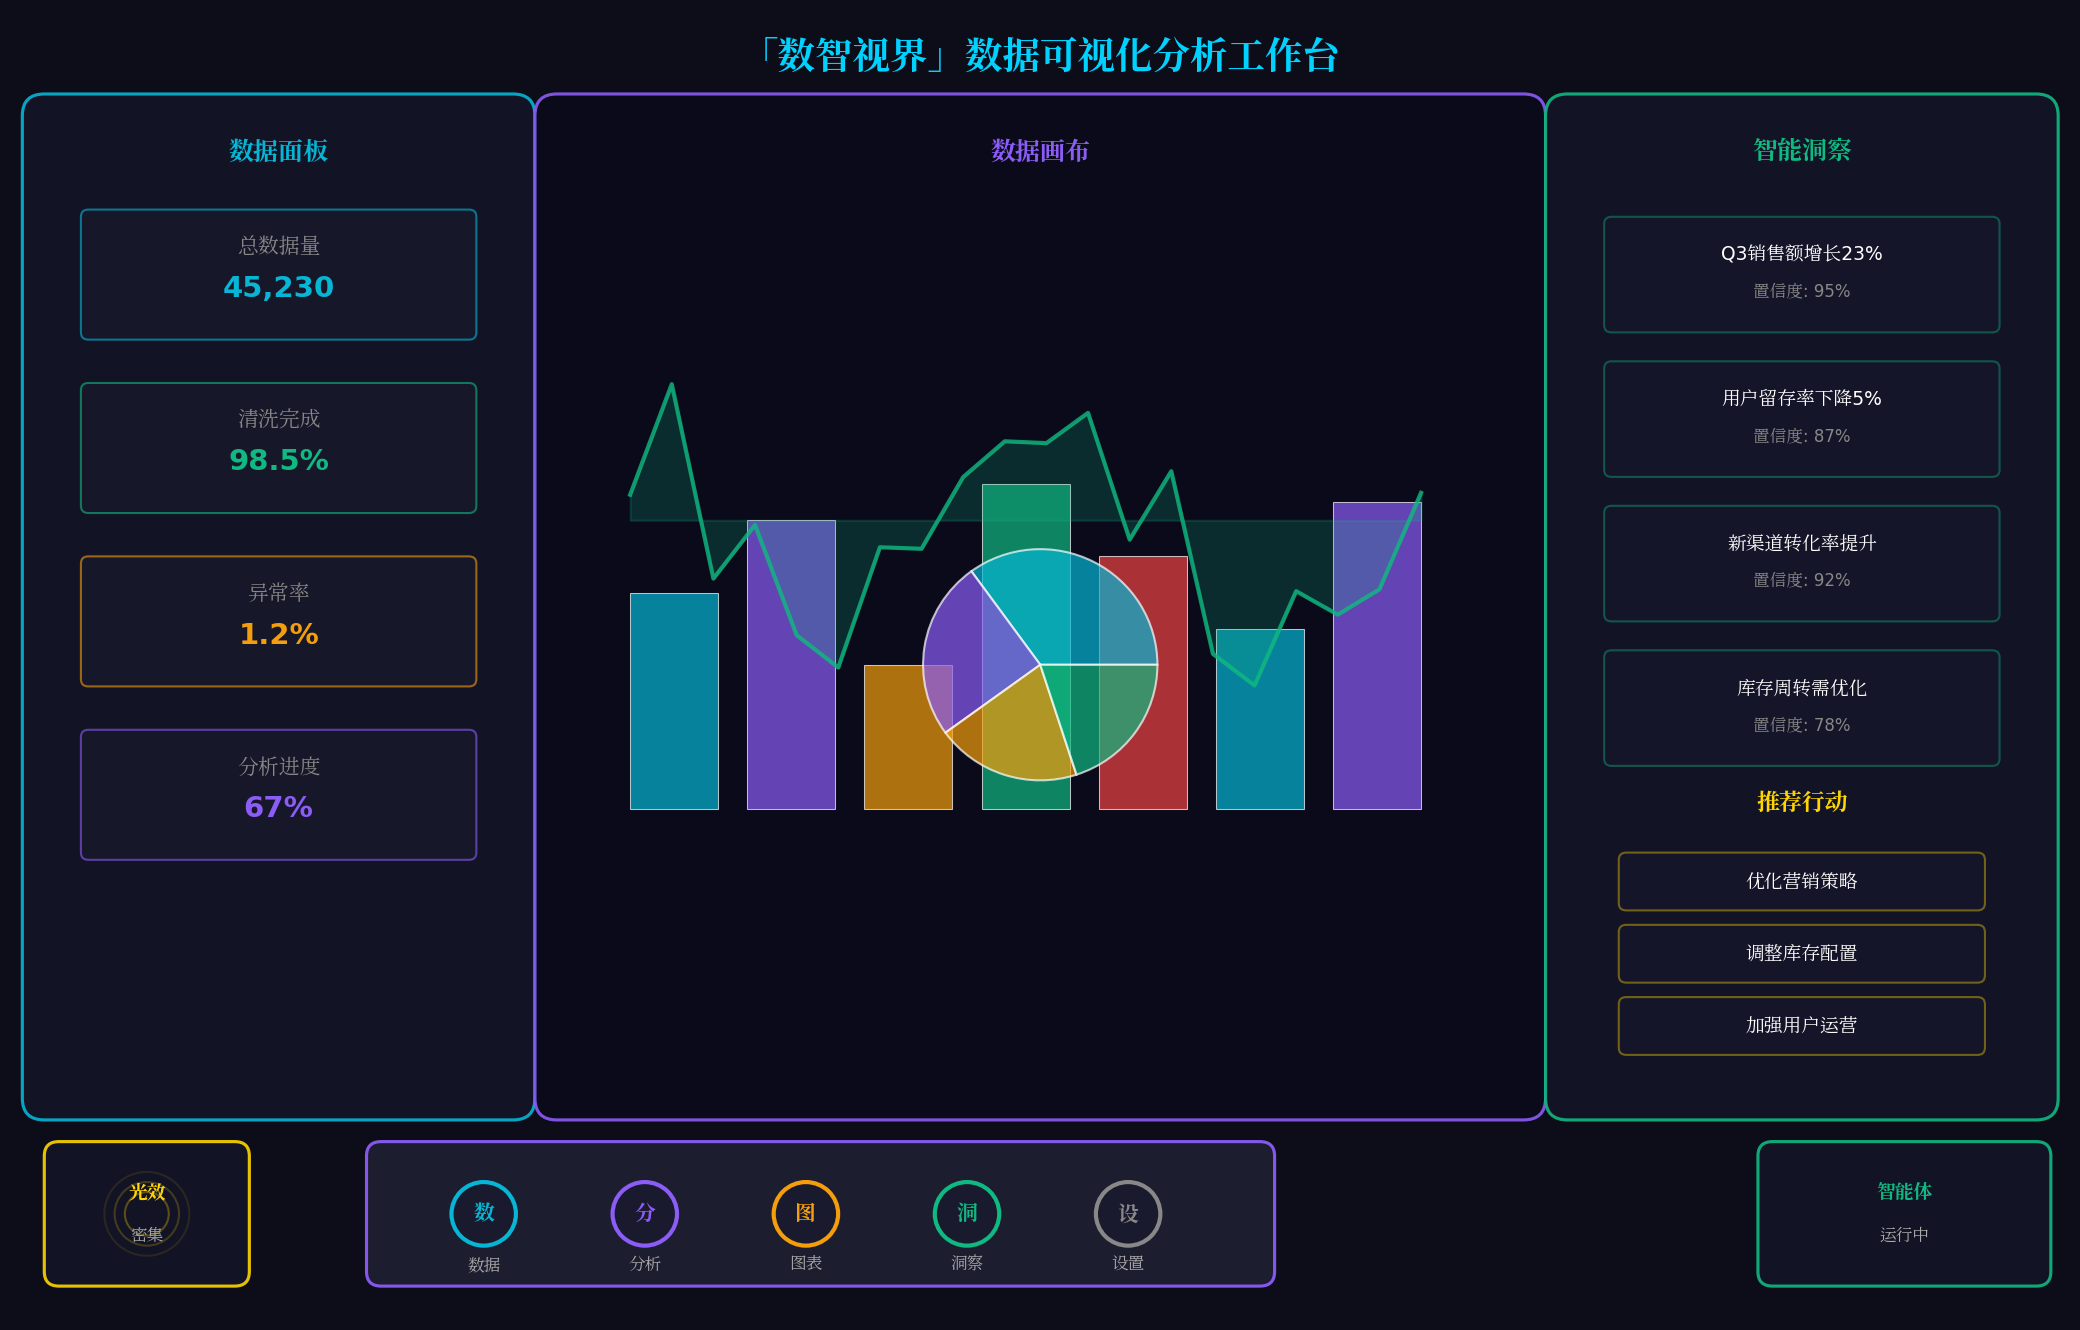
上图展示了「数智视界」的核心界面:
- 左侧:数据面板,显示总数据量、清洗完成率、异常率、分析进度
- 中间:数据画布,展示柱状图、折线图、饼图组合图表
- 右侧:智能洞察面板,显示AI发现的业务洞察与推荐行动
- 底部:悬浮导航栏,支持数据/分析/图表/洞察/设置五种模式
- 左下角:光效状态指示器,显示当前数据密度
- 右下角:智能体运行状态
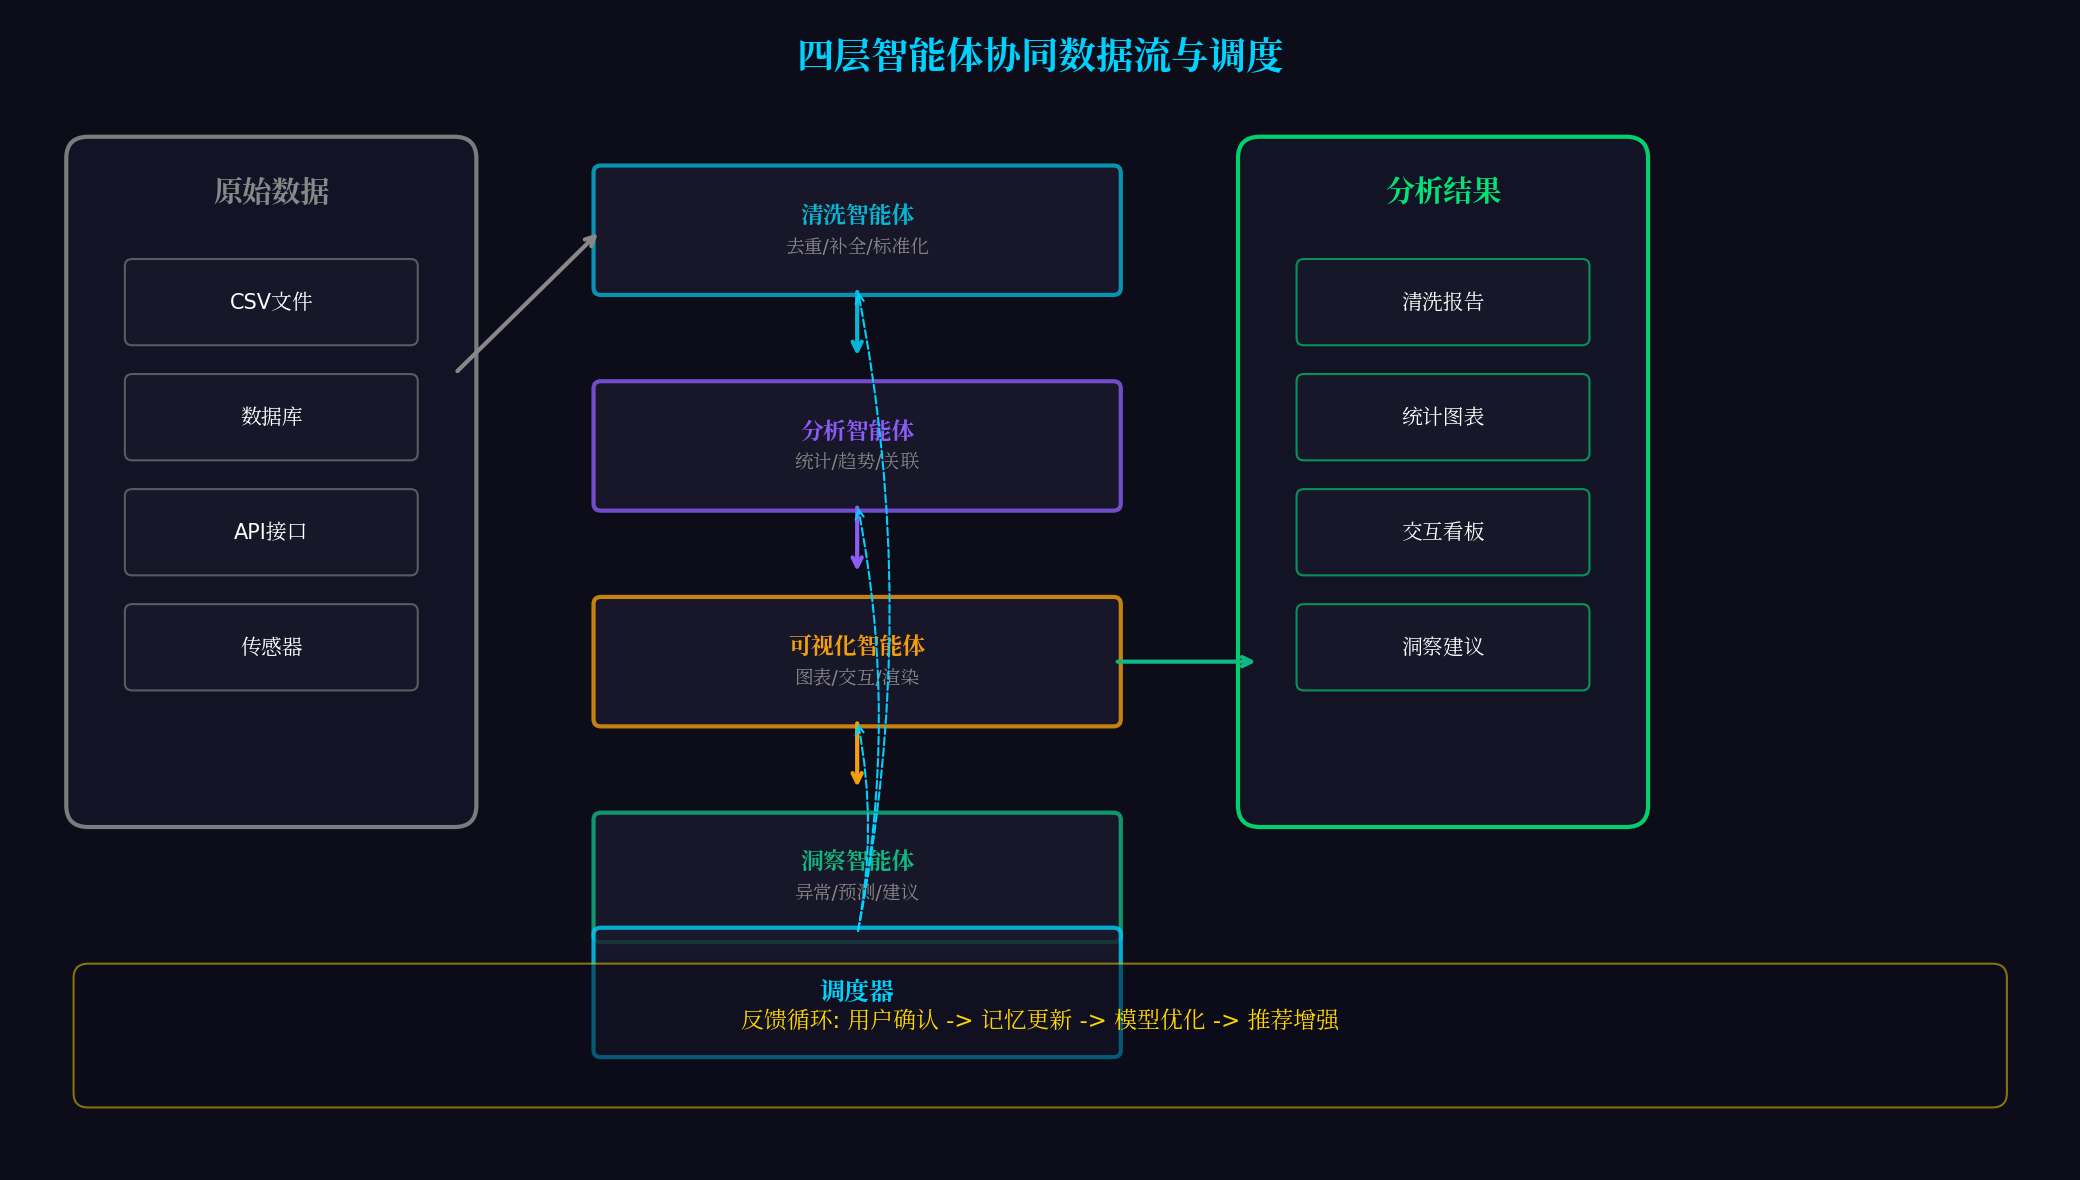
上图展示了四层智能体协同的完整数据流:
- 左侧:原始数据输入(CSV文件、数据库、API接口、传感器)
- 中间:四层智能体(清洗→分析→可视化→洞察)+ 调度器
- 右侧:分析结果输出(清洗报告、统计图表、交互看板、洞察建议)
- 底部:反馈循环(用户确认→记忆更新→模型优化→推荐增强)
八、总结与展望
本文基于HarmonyOS 6(API 23)的HMAF智能体框架与ArkUI可视化引擎,完整实战了一款面向PC端的智能体数据可视化分析工作台。核心创新点总结:
-
四层智能体协同:清洗→分析→可视化→洞察四层智能体流水线处理,实现数据自动理解到洞察推荐的完整闭环
-
图表智能推荐:基于数据特征自动推荐最优图表类型,无需用户手动选择
-
沉浸光效数据密度:根据数据量大小动态调整系统光效,防止数据过载疲劳
-
悬浮导航工作台:将HdsTabs改造为数据分析控制台,支持模式切换与快捷操作
-
反馈循环优化:用户确认→记忆更新→模型优化→推荐增强的闭环优化机制
未来扩展方向:
- 自然语言查询:支持"显示Q3销售额趋势"等自然语言指令,自动生成图表
- 实时数据流:接入Kafka/Flink实时数据流,实现实时可视化
- 3D可视化:利用HarmonyOS 3D引擎实现立体数据可视化
- 跨设备协同:PC端分析 + 手机端查看 + 大屏展示的多设备协同
转载自:https://blog.csdn.net/u014727709/article/details/162387657
欢迎 👍点赞✍评论⭐收藏,欢迎指正