绘制效果

代码说明
Mantel test 相关性热图的构造复刻自 R 语言代码:
- Houyun Huang(2021). linkET: Everything is Linkable. R package version 0.0.3.
我为我开发的 MATLAB 绘图工具 SHeatmap 添加了新的辅助函数 SMantelLink 使得 MATLAB 也能具备绘制这样图像的能力。因此想要绘制首先需要下载工具函数包,可在以下仓库获取:
- 【gitee】https://gitee.com/slandarer/matlab-special-heatmap
- 【github】https://github.com/slandarer/MATLAB-special-heatmap
- 【fileexchange】https://www.mathworks.com/matlabcentral/fileexchange/125520-special-heatmap
Mantel test
在给出绘图教程前,先给出 Mantel test 的原理和代码实现,这样大家可以在其他地方使用 Mantel test。
Mantel test 被用来检验两个距离矩阵的相关性,基本实现是:将两个矩阵下三角部分(不含对角线)拉成向量计算相关系数 r, 随机同时交换距离矩阵2的行列,之后将矩阵2下三角部分再次拉成长条,对两个列向量进行相关性检验,记录 r p r e m r_{prem} rprem 值,看有多少次因为交换行列导致 r p r e m r_{prem} rprem 值对比 r 值上升,计算上升次数/总次数作为 p 值,同时为了和主流计算保持一致(如 R 语言的 vegan 包),采用加 1 校正:
r 值越高说明相关性越强,p 值越低说明越显著。以下是 Mantel test 实现代码 mantel,工具包还有一个拿存储空间换运行速度的 mantelFast 函数,运行速度是下面这个函数的10倍,可以工具包里瞅瞅。
matlab
function [rho, pval, rperm] = mantel(dist1, dist2, varargin)
% MANTEL - Mantel test for matrix correlation
%   rho = mantel(dist1, dist2) performs Mantel test with 999 permutations
%   using Pearson correlation.
%
%   rho = mantel(dist1, dist2, nperm) specifies number of permutations.
%
%   rho = mantel(dist1, dist2, method) specifies correlation method
%         ('Pearson' or 'Spearman', default 'Pearson').
%
%   rho = mantel(dist1, dist2, nperm, method) sets both.
%
%   [rho, pval] = mantel(___) also returns the p-value (one-sided).
%
%   [rho, pval, rperm] = mantel(___) returns the permuted r values.

% References
% [1] Mantel N. The detection of disease clustering and a generalized regression approach.
%     Cancer Res. 1967 Feb;27(2):209-20. PMID: 6018555.
% [2] Borcard, D. & Legendre, P. (2012) Is the Mantel correlogram powerful enough to be
%     useful in ecological analysis? A simulation study. Ecology 93: 1473-1481.
% [3] Legendre, P. and Legendre, L. (2012) Numerical Ecology. 3rd English Edition. Elsevier.

% Parse input arguments
switch nargin
    case 2
        nperm = 999; method = 'Pearson';
    case 3
        if isnumeric(varargin{1})
            nperm = varargin{1}; method = 'Pearson';
        else
            nperm = 999; method = varargin{1};
        end
    case 4
        nperm = varargin{1}; method = varargin{2};
end
% Extract lower-triangular vectors
N = size(dist1, 1);
ind = tril(true(N), -1);
V1 = dist1(ind);
V2 = dist2(ind);
% Observed correlation
rho = corr(V1, V2, 'Type', method);
% Permutation test
rperm = zeros(nperm, 1);
for i = 1:nperm
    perm = randperm(N);
    dist2_perm = dist2(perm, perm);
    V2_perm = dist2_perm(ind);
    rperm(i) = corr(V1, V2_perm, 'Type', method);
end
% p-value (one-sided, positive correlation)
pval = (sum(rperm >= rho) + 1) / (nperm + 1);
end
以下说明该代码计算结果与 R 语言相同:
MATLAB 计算
matlab
rng(1)
X1 = rand([100, 20]);
X2 = rand([100, 5]);
writematrix(X1, 'X1.csv');
writematrix(X2, 'X2.csv');

D1 = squareform(pdist(X1));
D2 = squareform(pdist(X2));
[rho, pval] = mantel(D1, D2, 9999, 'Pearson')
计算得到:rho = 0.0438, pval = 0.0827
R 语言计算
r
dataX1 <- read.csv("X1.csv", header = FALSE, row.names = NULL)
dataX2 <- read.csv("X2.csv", header = FALSE, row.names = NULL)

D1 <- dist(dataX1)
D2 <- dist(dataX2)

result <- mantel(D1, D2, method = "pearson", permutations = 9999)
print(result)
计算得到:Mantel statistic r: 0.04375, Significance: 0.0828 , 计算结果相似。当然 Mantel test 具有随机性,建议加大随机置换次数并设置随机数种子。
mantelFast 函数就是把循环部分完全换成 MATLAB 矩阵运算:但是在数据量超过 2e8 时容易会内存不足:
matlab
% Permutation test
[~, perm] = sort(rand(N, nperm), 1);
[indR, indC] = find(tril(true(N), -1));
V2 = dist2(sub2ind([N, N], perm(indR, :), perm(indC, :)));
rperm = corr(V1, V2, 'Type', method);
Mantel test 相关性热图
数据准备
数据来源:
- Väre, H., Ohtonen, R. and Oksanen, J. (1995) Effects of reindeer grazing on understorey vegetation in dry Pinus sylvestris forests. Journal of Vegetation Science 6, 523--530.
matlab
%% Load data (加载数据)
load('lichenData.mat') % Load pre-saved data package (加载预存的数据包)
Data1 = varechem.Variables; % Environmental matrix (环境因子矩阵)
Data2 = varespec.Variables; % Species composition matrix (物种组成矩阵)
labels = varechem.Properties.VariableNames; % Environmental variable names (环境变量名称)
% Define species groups: 44 columns into 4 groups (将44个物种列分为4组)
groupName = {'Spec01', 'Spec02', 'Spec03', 'Spec04'};
group = zeros(1, size(Data2, 2));
group(1:7) = 1; % Group 1: columns 1-7 (第1组:列1-7)
group(8:18) = 2; % Group 2: columns 8-18 (第2组:列8-18)
group(19:37) = 3; % Group 3: columns 19-37 (第3组:列19-37)
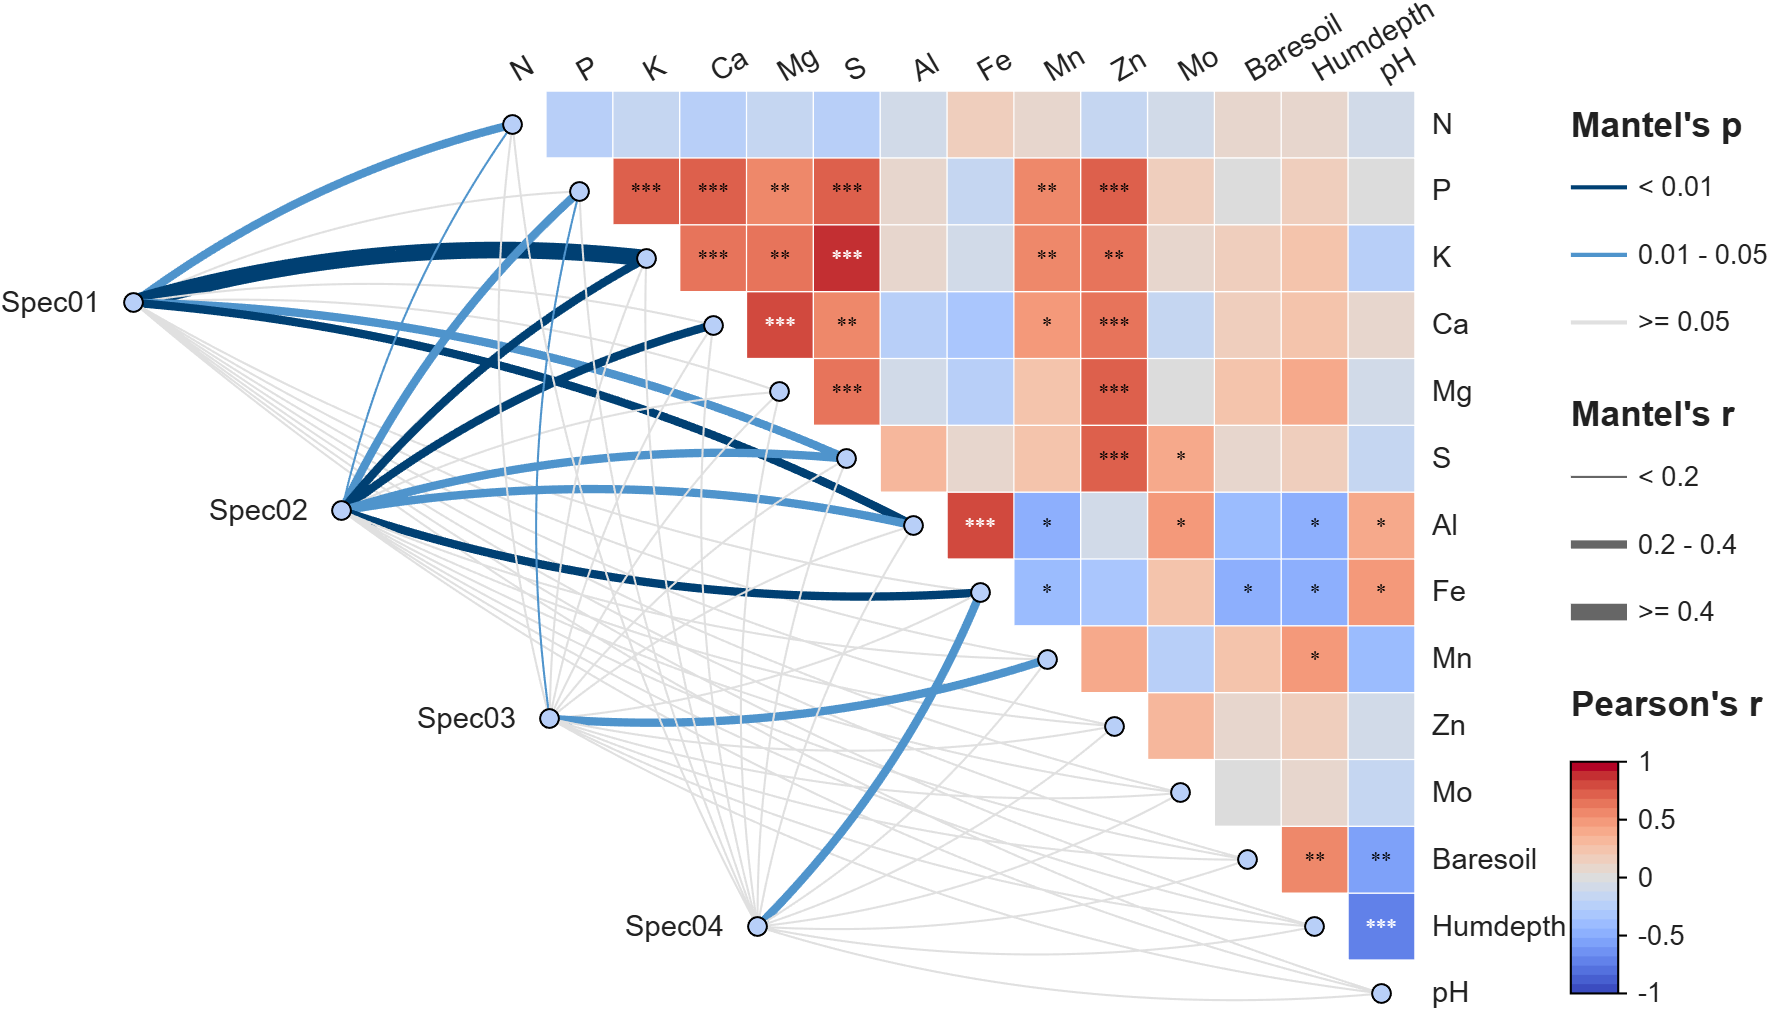
group(38:44) = 4; % Group 4: columns 38-44 (第4组:列38-44)热图绘制
matlab
ax = gca;

%% Draw heatmap
[rho, pval] = corr(Data1);
objHM = SHeatmap(ax, rho, 'Format','sq');
objHM.draw();

% Display significance stars: p < 0.05 *, p < 0.01 **, p < 0.001 ***
objHM.setText()
objHM.showStars(pval, 'Levels', [0.05, 0.01, 0.001], 'CorrLabel','off')

objHM.setVarName(labels)             % Set row/column labels (设置行列标签)
objHM.setType('tril0');              % Show only lower triangle without diagonal (仅显示下三角矩阵,不含对角线)
% Adjust label positions (调整标签位置)
objHM.setRowLabelLocation('left')
objHM.setColLabelLocation('bottom')
% Show all labels, including those that were previously hidden. (显示所有标签,包括被隐藏的标签)
objHM.setRowLabel('Visible','on')
objHM.setColLabel('Visible','on')
delete(objHM.Colorbar)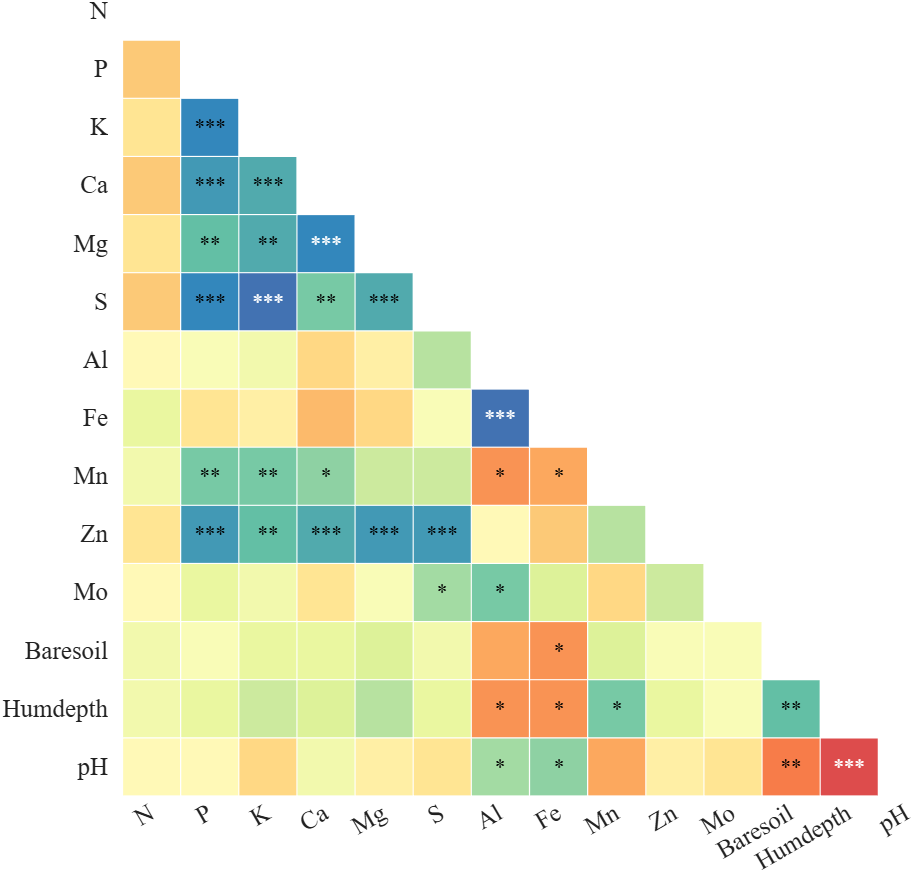
Mantel 链接绘制
matlab
% Create Mantel link object with env data, species data and groups (创建Mantel链接对象,传入环境数据、物种数据及分组信息)
objML = SMantelLink(ax, Data1, Data2, 'Group',group);
objML.GroupName = groupName;          % Set group names (设置组名)
objML.LegendLocation = 'west';        % Place legend on the left (图例置于左侧)
objML.Layout = 'triu';                % Links placed in upper triangle (链接采用上三角布局)
objML.draw()                          % Render the links (渲染链接图)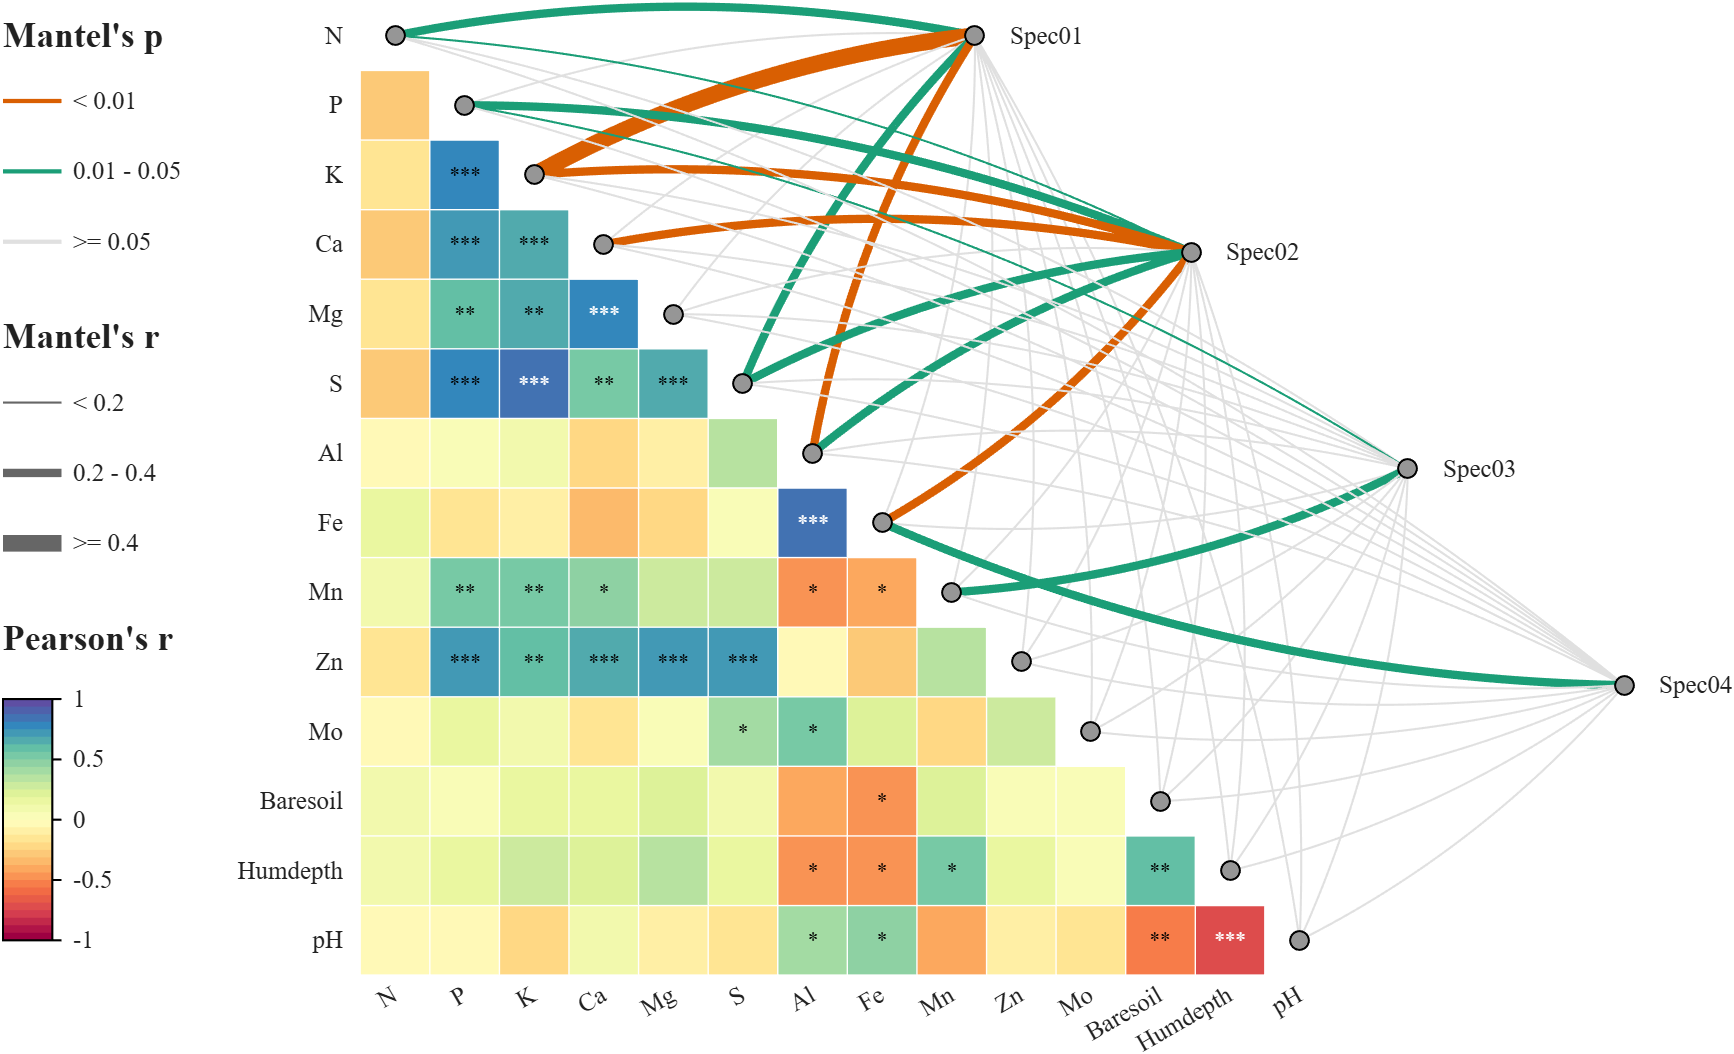
在 draw() 之前很多参数都可以设置,比如为了每次结果一致,建议提前设置随机数种子,且可以设置更大的置换次数:
matlab
rng(123456)
objML.NumPerm = 9999;
再比如计算距离矩阵的方式 (以下是默认计算方式),更多计算方式参见 MATLAB 官网 pdist 函数的文档,这里不赘述:
matlab
objML.Distance1 = 'euclidean';
objML.Distance2 = @(ZI, ZJ) sum(abs(ZI - ZJ), 2) ./ sum(ZI + ZJ, 2);
同时 Curvature 可以设置链接线的弯曲程度和方向,比如为负数就是反向弯曲,为0就是直线,LinkBendMode,可以设置为 simple,就是所有线弯曲方向一致:
objML.Curvature = 0;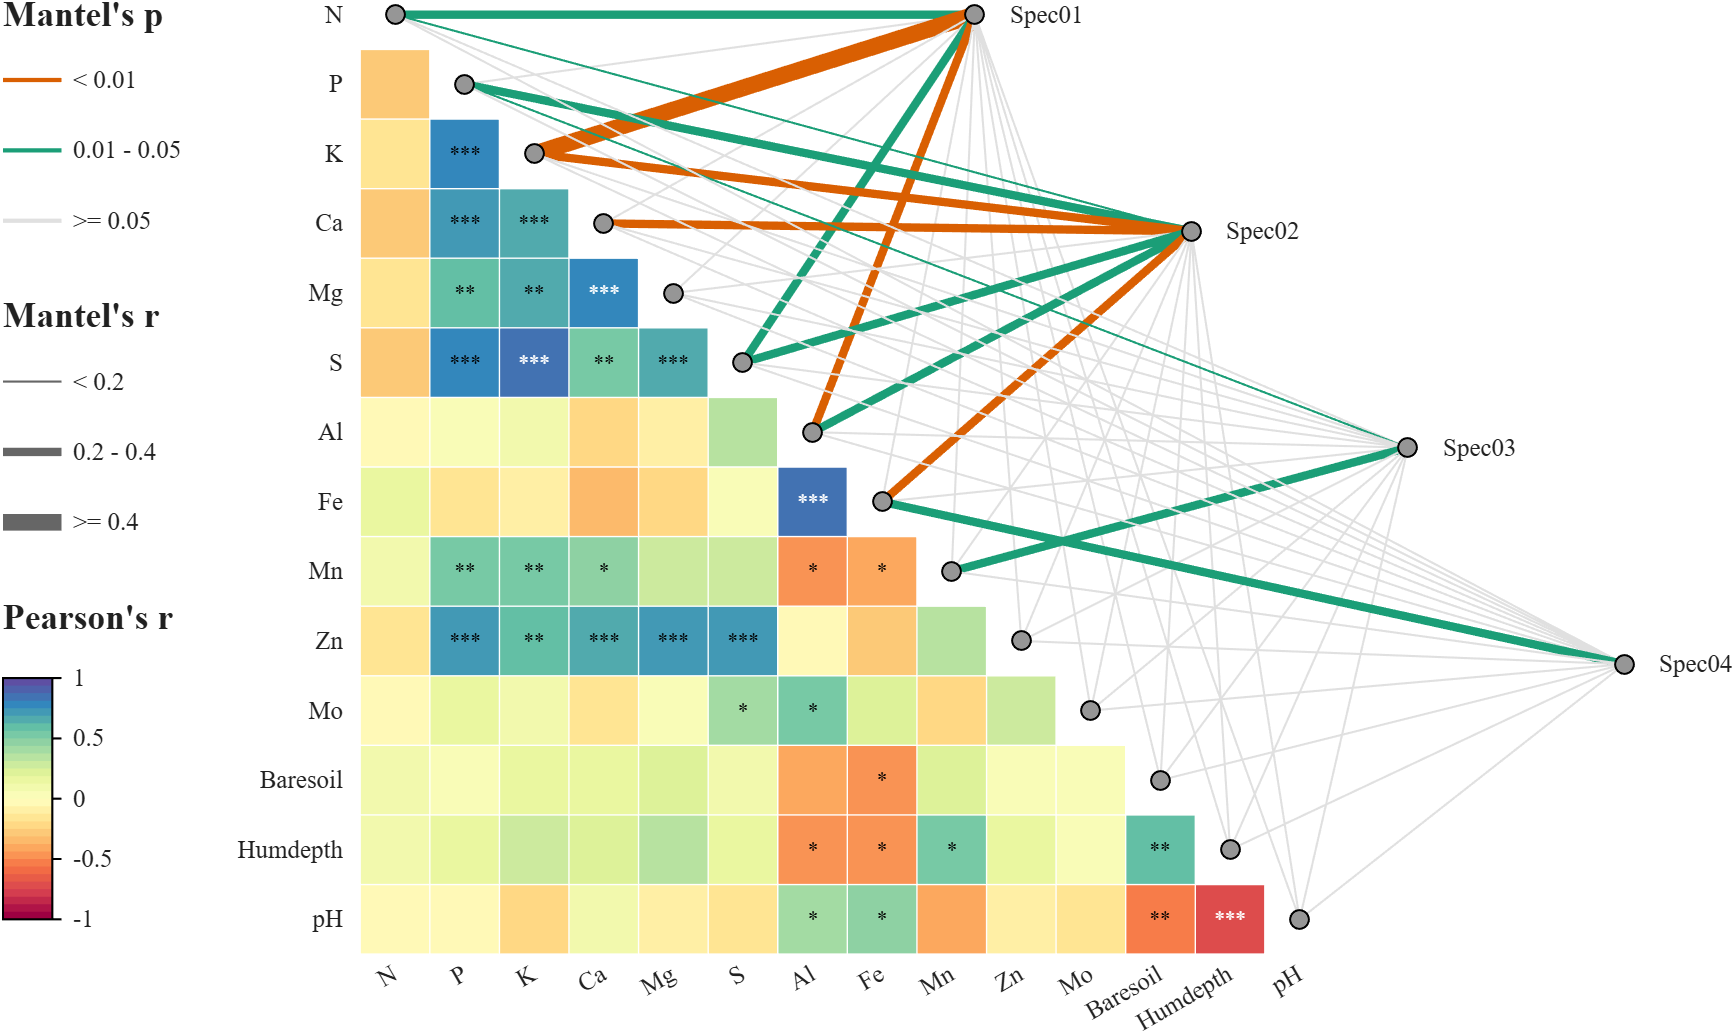
matlab
objML.Curvature = -1/3;
objML.LinkBendMode = 'simple';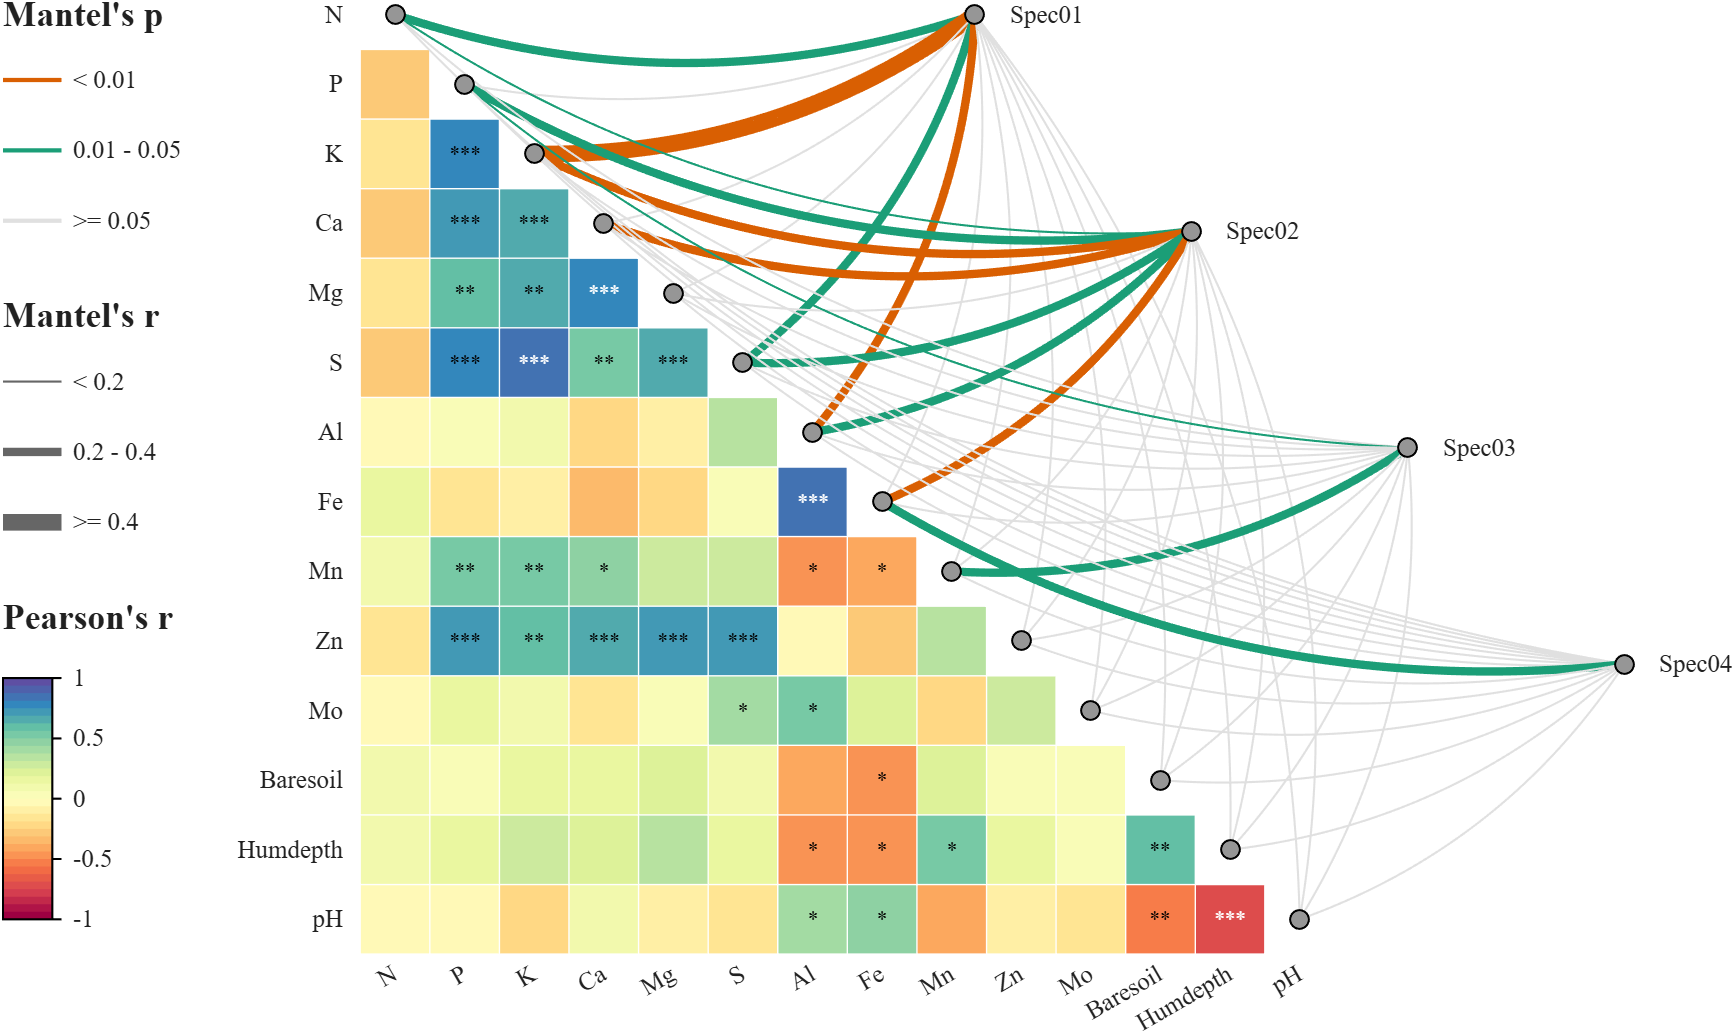
左下角布局与字体、配色修改
matlab
%% Figure and axes
fig = figure('Units','normalized', 'Position',[.05,.15,.72,.72]);
ax = axes('Parent',fig, 'Position',[.06,.05,.88,.9]);

%% Draw heatmap
[rho, pval] = corr(Data1);
objHM = SHeatmap(ax, rho, 'Format','sq');
objHM.draw();

objHM.setText()
objHM.showStars(pval, 'Levels', [0.05, 0.01, 0.001], 'CorrLabel','off')
objHM.setVarName(labels)
objHM.setType('triu0');
objHM.setRowLabelLocation('right')
objHM.setColLabelLocation('top')
objHM.setRowLabel('Visible','on')
objHM.setColLabel('Visible','on')
delete(objHM.Colorbar)

% Apply a custom colormap with 25 colors (应用自定义 25 色 colormap)
colormap(slanCM(102, 25))
% Adjust font properties for labels (调整标签字体)
set([objHM.rowLabelHdl, objHM.colLabelHdl], 'FontSize',14, 'FontName','Helvetica')


%% Draw mantel links
objML = SMantelLink(ax, Data1, Data2, 'Group',group);
objML.GroupName = groupName;
objML.Layout = 'tril';

% Customize colors (自定义颜色)
objML.PColor = [0,64,115; 79,148,204; 224,224,224]./255;
objML.NodeColor1 = [184,207,248]./255;
objML.NodeColor2 = [184,207,248]./255;

objML.draw()

% Adjust legend and group label fonts (调整图例和组标签字体)
set(objML.legendTitleHdl, 'FontName','Helvetica')
set(objML.legendTickLabelHdl, 'FontSize',13, 'FontName','Helvetica')
set(objML.groupLabelHdl, 'FontSize',14, 'FontName','Helvetica')
结
以上绘图代码需要下载工具函数才能运行: