启发:
我之前从事军工行业曾突发奇想,用echarts的点、线、图标来构成兵力单元、军事防线、障碍物水雷舰队等,在echarts4.9.0的版本中还有平面地图,接受一定精度的经纬度,可以轻量地展示军事布设图。因为保密协议,相关截图和代码都是没有的。
但是受到启发,我在预览航线时,觉得加载三维地图引擎只用来预览航线样子有些大炮打蚊子,并且频繁销毁三维地图会给浏览器增加不必要的负担,于是想到了用echarts来表示。
因为我要用到一些echarts新版本特性,所以没有用4.9.0版本,也就是说没有底图,但这不影响使用,加载空底图,用css构成网格背景,效果依旧美观。并且我留有引入底图的口子,后续可以引入更加精准的矢量底图,比如高德地图、谷歌地图,也可以自行导入地图数据包,这个包可能要有几百MB,看个人取舍。
echarts的底图只有省市区的的边界线,没有山川河流,没有地名建筑,我是不推荐使用,除非你的点线跨越疆土很大,不然这个底图没有太大意义。
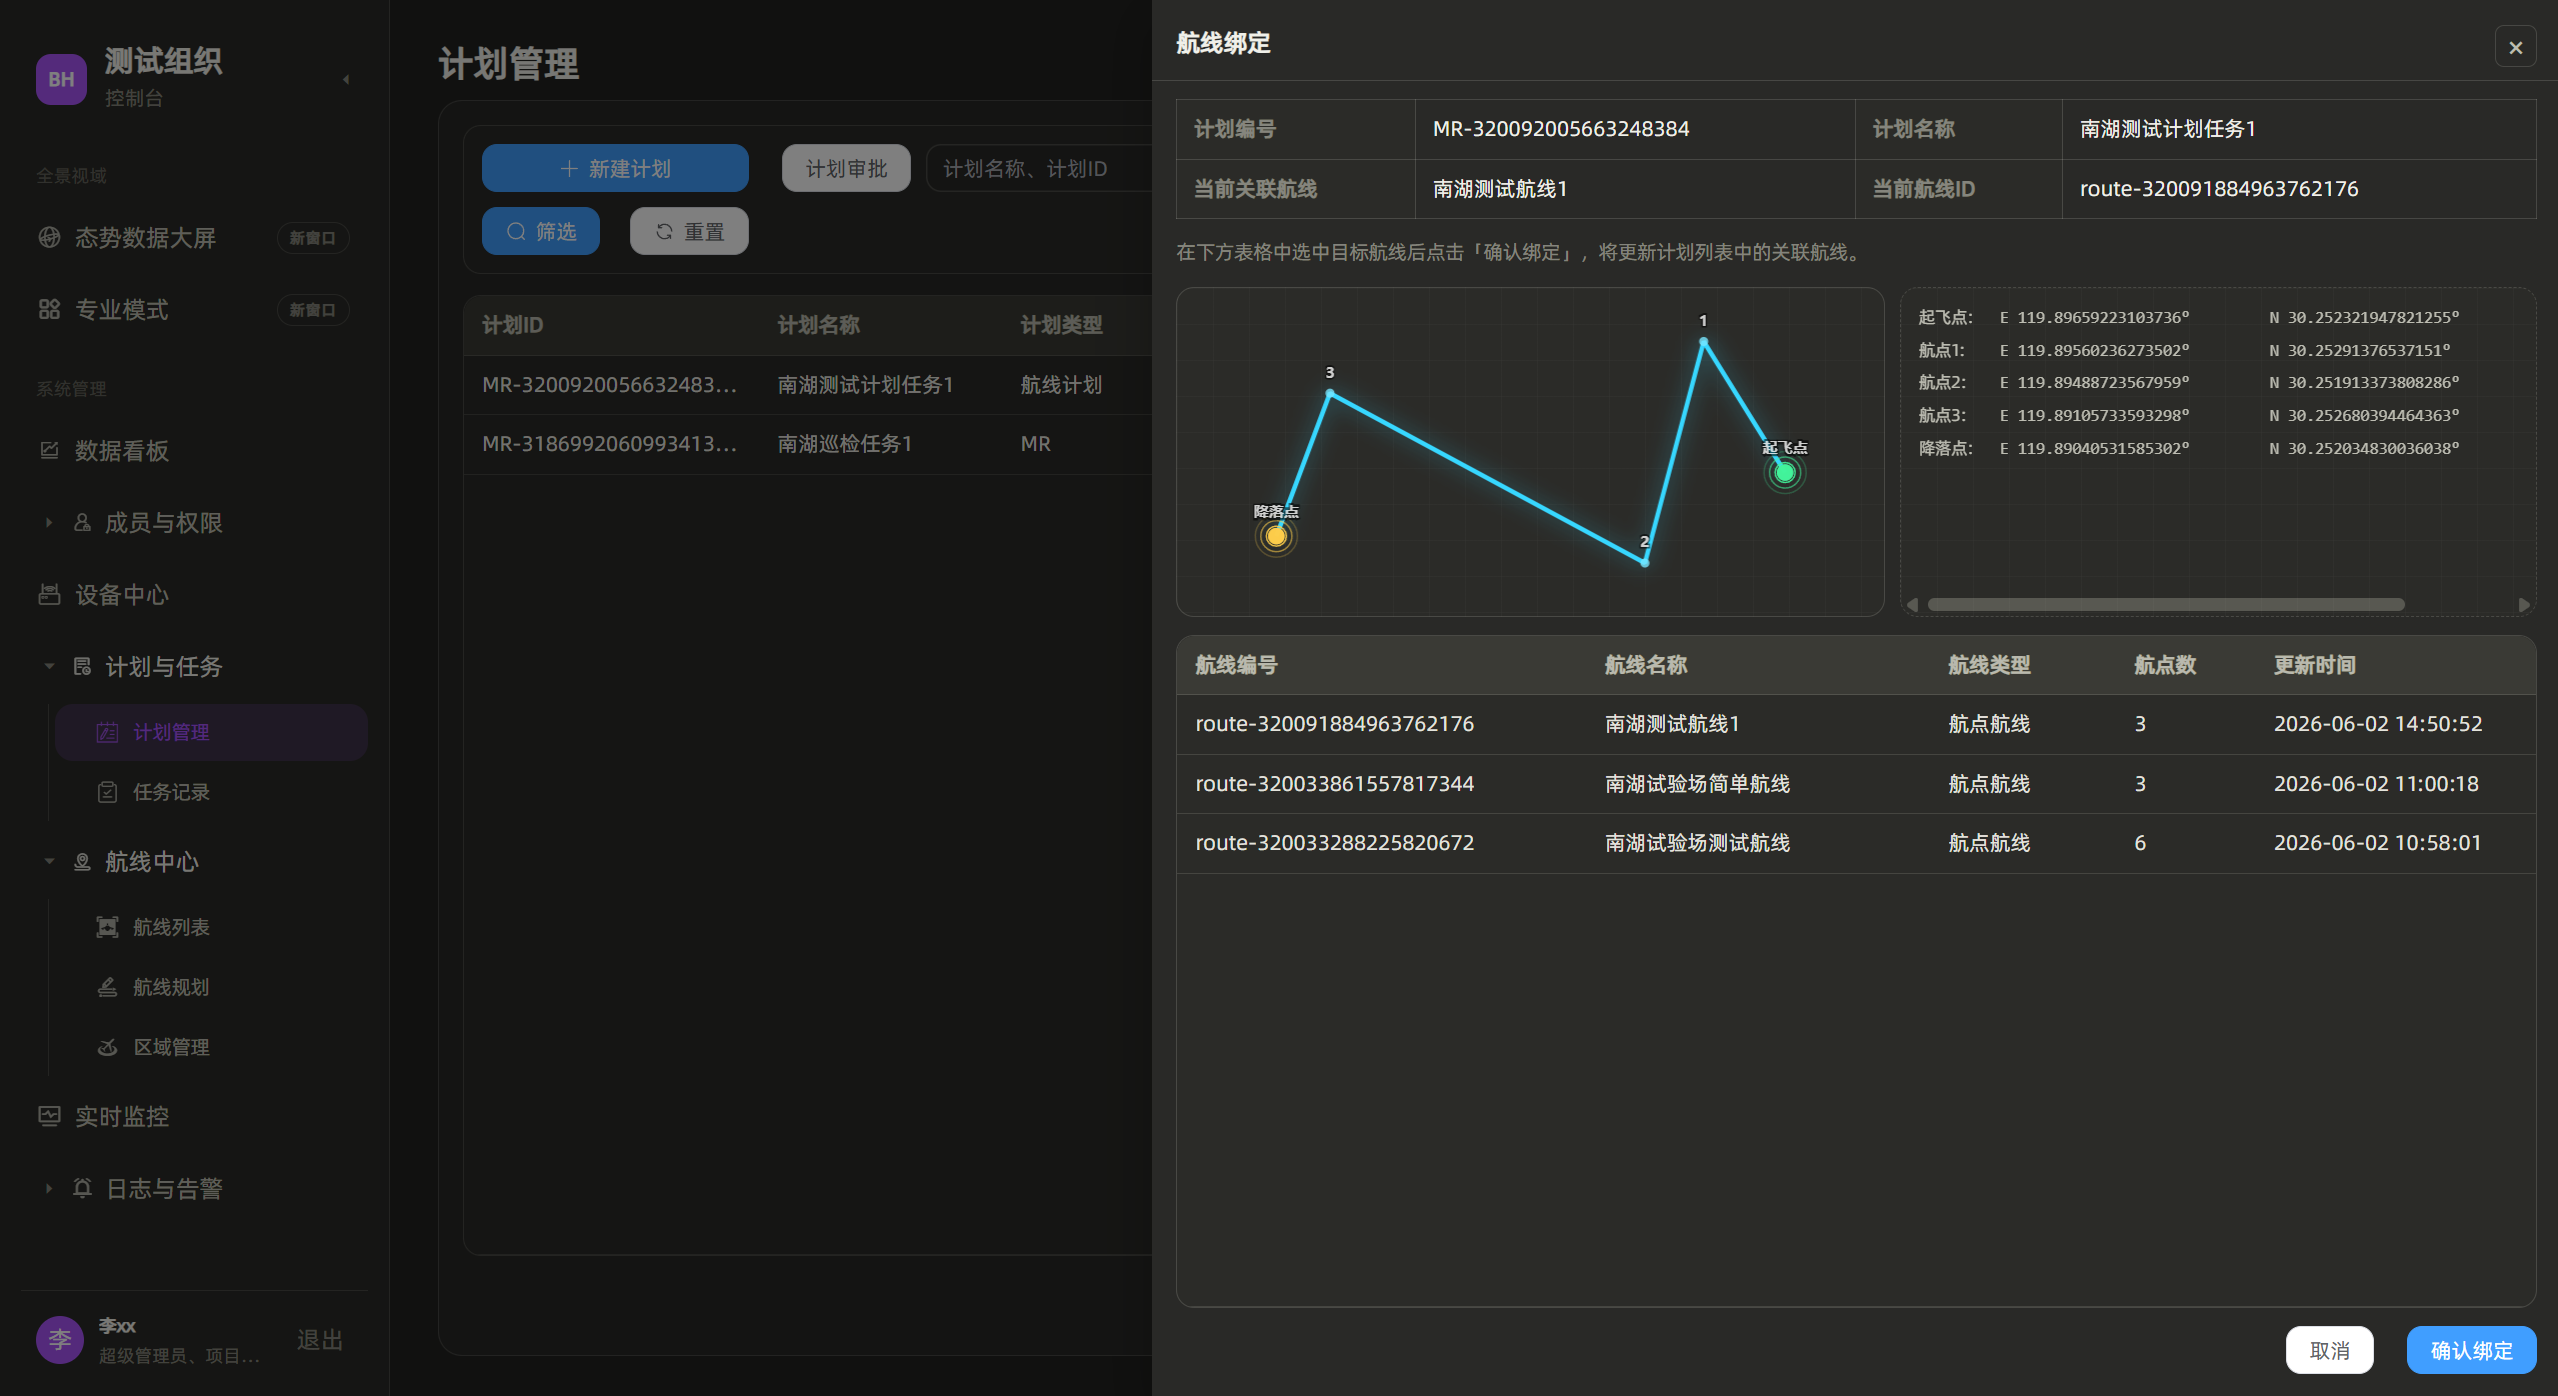
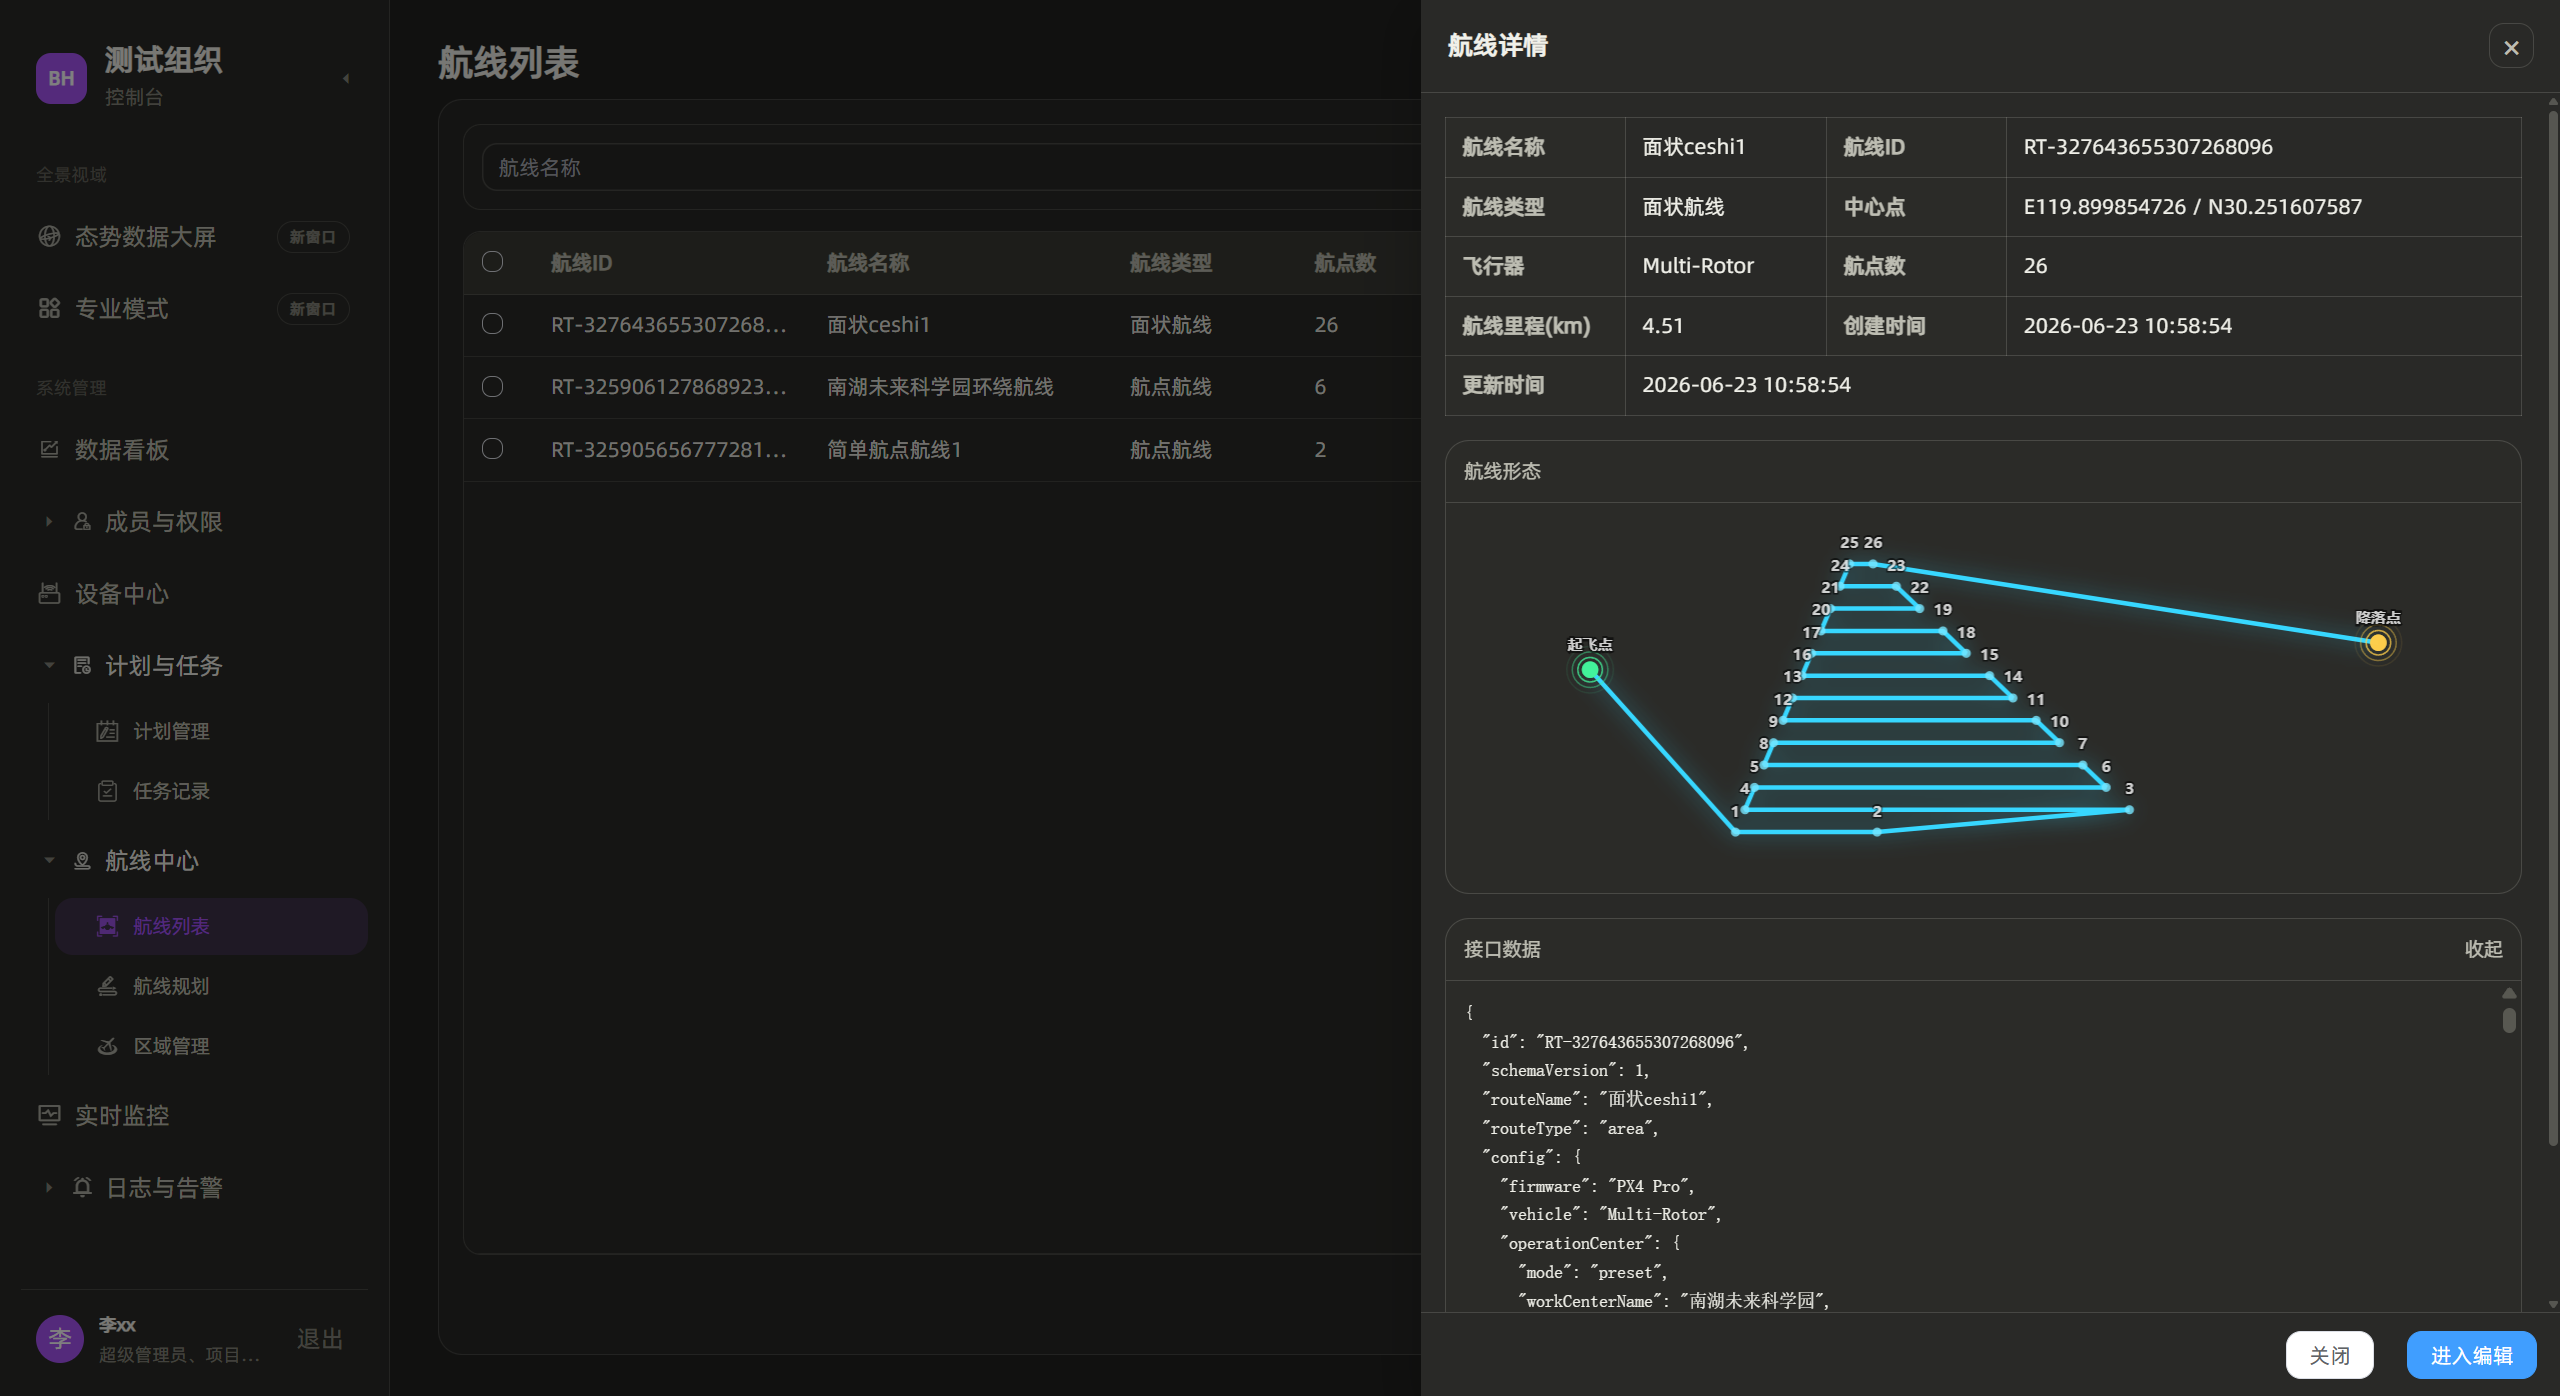
静态效果 :
动图效果 :
应用:
- 调用方法
bash
import { createVectorRoutePreviewChart } from '@/utils/special/vectorRoutePreviewChart'
import type { VectorRoutePreviewChartController } from '@/utils/special/vectorRoutePreviewChart'- 准备 DOM ref 和 chart 实例:
bash
const routePreviewChartRef = ref<HTMLElement | null>(null)
let routePreviewChart: VectorRoutePreviewChartController | null = null- 初始化图表:
bash
function ensureRoutePreviewChart() {
  const container = routePreviewChartRef.value
  if (!container) return null

  routePreviewChart ??= createVectorRoutePreviewChart(container)
  return routePreviewChart
}- 渲染航线:
bash
async function renderRoutePreviewChart() {
  await nextTick()

  const chart = ensureRoutePreviewChart()
  if (!chart) return

  chart.render(activePreviewPoints.value)
}- 销毁图表:
bash
function disposeRoutePreviewChart() {
  routePreviewChart?.dispose()
  routePreviewChart = null
}

onBeforeUnmount(() => {
  disposeRoutePreviewChart()
})- 模板中放容器:
bash
<div class="route-preview">
  <div ref="routePreviewChartRef" class="route-preview-chart" />
</div>初始航线模板数据:
bash
const routeTemplate = {
  id: 'route-320033861557817344',
  name: '南湖试验场简单航线',
  routeType: '航点航线',
  points: 3,
  updatedAt: '2026-06-02 11:00:18',
  previewPoints: [
    {
      lng: 119.89659223103736,
      lat: 30.252321947821255,
      height: 15.84,
      pointType: 'takeoff',
      name: '起飞点',
    },
    {
      lng: 119.89560236273502,
      lat: 30.25291376537151,
      height: 118,
      pointType: 'waypoint',
      waypointIndex: 1,
    },
    {
      lng: 119.89488723567959,
      lat: 30.25191373808286,
      height: 118,
      pointType: 'waypoint',
      waypointIndex: 2,
    },
    {
      lng: 119.89105733593298,
      lat: 30.252680394464363,
      height: 118,
      pointType: 'waypoint',
      waypointIndex: 3,
    },
    {
      lng: 119.89040531585302,
      lat: 30.252034830036038,
      height: 15.61,
      pointType: 'landing',
      name: '降落点',
    },
  ],
}封装代码:
config.ts
bash
export const CURRENT_CONFIG = {
  // amap
  vmapKey: 'your key',
  vmapSecurityJsCode: 'your security js code',
  vmapVersion: '2.0',
}
vectorRoutePreviewChart.ts
bash
import * as echarts from 'echarts'

import type { ECharts, EChartsCoreOption } from 'echarts'

export type VectorRoutePreviewPoint = {
  lng: number
  lat: number
  height?: number
  pointType?: 'takeoff' | 'waypoint' | 'landing'
  waypointIndex?: number
  name?: string
}

export type VectorRoutePreviewStyleOptions = {
  lineColor?: string
  lineWidth?: number
  lineShadowColor?: string
  pointColor?: string
  waypointSize?: number
  startColor?: string
  endColor?: string
  endpointSize?: number
  startLabel?: string
  endLabel?: string
  showEndpointLabel?: boolean
}

export type VectorRoutePreviewChartController = {
  render: (
    points: readonly VectorRoutePreviewPoint[],
    options?: VectorRoutePreviewStyleOptions,
  ) => void
  resize: () => void
  dispose: () => void
  getChart: () => ECharts
}

const DEFAULT_LINE_COLOR = '#37d7ff'
const DEFAULT_LINE_SHADOW_COLOR = 'rgba(55, 215, 255, 0.55)'
const DEFAULT_POINT_COLOR = '#77e6ff'
const DEFAULT_START_COLOR = '#42f59b'
const DEFAULT_END_COLOR = '#ffce4a'

function getPointLabel(point: VectorRoutePreviewPoint, index: number, total: number) {
  if (point.pointType === 'takeoff') return '起飞点'
  if (point.pointType === 'landing') return '降落点'
  if (point.pointType === 'waypoint') return String(point.waypointIndex ?? index + 1)
  if (index === 0) return '起飞点'
  if (index === total - 1) return '降落点'
  return String(point.waypointIndex ?? index)
}

function getPointColor(point: VectorRoutePreviewPoint, index: number, total: number) {
  if (point.pointType === 'takeoff') return DEFAULT_START_COLOR
  if (point.pointType === 'landing') return DEFAULT_END_COLOR
  if (point.pointType === 'waypoint') return DEFAULT_POINT_COLOR
  if (index === 0) return DEFAULT_START_COLOR
  if (index === total - 1) return DEFAULT_END_COLOR
  return DEFAULT_POINT_COLOR
}

function getAxisRange(values: number[]) {
  if (!values.length) return { min: 0, max: 1 }
  const minValue = Math.min(...values)
  const maxValue = Math.max(...values)
  const span = Math.max(maxValue - minValue, 0.0001)
  const padding = Math.max(span * 0.16, 0.00008)

  return {
    min: minValue - padding,
    max: maxValue + padding,
  }
}

export function buildVectorRoutePreviewOption(
  points: readonly VectorRoutePreviewPoint[],
  options: VectorRoutePreviewStyleOptions = {},
): EChartsCoreOption {
  const {
    lineColor = DEFAULT_LINE_COLOR,
    lineWidth = 3,
    lineShadowColor = DEFAULT_LINE_SHADOW_COLOR,
    pointColor = DEFAULT_POINT_COLOR,
    waypointSize = 6,
    startColor = DEFAULT_START_COLOR,
    endColor = DEFAULT_END_COLOR,
    endpointSize = 11,
    startLabel = '起飞点',
    endLabel = '降落点',
    showEndpointLabel = true,
  } = options
  const lngRange = getAxisRange(points.map((point) => point.lng))
  const latRange = getAxisRange(points.map((point) => point.lat))
  const lineData = points.map((point) => [point.lng, point.lat])
  const pointData = points.map((point, index) => {
    const isTakeoff = point.pointType === 'takeoff' || (!point.pointType && index === 0)
    const isLanding =
      point.pointType === 'landing' || (!point.pointType && index === points.length - 1)
    const label = isTakeoff
      ? startLabel
      : isLanding
        ? endLabel
        : getPointLabel(point, index, points.length)

    return {
      name: label,
      value: [point.lng, point.lat],
      symbolSize: isTakeoff || isLanding ? endpointSize : waypointSize,
      label: {
        formatter: label,
      },
      itemStyle: {
        color: isTakeoff
          ? startColor
          : isLanding
            ? endColor
            : point.pointType === 'waypoint'
              ? pointColor
              : getPointColor(point, index, points.length),
      },
    }
  })
  const endpointEffectData = pointData.filter(
    (_, index) =>
      points[index]?.pointType === 'takeoff' ||
      points[index]?.pointType === 'landing' ||
      (!points[index]?.pointType && (index === 0 || index === points.length - 1)),
  )

  return {
    animation: true,
    backgroundColor: 'transparent',
    grid: {
      left: 12,
      right: 12,
      top: 12,
      bottom: 12,
      containLabel: false,
    },
    xAxis: {
      type: 'value',
      min: lngRange.min,
      max: lngRange.max,
      show: false,
    },
    yAxis: {
      type: 'value',
      min: latRange.min,
      max: latRange.max,
      show: false,
    },
    series: [
      {
        type: 'line',
        data: lineData,
        symbol: 'none',
        lineStyle: {
          color: lineColor,
          width: lineWidth,
          shadowBlur: 14,
          shadowColor: lineShadowColor,
        },
        z: 2,
      },
      {
        type: 'scatter',
        data: pointData,
        symbolSize: (value: unknown, params: { data?: { symbolSize?: number } }) =>
          params.data?.symbolSize ?? waypointSize,
        label: {
          show: showEndpointLabel,
          position: 'top',
          color: '#ffffff',
          fontSize: 10,
          fontWeight: 600,
          textBorderColor: 'rgba(0, 0, 0, 0.72)',
          textBorderWidth: 2,
        },
        z: 4,
      },
      {
        type: 'effectScatter',
        data: endpointEffectData,
        symbolSize: endpointSize + 3,
        rippleEffect: {
          brushType: 'stroke',
          scale: 3,
        },
        label: {
          show: false,
        },
        itemStyle: {
          opacity: 0.92,
        },
        z: 3,
      },
    ],
  }
}

export function createVectorRoutePreviewChart(
  container: HTMLElement,
  options: VectorRoutePreviewStyleOptions = {},
): VectorRoutePreviewChartController {
  const chart = echarts.getInstanceByDom(container) ?? echarts.init(container)
  let resizeObserver: ResizeObserver | null = null

  function render(
    points: readonly VectorRoutePreviewPoint[],
    nextOptions: VectorRoutePreviewStyleOptions = {},
  ) {
    chart.setOption(buildVectorRoutePreviewOption(points, { ...options, ...nextOptions }), {
      notMerge: true,
      lazyUpdate: false,
    })
    chart.resize()
  }

  function resize() {
    chart.resize()
  }

  function dispose() {
    resizeObserver?.disconnect()
    resizeObserver = null
    chart.dispose()
  }

  if (typeof ResizeObserver !== 'undefined') {
    resizeObserver = new ResizeObserver(resize)
    resizeObserver.observe(container)
  }

  return {
    render,
    resize,
    dispose,
    getChart: () => chart,
  }
}