测试20万qps的web接口(一)
本篇文章主要用于描述单台服务器能否支撑20万qps的web接口访问。
动机
在以往的经历中,所做的web性能测试很少能超过5w的qps。
之前的测试流程大致是这样的:工作电脑上运行jmeter或者ab,在工作电脑或目标服务器上运行web服务,测试目标接口的qps。
由于在一台电脑上同时运行jmeter和web服务,或者是目标服务器配置过低,或者是公司网络环境复杂,很难判断出web服务的真实极限是什么。
最近找工作找的头疼,广州招高级或资深的java游戏服务端的岗位好少。开始自学golang,看看会不会多一点机会。自己年龄也大了,而且人家是否愿意接受golang初学者也是一个问题。转移一下自己的注意力,缓解一下急躁,看看如何构建一个支撑20万qps的web服务。
测试环境
在本次测试中,测试端和目标web服务各自运行在一台独立的服务器上,它们之间的交互必须通过网络来完成。
本次准备了三台电脑:控制端、测试端、web服务端。
控制端:远程控制测试端和web服务端,开启测试,观察服务器状态。
测试端:运行压测程序。
web服务端:运行目标web服务。
控制端
操作系统:Win10
硬件:联想小新pro2019,i7-10710u(6核12线程),16g
测试端-服务器
操作系统:Ubuntu26
硬件:2026年咸鱼买的洋垃圾nec8迷你主机,i3-9100t(4核4线程),1x16g ddr4-3200
root@ranger2-mini:~# lscpu
Architecture:                x86_64
  CPU op-mode(s):            32-bit, 64-bit
  Address sizes:             39 bits physical, 48 bits virtual
  Byte Order:                Little Endian
CPU(s):                      4
  On-line CPU(s) list:       0-3
Vendor ID:                   GenuineIntel
  Model name:                Intel(R) Core(TM) i3-9100T CPU @ 3.10GHz
    CPU family:              6
    Model:                   158
    Thread(s) per core:      1
    Core(s) per socket:      4
    Socket(s):               1
    Stepping:                11
    CPU(s) scaling MHz:      24%
    CPU max MHz:             3700.0000
    CPU min MHz:             800.0000
    BogoMIPS:                6199.99

root@ranger2-mini:~# ip -s link
1: lo: <LOOPBACK,UP,LOWER_UP> mtu 65536 qdisc noqueue state UNKNOWN mode DEFAULT group default qlen 1000
    link/loopback 00:00:00:00:00:00 brd 00:00:00:00:00:00
    RX:  bytes packets errors dropped  missed   mcast
         78574     992      0       0       0       0
    TX:  bytes packets errors dropped carrier collsns
         78574     992      0       0       0       0
2: eno1: <BROADCAST,MULTICAST,UP,LOWER_UP> mtu 1500 qdisc fq_codel state UP mode DEFAULT group default qlen 1000
    link/ether 98:fa:9b:c1:41:2e brd ff:ff:ff:ff:ff:ff
    RX:   bytes   packets errors dropped  missed   mcast
    63765502190 244093755      0       2       0    2783
    TX:   bytes   packets errors dropped carrier collsns
    33076517651 244285423      0       7       0       0
    altname enp0s31f6
    altname enx98fa9bc1412e
3: wlp1s0: <BROADCAST,MULTICAST> mtu 1500 qdisc noqueue state DOWN mode DEFAULT group default qlen 1000
    link/ether 04:ed:33:9b:82:dc brd ff:ff:ff:ff:ff:ff
    RX:  bytes packets errors dropped  missed   mcast
         17072     135      0       0       0       0
    TX:  bytes packets errors dropped carrier collsns
         17215     115      0       1       0       0
    altname wlx04ed339b82dc
web服务端-服务器
操作系统:Ubuntu26
硬件:2012年的组装机,e3-1230v2(4核8线程),4x4g ddr3-1600
root@ranger2-pc:~/work/logs# lscpu
架构:                       x86_64
  CPU 运行模式:             32-bit, 64-bit
  Address sizes:             36 bits physical, 48 bits virtual
  字节序:                   Little Endian
CPU:                         8
  在线 CPU 列表:            0-7
厂商 ID:                    GenuineIntel
  型号名称:                 Intel(R) Xeon(R) CPU E3-1230 V2 @ 3.30GHz
    CPU 系列:               6
    型号:                   58
    每个核的线程数:         2
    每个座的核数:           4
    座:                     1
    步进:                   9
    CPU(s) scaling MHz:      63%
    CPU 最大 MHz:           3700.0000
    CPU 最小 MHz:           1600.0000
    BogoMIPS:               6798.27

root@ranger2-pc:~/work/logs# ip -s link
1: lo: <LOOPBACK,UP,LOWER_UP> mtu 65536 qdisc noqueue state UNKNOWN mode DEFAULT group default qlen 1000
    link/loopback 00:00:00:00:00:00 brd 00:00:00:00:00:00
    RX:   bytes   packets errors dropped  missed   mcast
    27638356077 133007240      0       0       0       0
    TX:   bytes   packets errors dropped carrier collsns
    27638356077 133007240      0       0       0       0
2: enp3s0: <BROADCAST,MULTICAST,UP,LOWER_UP> mtu 1500 qdisc mq state UP mode DEFAULT group default qlen 1000
    link/ether 00:0b:0e:0f:00:ed brd ff:ff:ff:ff:ff:ff
    RX:   bytes   packets errors dropped  missed   mcast
    33664377053 209550051      0     119       0     193
    TX:   bytes   packets errors dropped carrier collsns
    53610926946 209417891      0       8       0       0
web服务不需要使用复杂的技术栈,只要能简洁高效提供一个完整的web接口就行。
这里使用了openresty来充当本次测试的web服务。
/opt/openresty/nginx/sbin/nginx -c conf/nginx.conf -p /root/work

worker_processes  8;
error_log logs/error.log;
events {
    worker_connections 65535;
}
http {
    server {
        listen 8080;
        location / {
            default_type text/html;
            content_by_lua_block {
                ngx.say("<p>hello, world</p>")
            }
        }
    }
}
网络拓扑
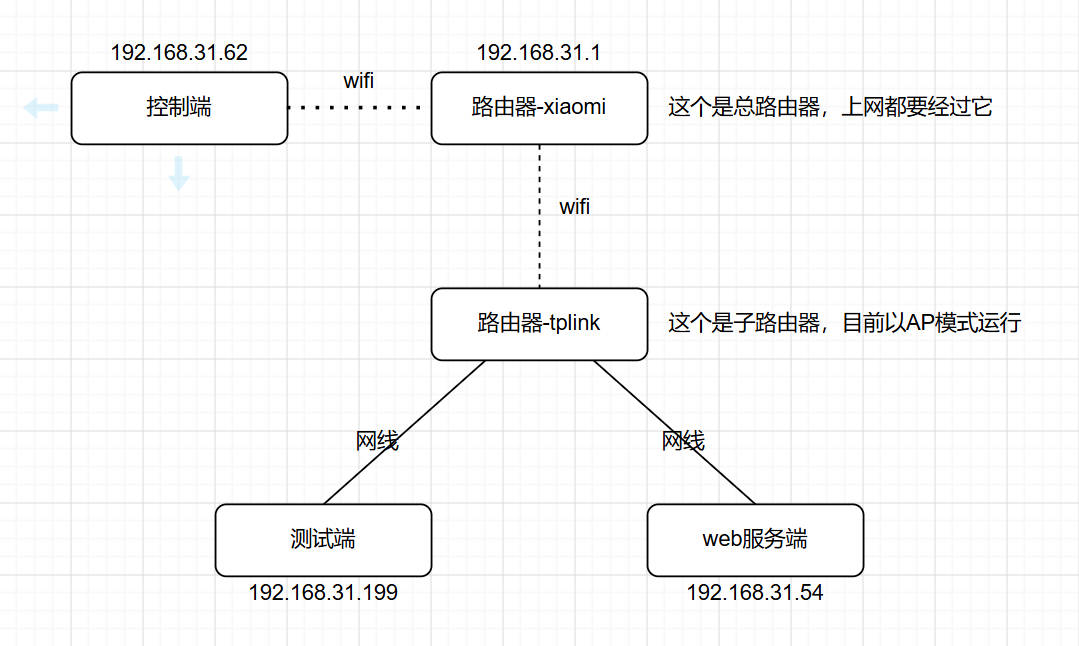
测试端-服务器有两个网卡,一个是无线,一个是有线。使用无线网卡测试时(直连路由器-xiaomi),发现qps太低,而且对应的内核线程占用cpu特别高(40%以上),所以就禁用了无线网卡。
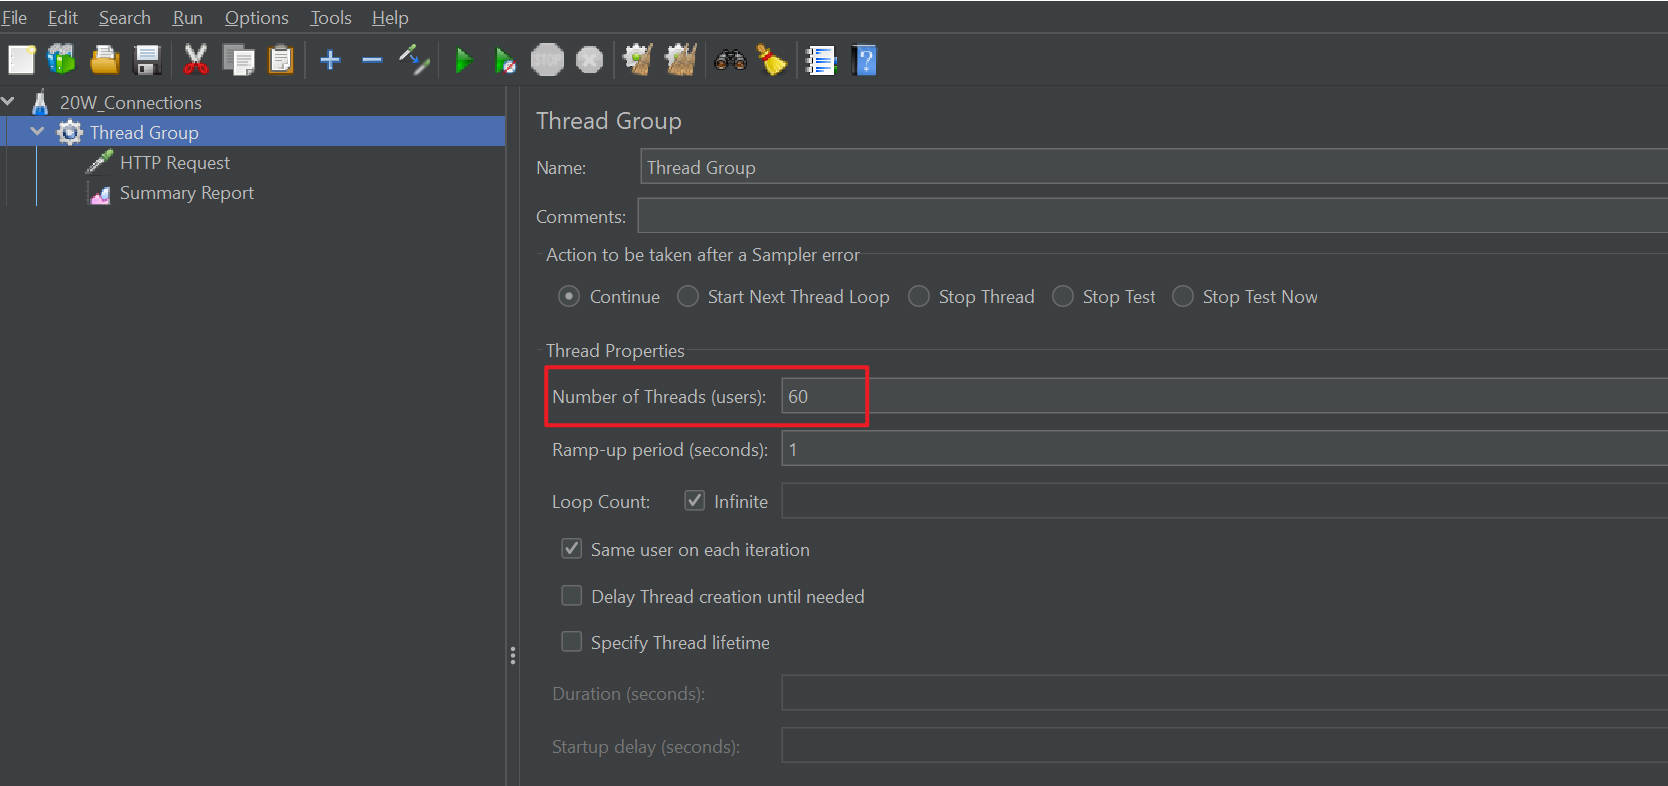
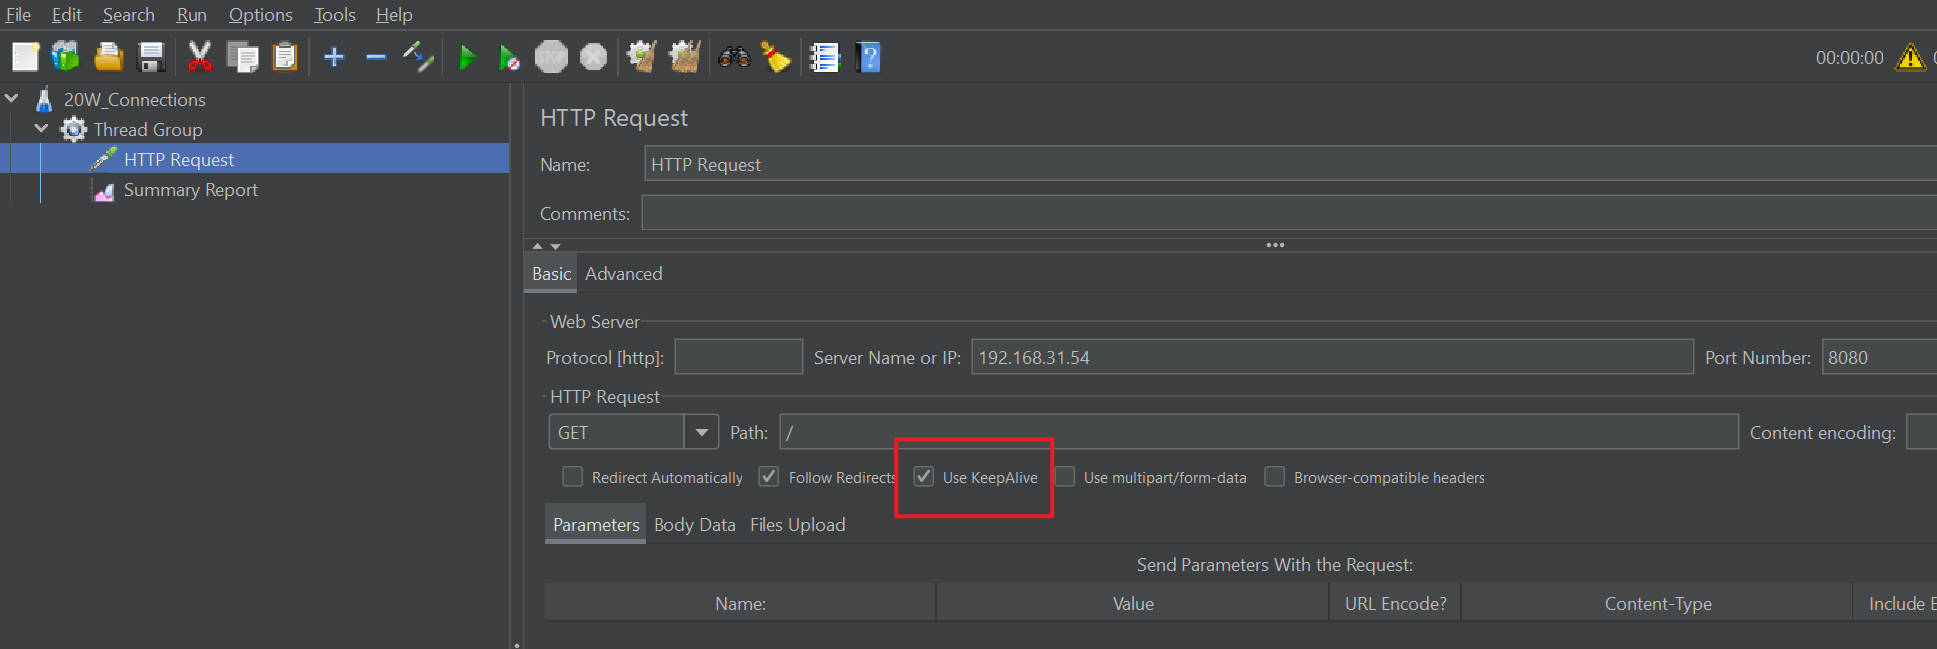
使用JMeter测试
jmeter配置了60个线程,启用了keep-alive。
测试结果:大约是86000qps。
此时web服务端-服务器的cpu空闲率为50%,测试端-服务器cpu处于满载状态。
测试端
root@ranger2-mini:/opt/apache-jmeter-5.6.3# ./bin/jmeter.sh -n -t plan/20W_Connections.jmx -l ./result.jtl -e
WARN StatusConsoleListener The use of package scanning to locate plugins is deprecated and will be removed in a future release
WARN StatusConsoleListener The use of package scanning to locate plugins is deprecated and will be removed in a future release
WARN StatusConsoleListener The use of package scanning to locate plugins is deprecated and will be removed in a future release
WARN StatusConsoleListener The use of package scanning to locate plugins is deprecated and will be removed in a future release
Creating summariser <summary>
Created the tree successfully using plan/20W_Connections.jmx
Starting standalone test @ 2026 Jul 2 12:49:00 CST (1782967740548)
Waiting for possible Shutdown/StopTestNow/HeapDump/ThreadDump message on port 4445
summary +      1 in 00:00:00 =    6.9/s Avg:    32 Min:    32 Max:    32 Err:     0 (0.00%) Active: 8 Started: 8 Finished: 0
summary + 1659921 in 00:00:29 = 56788.3/s Avg:     0 Min:     0 Max:    61 Err:     0 (0.00%) Active: 60 Started: 60 Finished: 0
summary = 1659922 in 00:00:29 = 56511.8/s Avg:     0 Min:     0 Max:    61 Err:     0 (0.00%)
summary + 2595807 in 00:00:30 = 86526.9/s Avg:     0 Min:     0 Max:    47 Err:     0 (0.00%) Active: 60 Started: 60 Finished: 0
summary = 4255729 in 00:00:59 = 71677.9/s Avg:     0 Min:     0 Max:    61 Err:     0 (0.00%)
summary + 2572715 in 00:00:30 = 85757.2/s Avg:     0 Min:     0 Max:    43 Err:     0 (0.00%) Active: 60 Started: 60 Finished: 0
summary = 6828444 in 00:01:29 = 76403.9/s Avg:     0 Min:     0 Max:    61 Err:     0 (0.00%)
summary + 2586149 in 00:00:30 = 86205.0/s Avg:     0 Min:     0 Max:    17 Err:     0 (0.00%) Active: 60 Started: 60 Finished: 0
summary = 9414593 in 00:01:59 = 78867.0/s Avg:     0 Min:     0 Max:    61 Err:     0 (0.00%)
summary + 2613381 in 00:00:30 = 87112.7/s Avg:     0 Min:     0 Max:    26 Err:     0 (0.00%) Active: 60 Started: 60 Finished: 0
summary = 12027974 in 00:02:29 = 80522.5/s Avg:     0 Min:     0 Max:    61 Err:     0 (0.00%)
summary + 2608547 in 00:00:30 = 86954.5/s Avg:     0 Min:     0 Max:   208 Err:     0 (0.00%) Active: 60 Started: 60 Finished: 0
summary = 14636521 in 00:02:59 = 81598.2/s Avg:     0 Min:     0 Max:   208 Err:     0 (0.00%)
summary + 2617482 in 00:00:30 = 87249.4/s Avg:     0 Min:     0 Max:    31 Err:     0 (0.00%) Active: 60 Started: 60 Finished: 0
summary = 17254003 in 00:03:29 = 82408.0/s Avg:     0 Min:     0 Max:   208 Err:     0 (0.00%)
summary + 2590724 in 00:00:30 = 86357.5/s Avg:     0 Min:     0 Max:    57 Err:     0 (0.00%) Active: 60 Started: 60 Finished: 0
summary = 19844727 in 00:03:59 = 82902.9/s Avg:     0 Min:     0 Max:   208 Err:     0 (0.00%)
cpu
12:52:48 PM  CPU    %usr   %nice    %sys %iowait    %irq   %soft  %steal  %guest  %gnice   %idle
12:52:51 PM  all   59.83    0.00   23.50    0.00    0.00   14.08    0.00    0.00    0.00    2.58
12:52:51 PM    0   69.33    0.00   28.00    0.00    0.00    0.00    0.00    0.00    0.00    2.67
12:52:51 PM    1   70.23    0.00   27.09    0.00    0.00    0.00    0.00    0.00    0.00    2.68
12:52:51 PM    2   30.13    0.00   11.26    0.00    0.00   55.96    0.00    0.00    0.00    2.65
12:52:51 PM    3   69.90    0.00   27.76    0.00    0.00    0.00    0.00    0.00    0.00    2.34

12:52:51 PM  CPU    %usr   %nice    %sys %iowait    %irq   %soft  %steal  %guest  %gnice   %idle
12:52:54 PM  all   61.02    0.00   24.37    0.00    0.00   13.77    0.00    0.00    0.00    0.83
12:52:54 PM    0   71.57    0.00   27.76    0.00    0.00    0.00    0.00    0.00    0.00    0.67
12:52:54 PM    1   69.57    0.00   29.43    0.00    0.00    0.00    0.00    0.00    0.00    1.00
12:52:54 PM    2   31.10    0.00   13.04    0.00    0.00   55.18    0.00    0.00    0.00    0.67
12:52:54 PM    3   71.76    0.00   27.24    0.00    0.00    0.00    0.00    0.00    0.00    1.00
network
12:53:00 PM     IFACE   rxpck/s   txpck/s    rxkB/s    txkB/s   rxcmp/s   txcmp/s  rxmcst/s   %ifutil
12:53:03 PM        lo      0.00      0.00      0.00      0.00      0.00      0.00      0.00      0.00
12:53:03 PM      eno1  87831.00  87882.33  22407.82  16347.67      0.00      0.00      0.00     18.36
12:53:03 PM    wlp1s0      0.00      0.00      0.00      0.00      0.00      0.00      0.00      0.00

12:53:03 PM     IFACE   rxpck/s   txpck/s    rxkB/s    txkB/s   rxcmp/s   txcmp/s  rxmcst/s   %ifutil
12:53:06 PM        lo      0.00      0.00      0.00      0.00      0.00      0.00      0.00      0.00
12:53:06 PM      eno1  87705.00  87756.33  22374.45  16322.94      0.00      0.00      0.00     18.33
12:53:06 PM    wlp1s0      0.00      0.00      0.00      0.00      0.00      0.00      0.00      0.00
web服务端
cpu
12时53分32秒  CPU    %usr   %nice    %sys %iowait    %irq   %soft  %steal  %guest  %gnice   %idle
12时53分35秒  all   21.87    0.00   23.62    0.04    0.00    7.76    0.00    0.00    0.00   46.71
12时53分35秒    0   25.00    0.00   25.00    0.00    0.00    5.82    0.00    0.00    0.00   44.18
12时53分35秒    1   23.79    0.00   25.86    0.34    0.00    0.34    0.00    0.00    0.00   49.66
12时53分35秒    2   18.95    0.00   22.81    0.00    0.00    0.00    0.00    0.00    0.00   58.25
12时53分35秒    3   22.68    0.00   25.09    0.00    0.00    0.00    0.00    0.00    0.00   52.23
12时53分35秒    4   22.79    0.00   24.15    0.00    0.00    0.00    0.00    0.00    0.00   53.06
12时53分35秒    5   15.75    0.00   15.75    0.00    0.00   47.64    0.00    0.00    0.00   20.87
12时53分35秒    6   21.45    0.00   23.88    0.00    0.00    6.23    0.00    0.00    0.00   48.44
12时53分35秒    7   23.69    0.00   25.44    0.00    0.00    6.97    0.00    0.00    0.00   43.90

12时53分35秒  CPU    %usr   %nice    %sys %iowait    %irq   %soft  %steal  %guest  %gnice   %idle
12时53分38秒  all   21.41    0.00   23.00    0.00    0.00    7.95    0.00    0.00    0.00   47.64
12时53分38秒    0   21.31    0.00   20.96    0.00    0.00    6.53    0.00    0.00    0.00   51.20
12时53分38秒    1   21.96    0.00   22.64    0.00    0.00    0.00    0.00    0.00    0.00   55.41
12时53分38秒    2   25.42    0.00   26.44    0.00    0.00    0.00    0.00    0.00    0.00   48.14
12时53分38秒    3   18.39    0.00   23.08    0.00    0.00    0.33    0.00    0.00    0.00   58.19
12时53分38秒    4   21.69    0.00   24.41    0.00    0.00    0.00    0.00    0.00    0.00   53.90
12时53分38秒    5   15.06    0.00   16.60    0.00    0.00   48.26    0.00    0.00    0.00   20.08
12时53分38秒    6   23.39    0.00   23.05    0.00    0.00    6.78    0.00    0.00    0.00   46.78
12时53分38秒    7   23.31    0.00   26.01    0.00    0.00    6.76    0.00    0.00    0.00   43.92
network
12时53分30秒     IFACE   rxpck/s   txpck/s    rxkB/s    txkB/s   rxcmp/s   txcmp/s  rxmcst/s   %ifutil
12时53分33秒        lo      0.00      0.00      0.00      0.00      0.00      0.00      0.00      0.00
12时53分33秒    enp3s0  87688.33  87646.00  15966.65  22018.45      0.00      0.00      0.00     18.04

12时53分33秒     IFACE   rxpck/s   txpck/s    rxkB/s    txkB/s   rxcmp/s   txcmp/s  rxmcst/s   %ifutil
12时53分36秒        lo      0.00      0.00      0.00      0.00      0.00      0.00      0.00      0.00
12时53分36秒    enp3s0  87767.67  87720.67  15981.95  22038.95      0.00      0.00      0.00     18.05
进程
12时53分27秒   UID       PID    %usr %system  %guest   %wait    %CPU   CPU  Command
12时53分30秒     0        14    0.00    0.33    0.00    0.00    0.33     0  ksoftirqd/0
12时53分30秒     0        37    0.00    0.33    0.00    0.00    0.33     3  ksoftirqd/3
12时53分30秒     0        49    0.00    0.33    0.00    0.00    0.33     5  ksoftirqd/5
12时53分30秒     0      1439    0.00    0.33    0.00    0.00    0.33     2  nv_queue
12时53分30秒 65534      6022   23.67   31.00    0.00    1.00   54.67     7  nginx
12时53分30秒 65534      6023   23.00   25.33    0.00    0.67   48.33     7  nginx
12时53分30秒 65534      6024   23.00   26.33    0.00    0.00   49.33     3  nginx
12时53分30秒 65534      6025   22.33   23.67    0.00    0.00   46.00     4  nginx
12时53分30秒 65534      6026   23.33   30.67    0.00    1.33   54.00     6  nginx
12时53分30秒 65534      6027   20.33   26.00    0.00    0.67   46.33     1  nginx
12时53分30秒 65534      6028   22.00   24.00    0.00    0.33   46.00     6  nginx
12时53分30秒 65534      6029   23.00   27.67    0.00    0.33   50.67     5  nginx
12时53分30秒     0      6159    0.00    0.33    0.00    0.00    0.33     7  kworker/u32:1-events_unbound
12时53分30秒     0      6840    0.00    0.67    0.00    0.00    0.67     4  kworker/u32:2-flush-8:0
12时53分30秒     0      7536    0.00    0.33    0.00    0.00    0.33     6  kworker/u32:0-flush-8:0
12时53分30秒  1000      7568    0.00    0.33    0.00    0.00    0.33     0  pidstat

12时53分30秒   UID       PID    %usr %system  %guest   %wait    %CPU   CPU  Command
12时53分33秒     0        15    0.00    0.33    0.00    0.33    0.33     1  rcu_preempt
12时53分33秒     0        49    0.00    0.33    0.00    0.00    0.33     5  ksoftirqd/5
12时53分33秒   986       697    0.00    0.33    0.00    0.00    0.33     4  systemd-oomd
12时53分33秒     0      1439    0.00    0.33    0.00    0.00    0.33     4  nv_queue
12时53分33秒  1000      5449    0.00    0.33    0.00    0.00    0.33     4  sshd-session
12时53分33秒 65534      6022   22.33   27.33    0.00    0.67   49.67     2  nginx
12时53分33秒 65534      6023   22.00   28.67    0.00    0.33   50.67     2  nginx
12时53分33秒 65534      6024   22.00   26.33    0.00    0.33   48.33     6  nginx
12时53分33秒 65534      6025   22.67   31.33    0.00    1.67   54.00     7  nginx
12时53分33秒 65534      6026   23.67   29.67    0.00    0.33   53.33     5  nginx
12时53分33秒 65534      6027   20.33   25.67    0.00    0.67   46.00     3  nginx
12时53分33秒 65534      6028   21.33   25.00    0.00    0.00   46.33     1  nginx
12时53分33秒 65534      6029   21.67   25.00    0.00    0.00   46.67     0  nginx
12时53分33秒     0      7555    0.00    0.33    0.00    0.00    0.33     1  sadc
12时53分33秒  1000      7568    0.33    0.33    0.00    0.00    0.67     4  pidstat
使用wrk测试
使用wrk测试时,发现qps能达到震惊的22万qps,然而后面无论怎么调整wrk参数,这个qps都没有什么显著变化。
此时web服务端-服务器趋近于饱和状态。
验证wrk是否真的发送了这么多请求
对比日志,发现wrk真实的发送了这么多http请求。
root@ranger2-pc:~/work/logs# pwd
/root/work/logs
root@ranger2-pc:~/work/logs# ls
access.log  error.log  nginx.pid
root@ranger2-pc:~/work/logs#
root@ranger2-pc:~/work/logs# du -sh access.log
1.1G	access.log
root@ranger2-pc:~/work/logs# wc -l access.log
13592763 access.log
测试端
root@ranger2-mini:/opt/apache-jmeter-5.6.3# wrk -t4 -c150 -d60s -T5s --latency http://192.168.31.54:8080/
Running 1m test @ http://192.168.31.54:8080/
  4 threads and 150 connections
  Thread Stats   Avg      Stdev     Max   +/- Stdev
    Latency   674.25us    1.21ms  73.68ms   99.34%
    Req/Sec    56.89k    18.17k   97.00k    75.18%
  Latency Distribution
     50%  517.00us
     75%  626.00us
     90%    1.03ms
     99%    1.65ms
  13592630 requests in 1.00m, 2.43GB read
Requests/sec: 226166.56
Transfer/sec:     41.41MB
network
12:43:09 PM     IFACE   rxpck/s   txpck/s    rxkB/s    txkB/s   rxcmp/s   txcmp/s  rxmcst/s   %ifutil
12:43:12 PM        lo      0.00      0.00      0.00      0.00      0.00      0.00      0.00      0.00
12:43:12 PM      eno1 225276.67 225479.67  57470.98  25056.86      0.00      0.00      0.00     47.08
12:43:12 PM    wlp1s0      0.00      0.00      0.00      0.00      0.00      0.00      0.00      0.00

12:43:12 PM     IFACE   rxpck/s   txpck/s    rxkB/s    txkB/s   rxcmp/s   txcmp/s  rxmcst/s   %ifutil
12:43:15 PM        lo      0.00      0.00      0.00      0.00      0.00      0.00      0.00      0.00
12:43:15 PM      eno1 226484.33 226681.33  57781.78  25191.38      0.00      0.00      0.00     47.33
12:43:15 PM    wlp1s0      0.00      0.00      0.00      0.00      0.00      0.00      0.00      0.00
cpu
忘记截取cpu状态了。
web服务端
cpu
12时43分38秒  CPU    %usr   %nice    %sys %iowait    %irq   %soft  %steal  %guest  %gnice   %idle
12时43分41秒  all   36.36    0.00   41.19    0.04    0.00   16.25    0.00    0.00    0.00    6.16
12时43分41秒    0   40.54    0.00   44.26    0.00    0.00    9.12    0.00    0.00    0.00    6.08
12时43分41秒    1   45.70    0.00   48.11    0.00    0.00    0.00    0.00    0.00    0.00    6.19
12时43分41秒    2   40.48    0.00   50.52    0.35    0.00    0.00    0.00    0.00    0.00    8.65
12时43分41秒    3   42.16    0.00   48.43    0.00    0.00    0.00    0.00    0.00    0.00    9.41
12时43分41秒    4   42.76    0.00   49.31    0.00    0.00    0.00    0.00    0.00    0.00    7.93
12时43分41秒    5    0.00    0.00    0.00    0.00    0.00  100.00    0.00    0.00    0.00    0.00
12时43分41秒    6   39.46    0.00   45.92    0.00    0.00    8.84    0.00    0.00    0.00    5.78
12时43分41秒    7   40.89    0.00   44.33    0.00    0.00    9.28    0.00    0.00    0.00    5.50

12时43分41秒  CPU    %usr   %nice    %sys %iowait    %irq   %soft  %steal  %guest  %gnice   %idle
12时43分44秒  all   36.43    0.00   40.91    0.00    0.00   16.20    0.00    0.00    0.00    6.46
12时43分44秒    0   41.08    0.00   44.11    0.00    0.00    9.09    0.00    0.00    0.00    5.72
12时43分44秒    1   45.86    0.00   49.31    0.00    0.00    0.00    0.00    0.00    0.00    4.83
12时43分44秒    2   42.41    0.00   47.93    0.00    0.00    0.00    0.00    0.00    0.00    9.66
12时43分44秒    3   42.32    0.00   49.15    0.00    0.00    0.00    0.00    0.00    0.00    8.53
12时43分44秒    4   42.51    0.00   48.08    0.00    0.00    0.00    0.00    0.00    0.00    9.41
12时43分44秒    5    0.00    0.00    0.00    0.00    0.00  100.00    0.00    0.00    0.00    0.00
12时43分44秒    6   38.75    0.00   45.33    0.00    0.00    9.00    0.00    0.00    0.00    6.92
12时43分44秒    7   39.46    0.00   44.56    0.00    0.00    9.18    0.00    0.00    0.00    6.80
network
12时43分33秒     IFACE   rxpck/s   txpck/s    rxkB/s    txkB/s   rxcmp/s   txcmp/s  rxmcst/s   %ifutil
12时43分36秒        lo      0.00      0.00      0.00      0.00      0.00      0.00      0.00      0.00
12时43分36秒    enp3s0 226114.33 225914.33  24243.17  56750.97      0.00      0.00      0.00     46.49

12时43分36秒     IFACE   rxpck/s   txpck/s    rxkB/s    txkB/s   rxcmp/s   txcmp/s  rxmcst/s   %ifutil
12时43分39秒        lo      0.00      0.00      0.00      0.00      0.00      0.00      0.00      0.00
12时43分39秒    enp3s0 225507.33 225314.67  24178.99  56604.47      0.00      0.00      0.00     46.37
进程
12时43分31秒   UID       PID    %usr %system  %guest   %wait    %CPU   CPU  Command
12时43分34秒     0        49    0.00   98.33    0.00    0.67   98.33     5  ksoftirqd/5
12时43分34秒     0      1439    0.00    0.33    0.00    0.00    0.33     3  nv_queue
12时43分34秒  1000      5690    0.33    0.00    0.00    0.00    0.33     6  sudo
12时43分34秒 65534      6022   35.67   46.00    0.00    8.33   81.67     1  nginx
12时43分34秒 65534      6023   32.67   40.33    0.00   15.33   73.00     4  nginx
12时43分34秒 65534      6024   34.33   43.67    0.00   10.33   78.00     4  nginx
12时43分34秒 65534      6025   34.33   46.67    0.00    9.33   81.00     3  nginx
12时43分34秒 65534      6026   39.00   47.33    0.00    6.00   86.33     7  nginx
12时43分34秒 65534      6027   34.00   44.00    0.00   13.00   78.00     2  nginx
12时43分34秒 65534      6028   34.67   44.67    0.00   10.33   79.33     0  nginx
12时43分34秒 65534      6029   37.33   43.33    0.00    9.67   80.67     2  nginx
12时43分34秒  1000      7531    0.33    0.33    0.00    0.00    0.67     6  pidstat

12时43分34秒   UID       PID    %usr %system  %guest   %wait    %CPU   CPU  Command
12时43分37秒     0        15    0.00    0.33    0.00    0.67    0.33     2  rcu_preempt
12时43分37秒     0        49    0.00   98.67    0.00    0.67   98.67     5  ksoftirqd/5
12时43分37秒  1000      4072    0.33    0.00    0.00    0.00    0.33     6  sshd-session
12时43分37秒 65534      6022   34.67   42.67    0.00   13.00   77.33     4  nginx
12时43分37秒 65534      6023   36.00   42.67    0.00   11.67   78.67     6  nginx
12时43分37秒 65534      6024   37.67   43.33    0.00    9.00   81.00     0  nginx
12时43分37秒 65534      6025   34.33   42.33    0.00   10.00   76.67     4  nginx
12时43分37秒 65534      6026   35.67   42.33    0.00   10.00   78.00     1  nginx
12时43分37秒 65534      6027   36.67   44.67    0.00    8.00   81.33     7  nginx
12时43分37秒 65534      6028   34.67   42.33    0.00   10.33   77.00     2  nginx
12时43分37秒 65534      6029   35.33   46.67    0.00    8.00   82.00     7  nginx
12时43分37秒  1000      7531    0.00    0.33    0.00    0.33    0.33     3  pidstat
结论
没想到单台服务器能通过网络提供超过20w的qps,颠覆了之前的认知。
看来之前做性能测试,没有选择合适的工具和部署合适的测试环境。
后续规划
- 现在使用了http的keep-alive机制,如果是直接使用短连接,qps能达到多少?
- web服务端-服务器处于饱和状态,是网络达到了瓶颈(或者说网络收发包的极限是什么),还是cpu达到了瓶颈,这个需要测量一下。
- 引入多个web服务端和负载均衡。
- 测试网络收发包的带宽和延迟。