initBarChart() {
const chartDom = document.getElementById('barChart');
if (!chartDom) return;
const myChart = echarts.init(chartDom);
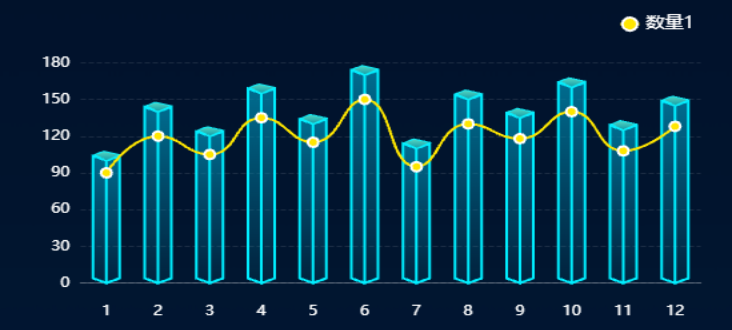
const categories = ['1', '2', '3', '4', '5', '6', '7', '8', '9', '10', '11', '12'];
const barData = [100, 140, 120, 155, 130, 170, 110, 150, 135, 160, 125, 145];
const lineData = [90, 120, 105, 135, 115, 150, 95, 130, 118, 140, 108, 128];
const barGradient = new echarts.graphic.LinearGradient(0, 0, 0, 1, [
{ offset: 0, color: 'rgba(0, 240, 255, 0.55)' },
{ offset: 0.5, color: 'rgba(0, 180, 200, 0.55)' },
{ offset: 1, color: 'rgba(0, 100, 130, 0.25)' }
]);
const CubeLeft = echarts.graphic.extendShape({
shape: {
x: 0,
y: 0,
},
buildPath: function (ctx, shape) {
const xAxisPoint = shape.xAxisPoint;
const c0 = [shape.x, shape.y];
const c1 = [shape.x - 10, shape.y - 4];
const c2 = [xAxisPoint[0] - 10, xAxisPoint[1] - 4];
const c3 = [xAxisPoint[0], xAxisPoint[1]];
ctx
.moveTo(c0[0], c0[1])
.lineTo(c1[0], c1[1])
.lineTo(c2[0], c2[1])
.lineTo(c3[0], c3[1])
.closePath();
},
});
const CubeRight = echarts.graphic.extendShape({
shape: {
x: 0,
y: 0,
},
buildPath: function (ctx, shape) {
const xAxisPoint = shape.xAxisPoint;
const c1 = [shape.x, shape.y];
const c2 = [xAxisPoint[0], xAxisPoint[1]];
const c3 = [xAxisPoint[0] + 10, xAxisPoint[1] - 4];
const c4 = [shape.x + 10, shape.y - 4];
ctx
.moveTo(c1[0], c1[1])
.lineTo(c2[0], c2[1])
.lineTo(c3[0], c3[1])
.lineTo(c4[0], c4[1])
.closePath();
},
});
const CubeTop = echarts.graphic.extendShape({
shape: {
x: 0,
y: 0,
},
buildPath: function (ctx, shape) {
// 逆时针 角 y 负数向上 X 负数向左
const c1 = [shape.x, shape.y];
const c2 = [shape.x + 10, shape.y - 5];
const c3 = [shape.x - 2, shape.y - 8];
const c4 = [shape.x - 9, shape.y - 5];
ctx
.moveTo(c1[0], c1[1])
.lineTo(c2[0], c2[1])
.lineTo(c3[0], c3[1])
.lineTo(c4[0], c4[1])
.closePath();
},
});
echarts.graphic.registerShape("CubeLeft", CubeLeft);
echarts.graphic.registerShape("CubeRight", CubeRight);
echarts.graphic.registerShape("CubeTop", CubeTop);
const option = {
legend: {
data: ['数量', '数量1'],
right: '5%',
top: '2%',
textStyle: {
color: '#fff',
fontSize: 14
},
itemWidth: 14,
itemHeight: 14
},
grid: {
left: '5%',
right: '5%',
top: '18%',
bottom: '8%',
containLabel: true
},
tooltip: {
trigger: 'axis',
backgroundColor: 'rgba(0,0,0,0.5)',
borderColor: 'rgba(0,0,0,0)',
textStyle: {
color: '#fff',
fontSize: 14
}
},
xAxis: {
type: 'category',
data: categories,
axisLine: {
lineStyle: {
color: 'rgba(255,255,255,0.3)'
}
},
axisTick: { show: false },
axisLabel: {
color: '#fff',
fontSize: 12
},
offset: 10,
},
yAxis: {
type: 'value',
// min: 60,
// max: 180,
// interval: 30,
axisLine: { show: false },
axisTick: { show: false },
axisLabel: {
color: '#fff',
fontSize: 12
},
splitLine: {
lineStyle: {
color: 'rgba(255,255,255,0.1)',
type: 'dashed'
}
}
},
series: [
{
type: "custom",
renderItem: (params, api) => {
const location = api.coord([api.value(0), api.value(1)]);
return {
type: "group",
children: [
{
type: "CubeLeft",
shape: {
api,
xValue: api.value(0),
yValue: api.value(1),
x: location[0],
y: location[1],
xAxisPoint: api.coord([api.value(0), 0]),
},
style: {
fill: new echarts.graphic.LinearGradient(0, 0, 0, 1, [
{
offset: 0,
color: "rgba(0,131,168,0.8)",
},
{
offset: 1,
color: "rgba(0,131,168,0.1)",
},
]),
stroke: '#00eeff', // 红色边框
lineWidth: 2 // 边框宽度(可根据需要调整)
},
},
{
type: "CubeRight",
shape: {
api,
xValue: api.value(0),
yValue: api.value(1),
x: location[0],
y: location[1],
xAxisPoint: api.coord([api.value(0), 0]),
},
style: {
fill: new echarts.graphic.LinearGradient(0, 0, 0, 1, [
{
offset: 0,
color: "rgba(0,131,168,0.8)",
},
{
offset: 1,
color: "rgba(0,131,168,0.1)",
},
]),
stroke: '#00eeff', // 红色边框
lineWidth: 2 // 边框宽度(可根据需要调整)
},
},
{
type: "CubeTop",
shape: {
api,
xValue: api.value(0),
yValue: api.value(1),
x: location[0],
y: location[1],
xAxisPoint: api.coord([api.value(0), 0]),
},
style: {
fill: new echarts.graphic.LinearGradient(0, 0, 0, 1, [
{
offset: 0,
color: "#59dcc5",
},
{
offset: 1,
color: "#1096a4",
},
]),
stroke: '#0eebf6', // 红色边框
lineWidth: 1 // 边框宽度(可根据需要调整)
},
},
],
};
},
data: barData,
},
{
name: '数量1',
type: 'line',
smooth: true,
symbol: 'circle',
symbolSize: 8,
data: lineData,
lineStyle: {
width: 2,
color: '#ffe600'
},
itemStyle: {
color: '#ffe600',
borderWidth: 2,
borderColor: '#fff'
},
z: 3
}
]
};
myChart.setOption(option);
window.addEventListener('resize', () => {
myChart.resize();
});
},